. 2024 Mar 1;131(3):492-508.
doi: 10.1152/jn.00361.2023. Epub 2024 Jan 24.

Coherent olfactory bulb gamma oscillations arise from coupling independent columnar oscillators

Affiliations

Coherent olfactory bulb gamma oscillations arise from coupling independent columnar oscillators

Shane T Peace et al. J Neurophysiol. .

Abstract

Spike timing-based representations of sensory information depend on embedded dynamical frameworks within neuronal networks that establish the rules of local computation and interareal communication. Here, we investigated the dynamical properties of olfactory bulb circuitry in mice of both sexes using microelectrode array recordings from slice and in vivo preparations. Neurochemical activation or optogenetic stimulation of sensory afferents evoked persistent gamma oscillations in the local field potential. These oscillations arose from slower, GABA(A) receptor-independent intracolumnar oscillators coupled by GABA(A)-ergic synapses into a faster, broadly coherent network oscillation. Consistent with the theoretical properties of coupled-oscillator networks, the spatial extent of zero-phase coherence was bounded in slices by the reduced density of lateral interactions. The intact in vivo network, however, exhibited long-range lateral interactions that suffice in simulation to enable zero-phase gamma coherence across the olfactory bulb. The timing of action potentials in a subset of principal neurons was phase-constrained with respect to evoked gamma oscillations. Coupled-oscillator dynamics in olfactory bulb thereby enable a common clock, robust to biological heterogeneities, that is capable of supporting gamma-band spike synchronization and phase coding across the ensemble of activated principal neurons.NEW & NOTEWORTHY Odor stimulation evokes rhythmic gamma oscillations in the field potential of the olfactory bulb, but the dynamical mechanisms governing these oscillations have remained unclear. Establishing these mechanisms is important as they determine the biophysical capacities of the bulbar circuit to, for example, maintain zero-phase coherence across a spatially extended network, or coordinate the timing of action potentials in principal neurons. These properties in turn constrain and suggest hypotheses of sensory coding.

Keywords: multielectrode arrays; neural circuit; optogenetics; slice electrophysiology; synchronization.


Conflict of interest statement

No conflicts of interest, financial or otherwise, are declared by the authors.

Figures

None
Graphical abstract
Figure 1.
Figure 1.
MEA recordings from olfactory bulb slices. A: 25-μm fixed OB slice from an OMP-ChR2-EYFP plasmid transgenic mouse (ORC-M) imaged with a fluorescent microscope. ChR2-EYFP coexpression in OSN axonal arbors is limited to the glomerular layer. Inset (×20 magnification) shows distinguishable glomeruli. B: autocorrelation of 250 ms of bandpass-filtered data (20–70 Hz; red) over 3 min following stimulation with 100 μM of the group I/II mGluR agonist ACPD, compared with baseline activity 50 s before agonist application (black). Transient ACPD presentation generated a strong ∼40-Hz gamma oscillation in the slice. C: single electrode recording from spontaneously firing presumptive MC used to align slice to array. Bottom depicts a 250-ms window revealing the presence of multiple spike waveforms. Red overlay shows bandpass-filtered data in the OB “slice gamma” range (20–70 Hz). D: single-electrode spectrogram illustrating an ACPD-induced persistent gamma oscillation. The ACPD agonist was delivered at time = 0. Arrow indicates the starting time of the data window analyzed in C. E: automated gamma oscillation detection (see methods) extracts high-power regions of oscillations for array-wide visualization and further analysis. Peak extractions are from spectrogram data depicted in D. F: MEA schematic overlaid across an OB slice. Interelectrode distance is 200 µm. Schematic depicts gamma-band (20–70 Hz) LFP power in each electrode integrated across 5 s of recording following stimulation with ACPD (pink saturation indicates higher gamma-band power in log scale; i.e., units are in powers of 10). The majority of gamma band activity occurs in the external plexiform layer (EPL) immediately superficial to the mitral cell layer (dotted line). ACPD, 1-amino-1,3-dicarboxycyclopentane; ChR2, channelrhodopsin-2; EYFP, enhanced yellow fluorescent protein; LFP, local field potential; MC, mitral cell; MEA, microelectrode array; OB, olfactory bulb; OMP, olfactory marker protein; OSN, olfactory sensory neuron.
Figure 2.
Figure 2.
Induced gamma oscillations recorded across multiple electrodes. A, left: overlaid recordings from multiple MEA electrodes on a single slice following ChR2 stimulation with blue light. Seven electrodes exhibited robust gamma oscillations and were included in analyses; their locations are highlighted within the MEA schematic (top right inset). The highlighted segment of the gamma traces denotes the 80-s quasi-steady-state oscillation data used for all data analyses. Note that the seven oscillations in this particular slice converge onto two stable gamma frequencies rather than one (see text and Fig. 4, AC). Middle: overlaid recordings from eight MEA electrodes on a single slice simultaneously exhibiting gamma oscillations following application of 100 μL of the mGluR I/II agonist ACPD (100 μM). Right: overlaid recordings from five MEA electrodes on a single slice simultaneously exhibiting gamma oscillations following application of 100 μL of the cholinergic agonist carbachol (186 μM). Note that the induced oscillations persist long after the termination of optical stimulation or the estimated washout times. B: overlaid average power spectra following ChR2 activation (n = 11 slices/25 electrodes), ACPD application (n = 11 slices/53 electrodes), or CCh application (n = 5 slices/18 electrodes), with emergent power normalized to baseline spectral power at each frequency (see methods) such that the plots illustrate the changes in neural activity spectra arising from the effects of each stimulation. Shading depicts the SE. C: histogram showing the average peak frequencies from each 80 s traced oscillation induced by ChR2 stimulation (25 electrodes), ACPD (53 electrodes), or CCh (18 electrodes). The multiple peaks shown in the ACPD power spectrum reflect variance among slices more than genuine multimodality; among ACPD-activated slices, 36 of 53 electrodes exhibited a single spectral peak, whereas the remainder exhibited two peaks or broadband activation. D: integrated gamma-band power in each individual electrode (gray lines) and the means across electrodes (colored lines), both before (pre) and after (post) the stimulation of ChR2 or the application of ACPD or CCh. All three methods of stimulation induced significant increases in integrated gamma band power compared with baseline activity [Wilcoxon signed-rank tests; ChR2, T(n = 25) = 60, P < 0.01; ACPD, T(n = 53) = 48, P < 0.001; CCh, T(n = 18) = 31, P < 0.02]. ACPD, 1-amino-1,3-dicarboxycyclopentane; CCh, carbachol; ChR2, channelrhodopsin-2; MEA, multielectrode array. *P < 0.05; **P < 0.01; ***P < 0.001.
Figure 3.
Figure 3.
Gamma oscillations phase-constrain evoked MC action potentials. A: unfiltered recordings from one electrode (black trace) show principal neuron action potentials that are phase-constrained with respect to the coherent gamma oscillations simultaneously recorded from a separate electrode (red trace; interelectrode distance = 565 μm). Right depicts the electrodes’ locations. B–D: spike phase histograms for action potentials recorded from a principal neuron following (B) optical stimulation of ChR2 or chemical stimulation with ACPD (C), or carbachol (D) as in Fig. 2. ACPD, 1-amino-1,3-dicarboxycyclopentane; CCh, carbachol; ChR2, channelrhodopsin-2; MC, mitral cell.
Figure 4.
Figure 4.
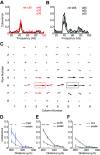
OB slices can exhibit multiple local regions of coherent gamma oscillations. A: coherence between a selected reference electrode (e36; nomenclature based on XY coordinates as shown in C) and three adjacent electrodes in a selected slice. The frequency with the highest coherence magnitude in this region is 43 Hz. B: coherence between another reference electrode (e66) and three additional adjacent electrodes, in the same slice depicted in A. The frequency with the highest coherence magnitude in this region is 40 Hz. C: quiver plot illustrating these two adjacent, simultaneous regions of coherence, respectively, centered on reference electrodes e36 (43 Hz, red arrows) and e66 (40 Hz, black arrows). Reference electrodes are boxed. The lengths of the arrows indicate coherence magnitude and the angles indicate phase; rightward facing arrows denote zero phase lag with respect to the corresponding reference electrode. Note the nonoverlapping regions of coherence for each reference frequency. D: plots of mean coherence magnitude versus interelectrode distance before and after ChR2 optical stimulation. The ordinate depicts the average coherence magnitude based on 80 s of quasistationary data averaged across all pairs of active electrodes separated by the distance depicted on the abscissa (200–565 μm). Interelectrode coherence was significantly increased by ChR2 stimulation at distances of 200 and 280 μm, but not at longer distances (n = 2 slices, 2 electrodes; 200 μm: P = 0.003; 280 μm: P = 0.026; see text for details). Error bars indicate SE. E: the application of ACPD also significantly increased gamma-band coherence between electrodes at distances of 200 and 280 μm, but not at longer distances (n = 10 slices, 15 electrodes; P < 0.001 for both distances). F: the application of carbachol also significantly increased gamma-band coherence between electrodes at distances of 200 and 280 μm, but not at longer distances (n = 2 slices, 3 electrodes; P < 0.01 for both distances). ACPD, 1-amino-1,3-dicarboxycyclopentane; CCh, carbachol; ChR2, channelrhodopsin-2; OB, olfactory bulb. *P < 0.05; **P < 0.01; ***P < 0.001.
Figure 5.
Figure 5.
Intercolumnar synchronization is mediated by GABA(A) receptors, whereas local oscillations are GABA(A) receptor-independent. A: spectrogram illustrating a long-lasting gamma-band oscillation induced by the transient application of ACPD (100 μL bolus delivered at t = 0) during bath application of 50 μM BMI. B: average power spectra comparing oscillations induced by ACPD in an aCSF bath (green trace) to those induced under BMI blockade (50–500 μm BMI; violet trace). Only slices for which 80 s of data were recorded under both conditions were included in the analysis (n = 5 slices, 22 electrodes). The BMI bath induced a significant reduction in the mean oscillation frequency [34 ± 2.15 Hz to 29 ± 1.19 Hz; paired t test; t(21) = 3.27, P < 0.01], but no significant change in power. Shading depicts the SE. C: mean true coherence with respect to distance arising from ACPD-induced oscillations in plain aCSF (vehicle control; green) and after the addition of the GABA(A) receptor antagonist BMI (n = 3 slices, 10 electrodes; 50–500 μM; violet). *Significant differences between the aCSF and BMI conditions (P < 0.001). D: quiver plot illustrating the spatial extent of gamma coherence with reference electrode e26 at 54 Hz under control conditions. E: no interelectrode coherence is evident at 33 Hz under these control conditions. F: after BMI is added, interelectrode coherence at 54 Hz disappears, in part because BMI treatment reduced the peak frequency of the local coherence group to 33 Hz. G: in the presence of BMI, gamma power across active electrodes remained strong, with a mean peak frequency of 33 Hz. However, interelectrode coherence was weak to negligible, indicating that BMI treatment had decoupled these local oscillators. H: spectrogram of OB slice activity in a 50 μM bath of the GABA(A) agonist muscimol. Muscimol reduced spontaneous activity and entirely prevented the evocation of gamma band activity by ChR2 optical stimulation (5 s, delivered from time = 0). I: the addition of 100 μM BMI to the bath (in addition to the muscimol) rescued the ability to evoke gamma oscillations by stimulation with 475 nm blue light (5 s, from time = 0). J: averaged power spectra of light-induced oscillations (n = 4 slices, 52 electrodes) in muscimol bath (red trace) and in muscimol + BMI (violet trace). Shading depicts the SE. ACPD, 1-amino-1,3-dicarboxycyclopentane; aCSF, artificial cerebrospinal fluid; BMI, bicuculline methiodide; ChR2, channelrhodopsin-2. ***P < 0.001.
Figure 6.
Figure 6.
Lateral excitation and inhibition in vitro and in vivo. A–C: in vitro. A: recording and stimulation configuration. Whole cell patch recordings were taken from MCs (red) or GCs (black) in OB slices from OMP-ChR2 mice. A modified projector (see methods) was used to illuminate 500 µm × 100 µm rectangles across the glomerular layer (GL; 500 µm along the OSN-GL-EPL axis, 100 µm along the GL). B: 100-ms blue light pulses delivered at a range of distances from the recording site evoked depolarization and action potential discharge in MCs (red traces) and GC (black traces; two repetitions each for one example cell). Distances were normalized to the illumination rectangle resulting in the strongest depolarization. C: distance-dependence of responses (average of 0.5–1 s following the start of light stimulation) normalized to the maximum for each cell (n = 6–10 MCs and n = 6 or 7 GCs for distances ≤ 600 µm; n = 1–6 cells for larger distances). Curves are Gaussian fits. D–F: in vivo. D: recording and stimulation configuration. Whole cell patch recordings were performed in anesthetized OMP-ChR2 mice from putative MCs and GCs from the dorsal aspect of the OB. The same projector as in A–C was used to deliver concentric rings of illumination (100 µm thick) centered around the region of maximal activation on the dorsal surface. E: evoked activity in an example MC (red trace) and GC (black trace) in response to brief (100 ms) light stimulation; 10 repetitions are shown with one repetition in bold. The abscissa denotes the distance from the center of the stimulus pattern to the interior diameter of the illuminated ring. Note the robust hyperpolarization of the MC at 538 µm and robust depolarization of the GC across all distances. F: distance-dependence of responses normalized as in C. Fitted curves are linear (for GCs; n = 6) and Gaussian (for MCs; n = 3) fits. Data in C and F are depicted as means ± SE. ChR2, channelrhodopsin-2; GC, granule cell; MC, mitral cell.
Figure 7.
Figure 7.
Computational modeling shows how local coherence regions in slices predict global gamma coherence in the intact OB. A: the 64 mitral cells in the model were arranged in an 8 by 8 square array with equal separation in both the horizontal and vertical directions across a two-dimensional surface (1,000 μm × 1,000 μm). Periglomerular cells corresponded 1:1 with MCs, whereas 256 GCs were deployed in a separate 16 × 16 array (not shown) across the same surface. The network connection probability between MCs and GCs declined linearly with distance in the intact (in vivo) OB condition. In the slice condition, the connection probability between MCs and GCs separated by greater than 250 μm (indicated by a circle) was reduced to zero, but was unaffected at distances of 250 μm or less. See text and methods for details. B: global properties of the bulbar LFP in the intact (in vivo) OB network model. The top depicts the simulated LFP averaged across the full network during odor presentation, the middle depicts the autocorrelation of this simulated LFP, and the bottom depicts the power spectrum. C: global properties of the bulbar LFP in the OB network model under slice conditions. Panels are as described in B. D: quiver plots of network coherence at three frequencies identified and measured in the slice condition. The reference electrode for each frequency is circled; the magnitude of coherence of each electrode with the reference electrode is denoted by the length of the corresponding arrows, whereas phase with respect to the reference electrode is denoted by their angle. Left depicts the coherence profile across the electrode array at 44 Hz, middle depicts the coherence profile at 35 Hz, and right depicts the coherence profile at 37 Hz. See text for details. E: quiver plots of network coherence in the in vivo OB network with respect to the same three reference electrodes identified in the slice condition and depicted in D. Note that the intact network, with its greater connectivity but otherwise identical properties, imposes a single common frequency (43 Hz) and shared phase upon the LFPs measured at all electrode sites, overpowering the preferred frequencies of local regions that were observable in the reduced coupling density of the slice condition. GC, granule cell; LFP, local field potential; MC, mitral cell; OB, olfactory bulb.

Similar articles

Cited by

References

    1. Fries P. Neuronal gamma-band synchronization as a fundamental process in cortical computation. Annu Rev Neurosci 32: 209–224, 2009. doi:10.1146/annurev.neuro.051508.135603. - DOI - PubMed
    1. Shouval HZ, Wang SS, Wittenberg GM. Spike timing dependent plasticity: a consequence of more fundamental learning rules. Front Comput Neurosci 4: 19, 2010. doi:10.3389/fncom.2010.00019. - DOI - PMC - PubMed
    1. Theunissen F, Miller JP. Temporal encoding in nervous systems: a rigorous definition. J Comput Neurosci 2: 149–162, 1995. doi:10.1007/BF00961885. - DOI - PubMed
    1. Kashiwadani H, Sasaki YF, Uchida N, Mori K. Synchronized oscillatory discharges of mitral/tufted cells with different molecular receptive ranges in the rabbit olfactory bulb. J Neurophysiol 82: 1786–1792, 1999. doi:10.1152/jn.1999.82.4.1786. - DOI - PubMed
    1. Lepousez G, Lledo PM. Odor discrimination requires proper olfactory fast oscillations in awake mice. Neuron 80: 1010–1024, 2013. doi:10.1016/j.neuron.2013.07.025. - DOI - PubMed

Publication types

LinkOut - more resources