. 2024 Feb 16;134(4):371-389.
doi: 10.1161/CIRCRESAHA.123.322381. Epub 2024 Jan 24.

Indole-3-Propionic Acid Protects Against Heart Failure With Preserved Ejection Fraction

Affiliations

Indole-3-Propionic Acid Protects Against Heart Failure With Preserved Ejection Fraction

Yu-Chen Wang et al. Circ Res. .

Abstract

Background: Heart failure with preserved ejection fraction (HFpEF) is a common but poorly understood form of heart failure, characterized by impaired diastolic function. It is highly heterogeneous with multiple comorbidities, including obesity and diabetes, making human studies difficult.

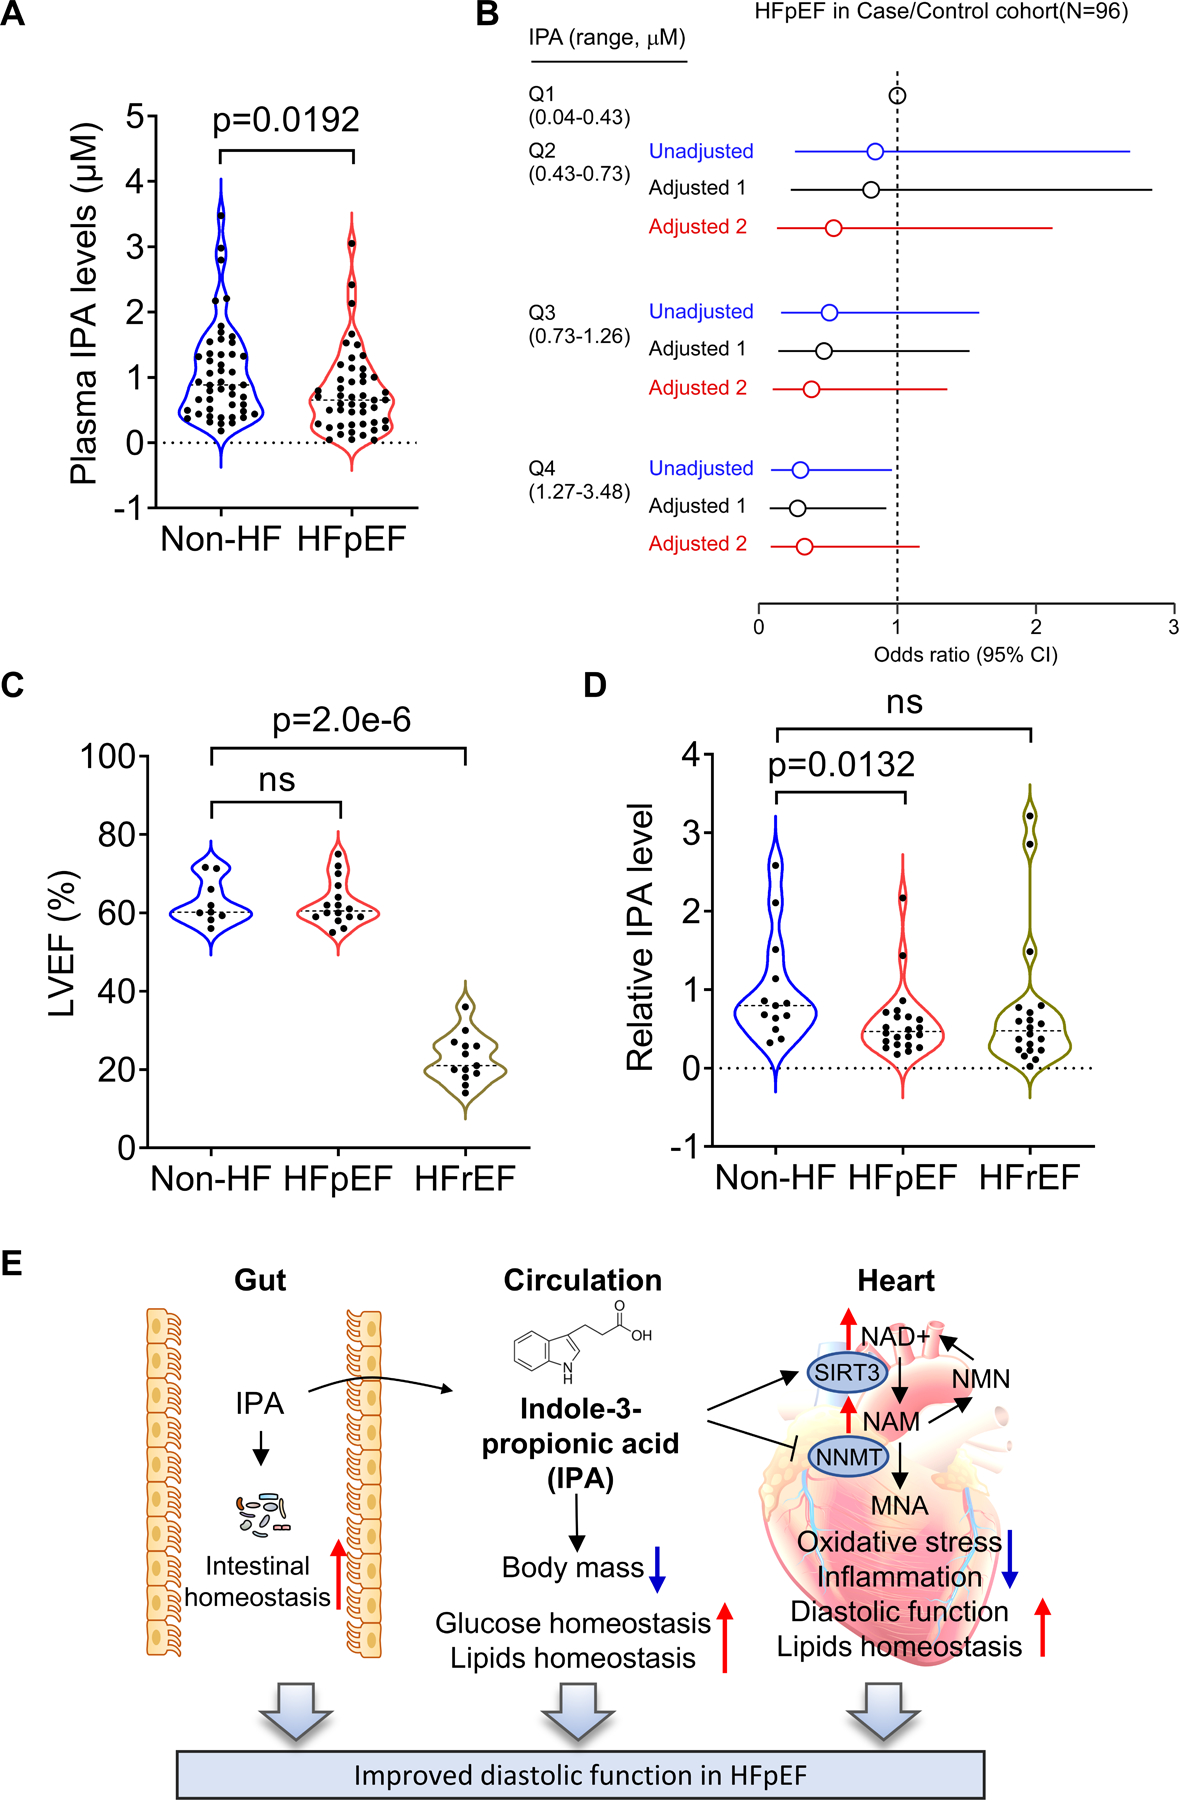
Methods: Metabolomic analyses in a mouse model of HFpEF showed that levels of indole-3-propionic acid (IPA), a metabolite produced by gut bacteria from tryptophan, were reduced in the plasma and heart tissue of HFpEF mice as compared with controls. We then examined the role of IPA in mouse models of HFpEF as well as 2 human HFpEF cohorts.

Results: The protective role and therapeutic effects of IPA were confirmed in mouse models of HFpEF using IPA dietary supplementation. IPA attenuated diastolic dysfunction, metabolic remodeling, oxidative stress, inflammation, gut microbiota dysbiosis, and intestinal epithelial barrier damage. In the heart, IPA suppressed the expression of NNMT (nicotinamide N-methyl transferase), restored nicotinamide, NAD+/NADH, and SIRT3 (sirtuin 3) levels. IPA mediates the protective effects on diastolic dysfunction, at least in part, by promoting the expression of SIRT3. SIRT3 regulation was mediated by IPA binding to the aryl hydrocarbon receptor, as Sirt3 knockdown diminished the effects of IPA on diastolic dysfunction in vivo. The role of the nicotinamide adenine dinucleotide circuit in HFpEF was further confirmed by nicotinamide supplementation, Nnmt knockdown, and Nnmt overexpression in vivo. IPA levels were significantly reduced in patients with HFpEF in 2 independent human cohorts, consistent with a protective function in humans, as well as mice.

Conclusions: Our findings reveal that IPA protects against diastolic dysfunction in HFpEF by enhancing the nicotinamide adenine dinucleotide salvage pathway, suggesting the possibility of therapeutic management by either altering the gut microbiome composition or supplementing the diet with IPA.

Keywords: NAD; heart failure, diastolic; microbiota; niacinamide; receptors, aryl hydrocarbon.


Conflict of interest statement

Disclosures Wilson Tang is a consultant for Sequana Medical A.V., Cardiol Therapeutics Inc, Genomics plc, Zehna Therapeutics Inc, Renovacor Inc and has received honorarium from Springer Nature for authorship/editorship and American Board of Internal Medicine for exam writing committee. S.L. Hazen reports being named as co-inventors on pending and issued patents held by the Cleveland Clinic relating to cardiovascular diagnostics and therapeutics. S.L. Hazen reports having received royalty payments for inventions or discoveries related to cardiovascular diagnostics or therapeutics from Cleveland Heart laboratory, a fully owned subsidiary of Quest Diagnostics, and Procter & Gamble. S.L. Hazen is a paid consultant for Zehna Therapeutics and Proctor & Gamble and has received research funds from Zehna Therapeutics, Proctor & Gamble, Pfizer Inc, and Roche Diagnostics.

Figures

Figure 1.
Figure 1.. HFpEF mice exhibit metabolic remodeling which is associated with diastolic dysfunction.
C57BL/6J male mice were fed with chow diet or HFD + l-NAME for 7 weeks. A. Body weight at baseline, weeks 3, 5, and 7. HFD, high-fat diet. n = 10. B-C. Heart weight/tibia length ratio (B) and lung weight (wet/dry ratio, c) were measured after 7 weeks of chow diet or HFD + l-NAME. n = 10. d-h. Representative images of echocardiography (D), E/A ratio (e), E/e’ ratio (f), left ventricle ejection fraction (G), and left ventricle mass/surface area (H) were measured in chow diet (n = 8) or HFD + l-NAME (n = 10) mice. i. Exercise tolerance test showing total running distance of chow diet (n = 8) and HFD + l-NAME (n = 13) fed mice in a treadmill. J-K. Fat mass (J) and lean mass (K) at baseline, weeks 3, 5, and 7. n = 10. L-Q. Plasma total cholesterol (L), unesterified cholesterol (M), glucose tolerance test and quantification (N), plasma glucose (O), insulin (P) and calculated HOMA-IR (Q) were measured after 7 weeks of chow diet (n = 8) or HFD + l-NAME (n = 11) feeding. R-U. “Two-hit” HFpEF model was induced in 30 inbred strains of male mice. The correlation between metabolic traits (glucose tolerance, homeostatic model assessment for insulin resistance (HOMA-IR), plasma total cholesterol, and insulin) and diastolic function traits (E/e’ ratio and E/A ratio) were examined. Each dot represents one mouse. Representative of 5 (A-Q) experiments. Each point represents a mouse. All data are presented as the mean ± SEM. p<0.05 are statistically significant and precise values are specified in corresponding figures. ns, no significant. Data were analyzed by Student’s t test (B, C, H, I, L-Q), by 2-way ANOVA (A, E, F, G, J, K, N) or by Spearman’s rank correlation (R-U).
Figure 2.
Figure 2.. Decreased heart and plasma IPA levels in HFpEF mice.
C57BL/6J male mice were fed with chow diet or HFD + l-NAME for 7 weeks. Heart tissue and plasma were collected for metabolomics. A. Principal component analysis (PCA) plot of chow and HFD + l-NAME (HFpEF) samples. B. Heatmap depicting relative abundance of significantly differentiated metabolites in heart tissue from HFpEF (n = 7) versus chow (n = 8) mice. C. Heatmap depicting relative abundance of significantly differentiated metabolites in plasma from HFpEF (n = 8) versus chow (n = 8) mice. D. Intermediates in tryptophan metabolism were decreased in the heart from HFpEF mice relative to control mice. Relative abundance of metabolites was shown and the colored bars denote chow (white) and HFpEF samples (blue). Decreased metabolites were denoted with red arrows. E-I. IPA levels in heart tissue (E) and plasma (F) of male mice as well as the associations between plasma IPA levels, cardiac IPA levels and diastolic parameters (G-I). Representative of 2 (A-I) experiments. Each point represents a mouse. All data are presented as the mean ± SEM. p<0.05 are statistically significant and precise values are specified in corresponding figures. ns, no significant. Data were analyzed by Student’s t test (D, E, F), or by Spearman’s rank correlation (G-I).
Figure 3.
Figure 3.. IPA supplementation attenuates diastolic dysfunction and metabolic remodeling.
C57BL/6J male mice (8 weeks old) were fed with chow diet or HFD + l-NAME containing control or high indole-3-propionic acid (IPA, 562.5 mg IPA/kg diet) for 7 weeks. A. Experimental design. B-C. Relative IPA levels in plasma (B) and heart tissue (C) of mice fed with HFD + l-NAME containing control (n = 8) or high IPA (n = 8). D-E. Body weight (D) and fat mass (E) at baseline, weeks 2, 5, and 7. n = 4 in Chow and Chow + IPA; n = 8 in HFpEF and HFpEF + IPA. F-G. Glucose tolerance test (F) and insulin tolerance test (G) as well as the area under curve (AUC) of the mice after 7 weeks of chow diet or HFD + l-NAME containing control or high-IPA. *P < 0.05 and **P < 0.01 of glucose levels between HFpEF and HFpEF + IPA group. HFpEF and Chow group were significantly different (asterisks shown in AUC). n = 4 in Chow and Chow + IPA; n = 8 in HFpEF and HFpEF + IPA. H-L. White adipose weights (H), brown adipose weights (I), plasma total cholesterol (J), unesterified cholesterol (K), and free fatty acids (L) of the mice fed with chow diet or HFD + l-NAME containing control or high-IPA for 7 weeks. n = 4 in Chow and Chow + IPA; n = 8 in HFpEF and HFpEF + IPA. M-R. Heart weight/tibia length ratio (M), representative images of echocardiography (N), E/A ratio (O), E/e’ ratio (P), LV mass/surface area (Q), and exercise tolerance test (R) were measured. Running distance was assessed at the end of feeding and echocardiography was determined at baseline, week 4, and week 7. n = 4 in Chow and Chow + IPA; n = 8 in HFpEF and HFpEF + IPA. Representative of 4 (A-R) experiments. Each point represents a mouse. All data are presented as the mean ± SEM. p<0.05 are statistically significant and precise values are specified in corresponding figures. ns, no significant. Data were analyzed by Student’s t test (B, C), by Kruskal-Wallis test (H-M, Q-R), or by 2-way ANOVA (D-G, O-P). For D-G and O-R, the p values indicate significance between HFpEF and HFpEF + IPA group.
Figure 4.
Figure 4.. IPA supplementation increases nicotinamide and SIRT3 levels in the heart.
A. Heatmap depicting relative abundance of significantly differentiated metabolites by IPA in the heart of male mice fed with HFD + l-NAME containing control or high-IPA for 7 weeks. n = 8. B. Relative abundance of indicated metabolites. n = 8. C. Heart nicotinamide (NAM) level in C57BL/6J male mice fed with chow diet, HFD + l-NAME or HFD + l-NAME containing high IPA for 7 weeks. n = 7 in Chow; n=16 in HFpEF; n = 8 in HFpEF + IPA. D. Association between heart IPA and NAM levels in C57BL/6J male mice fed with chow diet or HFD + l-NAME. n = 8. E. NAD salvage pathway. F. NAD+/NADH ratio in the heart tissue of mice fed with chow diet, HFD + l-NAME or HFD + l-NAME containing high IPA for 7 weeks. n = 7 in Chow; n=16 in HFpEF; n = 8 in HFpEF + IPA. G-J. Plasma LPS levels (n = 6) (G), protein carbonyl levels (n = 8) (H), indicated protein levels (n = 3) (I), and protein quantification (J) in the heart tissue of mice fed with chow diet, HFD + l-NAME or HFD + l-NAME containing high IPA for 7 weeks. K-M. Protein levels (K), SIRT3 protein quantification (L) and NNMT protein quantification (M) in HL-1 cells treated with control o1r IPA (1 mM) in the presence of 100 µM phenylephrine (PE) with or without AhR antagonist CH-223191 (5 μM) for 48 hours. N-P. Protein levels (N), SIRT3 protein quantification (O) and RT-qPCR (P) showing Sirt3 knockdown in the heart using AAV9-Sirt3-shRNA. The relative protein levels were determined by comparing them to the first sample in the control group. The relative mRNA levels were determined by comparing them to the average expression in the control group. n = 6. Q-W. C57BL/6J male mice (8 weeks old) were injected with control or AAV9-Sirt3-shRNA, and fed with HFD + l-NAME or HFD + l-NAME containing high IPA for 7 weeks (n = 7). Body weight (Q), fat mass (R), lean mass (S), E/e’ ratio (T), LV mass/surface area (U), LVEF (left ventricular ejection fraction) (V), and heart weight/tibia length (W) were measured after the feeding. Representative of 2 (A-H, N-W), 4 (I, J) and 5 (K-M) experiments. Each point represents a mouse. All data are presented as the mean ± SEM. p<0.05 are statistically significant and precise values are specified in corresponding figures. ns, no significant. Data were analyzed by Student’s t test (B, O, P), by 1-way ANOVA (C, F-H), by Spearman’s rank correlation (D), by Kruskal-Wallis test (L-M), or by 2-way ANOVA (J, Q-W).
Figure 5.
Figure 5.. NAM mitigates diastolic dysfunction in HFpEF.
C57BL/6J male mice were fed with chow diet or HFD + l-NAME containing control or high NAM (550 mg/kg/day in drinking water) for 7 weeks. A-B. Heart NAM (A) and NAD+ (B) levels in HFpEF or HFpEF + NAM groups were measured with HILIC (hydrophilic-interaction chromatography) LC-MS. The relative NAM levels were determined by comparing them to the average expression in the HFpEF group. n = 6. C-F. Cecum samples of Chow, Chow + IPA, HFpEF, HFpEF + IPA, and HFpEF + NAM were collected and 16S rRNA-based gut microbial profiling was performed. Relative abundance of taxa at the phylum level (C), relative abundance of Firmicutes (D), Bacteroidetes (E), and Firmicutes/Bacteroidetes ratio (F) in indicated groups were shown. n = 4 in Chow and Chow + NAM; n = 6 in HFpEF, HFpEF + IPA, and HFpEF + NAM. G-I. Body weight (G), fat mass (H), and lean mass (I) of the mice were measured at baseline, 3, 5, and 7 weeks of feeding with chow diet or HFD + l-NAME containing control or high NAM. n = 4 in Chow and Chow + NAM; n = 8 in HFpEF, and HFpEF + NAM. J-Q. Glucose tolerance test and quantification (J), plasma free fatty acids (K), representative images of echocardiography (L), E/A ratio (M), E/e’ ratio (N), LVEF (O), LV mass/surface area (P), and running distance (Q) were determined. Echocardiography was performed at baseline, weeks 4 and 7 of the feeding and other parameters were collected after 7 weeks of the diet. n = 4 in Chow and Chow + NAM; n = 8 in HFpEF, and HFpEF + NAM. R-X. C57BL/6J male mice were fed with HFD + l-NAME containing control, high IPA, high NAM or high IPA + NAM for 7 weeks. E/A ratio (R), E/e’ ratio (S), LV mass/surface area (T), LVEF (U), heart total cholesterol (V), unesterified cholesterol (W), and free fatty acids (X) were measured after feeding. n = 5. Representative of 2 (R-X) and 3 (A-Q) experiments. Each point represents a mouse. All data are presented as the mean ± SEM. p<0.05 are statistically significant and precise values are specified in corresponding figures. ns, no significant. Data were analyzed by Student’s t test (A, B), by 1-way ANOVA (R-X), by Kruskal-Wallis test (D-F, K, P-Q), or by 2-way ANOVA (G-J, M-O). For G-J and M-O, the p values indicate significance between HFpEF and HFpEF + NAM group.
Figure 6.
Figure 6.. Nnmt ASO alleviates diastolic dysfunction in HFpEF.
C57BL/6J male mice were subjected to once-weekly intraperitoneal injection of control or Nnmt ASO (an antisense oligonucleotide) and were fed with HFD + l-NAME for 7 weeks. A. RT-qPCR (n = 8) and Western blotting (n = 3) showing NNMT levels in the heart tissue from mice treated with CON ASO or Nnmt ASO. CON, control. The relative mRNA levels were determined by comparing them to the average expression in the control group. The relative protein levels were determined by comparing them to the first sample in the control group. B-D. Body weight (B), fat mass (C), and lean mass (D) were measured at baseline, weeks 3, 5, and 7 of the feeding in control (n = 9) or Nnmt ASO mice (n = 10). E-Q. Glucose tolerance test (E), insulin tolerance test (F), plasma insulin (G), HOMA-IR (H), plasma triglycerides (I), total cholesterol (J), unesterified cholesterol (K), running distance (L), representative images of echocardiography (M), E/A ratio (N), E/e’ ratio (O), LVEF (P), and LV mass/surface area (Q) were measured in control (n = 9) or Nnmt ASO mice (n = 10). Echocardiography was performed at baseline, week 4 and 7 of the feeding and other parameters were collected after 7 weeks of feeding. R. RT-qPCR (n = 6) and Western blotting (n = 3) showing Nnmt overexpression in the heart using AAV9-cTnT-Nnmt. The relative mRNA levels were determined by comparing them to the average expression in the control group. The relative protein levels were determined by comparing them to the first sample in the control group. S-Y. C57BL/6J male mice were injected with control or AAV9-cTnT-Nnmt, and fed with HFD + l-NAME or HFD + l-NAME containing high IPA for 7 weeks (n = 7). Body weight (S), fat mass (T), lean mass (U), E/e’ ratio (V), LV mass/surface area (W), LVEF (X), and heart weight/tibia length (Y) were measured after the feeding. n = 7. Representative of 2 (A-Y) experiments. Each point represents a mouse. All data are presented as the mean ± SEM. p<0.05 are statistically significant and precise values are specified in corresponding figures. ns, no significant. Data were analyzed by Student’s t test (A, E-L, Q, R), by 1-way ANOVA (B-F, N-P), or by 2-way ANOVA (S-Y).
Figure 7.
Figure 7.. Therapeutic effects of IPA in HFpEF.
C57BL/6J male mice were fed with chow diet or HFD + l-NAME for 4 weeks and followed by control (HFpEF) or high-IPA supplementation (HFpEF + IPA; 562.5 mg IPA/kg diet) for another 5 weeks. n = 8 in chow, n = 8 in HFpEF, and n = 12 in HFpEF + IPA. A. Experimental design. B-H. Body weight over time (B), insulin (C), calculated HOMA-IR (D), plasma total cholesterol (E), unesterified cholesterol (F), white adipose tissue weight (G), and brown adipose tissue weight (H). I-Q. Representative images of echocardiography (I). E/A ratio (J), E/e’ ratio (K), and LVEF (L) over time, LV mass/surface area (M), heart weight/tibia length ratio (N), lung weight (O), exercise tolerance in running distance (P) and workload (Q) were measured. Representative of 2 (A-Q) experiments. Each point represents a mouse. All data are presented as the mean ± SEM. p<0.05 are statistically significant and precise values are specified in corresponding figures. ns, no significant. Data were analyzed by 1-way ANOVA (B-H, J-Q). For B and J-L, the p values indicate significance between HFpEF and HFpEF + IPA group.
Figure 8.
Figure 8.. IPA levels are reduced in HFpEF patients but not HFrEF patients
A-B. The association of IPA levels with HFpEF in the Cleveland Clinic HFpEF case/control cohort. (A) Violin plots of IPA levels stratified by HFpEF status. Each point represents one patient. Medium is represented by dash line; p value was calculated by Wilcoxon rank sum test. (B) Forest plots indicating the odds of HFpEF according to the quartiles of IPA levels using multivariable logistic regression models. Unadjusted odd ratio (blue), Adjusted Model 1 (age, sex, diabetes, hypercholesterolemia, black), Adjusted Model 2 (age, sex, diabetes, BMI and hypertension, red), symbols represent odds ratios and the 5–95% confidence intervals are indicated by line length. n = 48. C-D. LVEF (C) and arterial abundance of IPA (D) in non-HF controls (n = 13), HFpEF (n = 22), and HFrEF patients (n = 20) from Alfred Hospital HFpEF study. p value was calculated by Wilcoxon rank sum tests. p<0.05 are statistically significant and precise values are specified in corresponding figures. ns, no significant. Each point represents one patient. E. An illustration summarizing how IPA mediates gut-heart crosstalk in HFpEF. IPA feeding improved gut homeostasis by mitigating gut microbiota dysbiosis and intestinal epithelial barrier damage induced by HFpEF. Thus, metabolic remodeling by the diet was attenuated, including reduced body mass gain, improved glucose levels and lipid homeostasis. In the heart, IPA restored NAM and NAD+/NADH levels, increased SIRT3 levels and decreased NNMT levels, attenuating oxidative stress and inflammation in the heart. These beneficial effects collectively protect against diastolic dysfunction in HFpEF.

Comment in

References

    1. Dunlay SM, Roger VL and Redfield MM. Epidemiology of heart failure with preserved ejection fraction. Nat Rev Cardiol 2017;14:591–602. - PubMed
    1. Iwano H and Little WC. Heart failure: what does ejection fraction have to do with it? J Cardiol 2013;62:1–3. - PubMed
    1. Zheng SL, Chan FT, Nabeebaccus AA, Shah AM, McDonagh T, Okonko DO and Ayis S. Drug treatment effects on outcomes in heart failure with preserved ejection fraction: a systematic review and meta-analysis. Heart 2018;104:407–415. - PMC - PubMed
    1. Owan TE, Hodge DO, Herges RM, Jacobsen SJ, Roger VL and Redfield MM. Trends in prevalence and outcome of heart failure with preserved ejection fraction. N Engl J Med 2006;355:251–9. - PubMed
    1. Lam CS, Donal E, Kraigher-Krainer E and Vasan RS. Epidemiology and clinical course of heart failure with preserved ejection fraction. Eur J Heart Fail 2011;13:18–28. - PMC - PubMed

Publication types