. 2024 Mar;18(3):662-676.
doi: 10.1002/1878-0261.13593. Epub 2024 Jan 24.

Liprin-α1 contributes to oncogenic MAPK signaling by counteracting ERK activity

Affiliations

Liprin-α1 contributes to oncogenic MAPK signaling by counteracting ERK activity

Henna Pehkonen et al. Mol Oncol. 2024 Mar.

Abstract

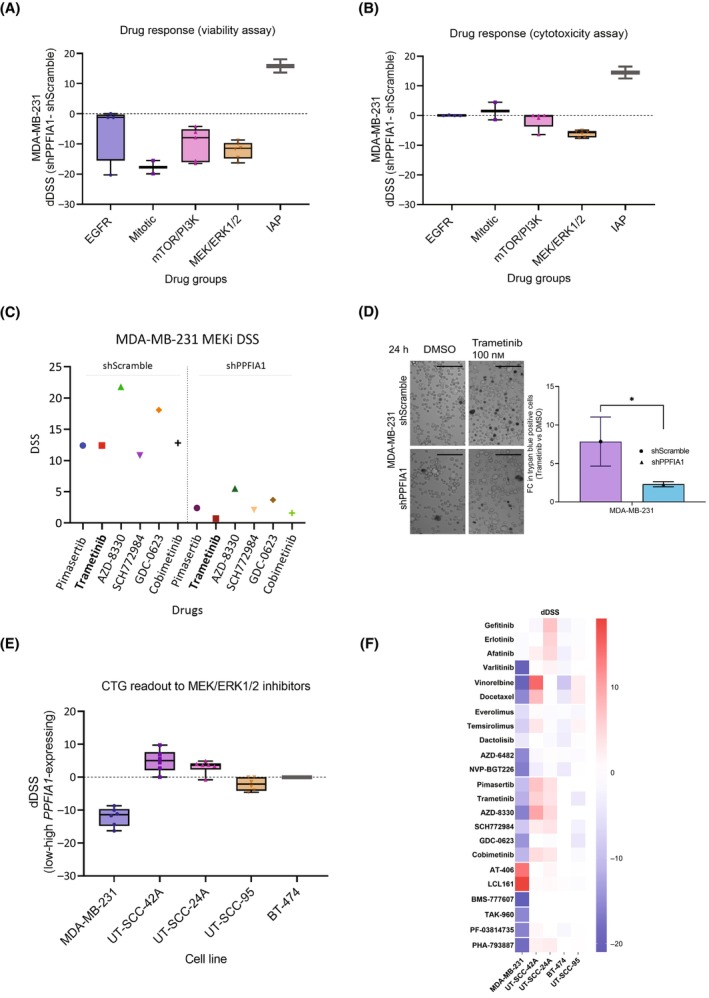
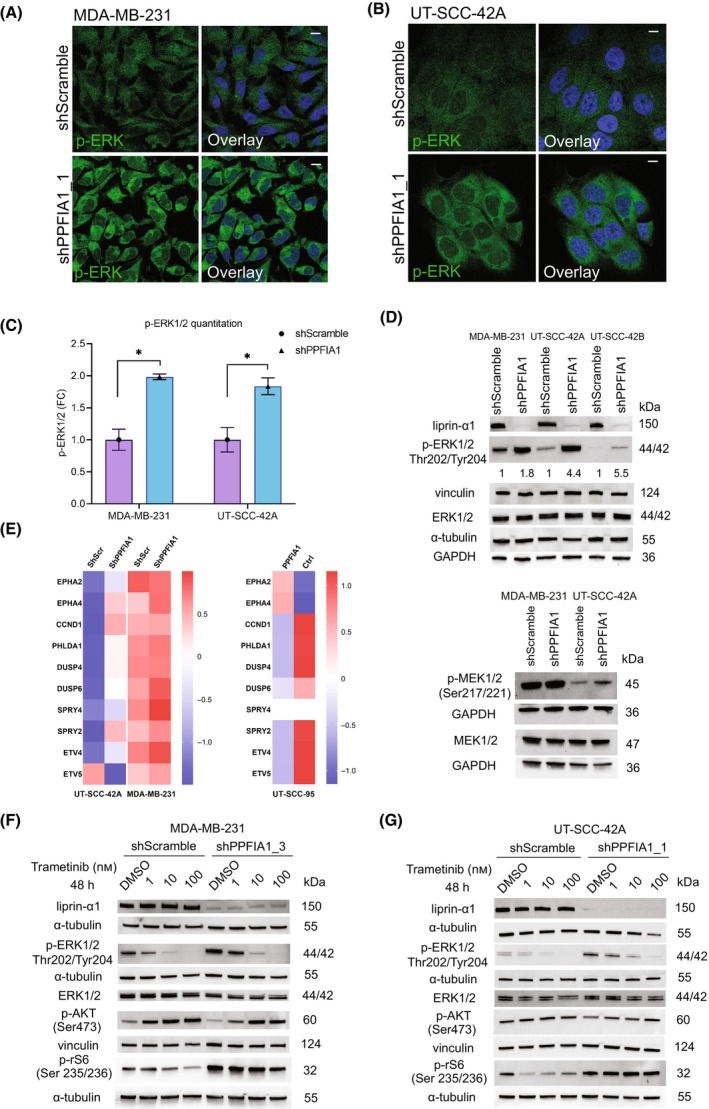
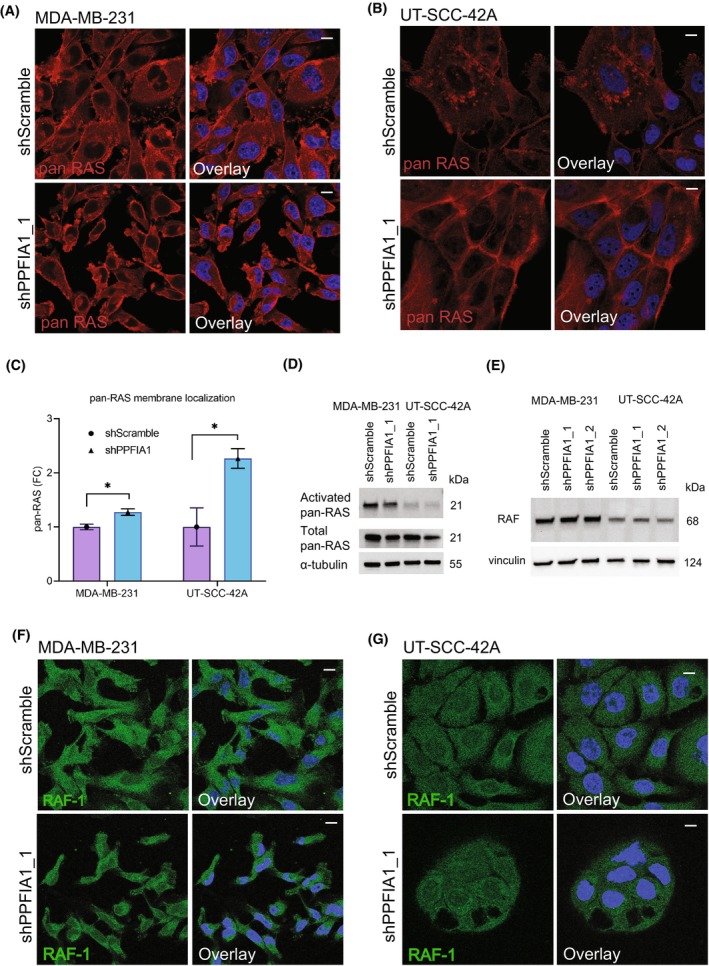
PTPRF interacting protein alpha 1 (PPFIA1) encodes for liprin-α1, a member of the leukocyte common antigen-related protein tyrosine phosphatase (LAR-RPTPs)-interacting protein family. Liprin-α1 localizes to adhesive and invasive structures in the periphery of cancer cells, where it modulates migration and invasion in head and neck squamous cell carcinoma (HNSCC) and breast cancer. To study the possible role of liprin-α1 in anticancer drug responses, we screened a library of oncology compounds in cell lines with high endogenous PPFIA1 expression. The compounds with the highest differential responses between high PPFIA1-expressing and silenced cells across cell lines were inhibitors targeting mitogen-activated protein kinase kinase (MEK)/extracellular signal-regulated kinases (ERK) signaling. KRAS proto-oncogene, GTPase (KRAS)-mutated MDA-MB-231 cells were more resistant to trametinib upon PPFIA1 knockdown compared with control cells. In contrast, liprin-α1-depleted HNSCC cells with low RAS activity showed a context-dependent response to MEK/ERK inhibitors. Importantly, we showed that liprin-α1 depletion leads to increased p-ERK1/2 levels in all our studied cell lines independent of KRAS mutational status, suggesting a role of liprin-α1 in the regulation of MAPK oncogenic signaling. Furthermore, liprin-α1 depletion led to more pronounced redistribution of RAS proteins to the cell membrane. Our data suggest that liprin-α1 is an important contributor to oncogenic RAS/MAPK signaling, and the status of liprin-α1 may assist in predicting drug responses in cancer cells in a context-dependent manner.

Keywords: MEK/ERK inhibitor; MEK/ERK signaling pathway; RAS; drug screen; head and neck squamous cell carcinoma; liprin-α1.


Conflict of interest statement

The authors declare no conflict of interest.

Figures

Fig. 1
Fig. 1
Comparison of drug responses between shPPFIA1 and shScramble cells. (A, B) Box plots visualizing the difference in drug responses between MDA‐MB‐231 shPPFIA1 (knockdown) and shScramble (control) cells. The drug screen consisted of a total of 527 compounds and the figure shows responses of the cells to selected functional drug classes, including inhibitors for EGFR (epidermal growth factor receptor; n = 4), mitotic inhibitors (n = 2), inhibitors for mTOR/PI3K (The mammalian target of rapamycin/Phosphatidylinositol‐3‐kinase signaling; n = 5), MEK/ERK [mitogen‐activated protein kinase kinase (MEK)/extracellular signal‐regulated kinases (ERK) signaling (n = 6)], and IAP (inhibitor of apoptosis proteins; n = 2). The drug sensitivity was measured by drug sensitivity score (DSS), which integrates the efficacy of drug concentration, the half maximal inhibitory concentration (IC50), the half maximal effective concentration (EC50) and the maximal inhibition [32]. The difference in drug response of specific drug classes between shPPFIA1 and shScramble cells was calculated as the differential drug sensitivity score (dDSS) by subtracting shScramble DSS from shPPFIA1 DSS, as measured by CellTiter‐Glo cell viability assay (A) and CellTox Green cell cytotoxicity assay (B). (C) DSS for MEK/ERK inhibitor treated MDA‐MB‐231 shScramble and shPPFIA1 cells showing clear difference in drug responses between shScramble and shPPFIA1 cells. Trametinib is shown in bold, because it was used to validate the drug screen results in MDA‐MB‐231 shScramble and shPPFIA1 cells. Each condition was screened once in a high throughput manner. (D) MDA‐MB‐231 shScramble cells with high PPFIA1 expression were more sensitive to 100 nm trametinib, as compared to PPFIA1 knockdown cells (shPPFIA1), when measured by trypan blue assay. Fold change (FC) of trypan blue positive cells in trametinib versus DMSO‐treated (negative control) conditions was calculated for both the shScramble and shPPFIA1 cells. Trametinib was significantly more effective for shScramble cells. Asterisk (*) indicates statistical significance (P < 0.05). Scale bar is 0.07 mm. Error bars indicate the standard deviation of the mean and each condition (shScramble and shPPFIA1) was measured in three replicates (n = 3). Student's t‐test was used to calculate the statistical significance. (E) Box plots showing differences in drug sensitivity scores (dDSS) between MEK/ERK inhibitor treated MDA‐MB‐231, UT‐SCC‐42A, UT‐SCC‐24A, and BT‐474 cell lines (shPPFIA1 – shScramble; n = 6 for each cell line). dDSS of UT‐SCC‐95 cell line ectopically expressing liprin‐α1 was compared to the empty vector (control‐overexpressing cells; n = 6). The drug responses presented in the box plots were measured by using a cell viability assay (CTG; CellTiter‐Glo). (F) Heatmap illustrating the differences in DSS between shScramble and shPPFIA1 in MDA‐MB‐231, UT‐SCC‐42A, UT‐SCC‐24A, and BT‐474 cells. For UT‐SCC‐95 cells, heatmap shows the dDSS between cells with ectopic PPFIA1 expression and control. Drug sensitivity scores are color‐coded, ranging from positive response (red) to negative response (blue) in shScramble and shPPFIA1 cells as well as in PPFIA1 overexpressing and control cells.
Fig. 2
Fig. 2
Effect of liprin‐α1 knockdown to ERK phosphorylation and to oncogenic signaling. (A) Localization and expression of p‐ERK1/2 (Thr202/Tyr204) in MDA‐MB‐231 shScramble and shPPFIA1_1 (construct #69) cells as visualized by immunofluorescence microscopy. Scale bar is 10 μm. (B) Localization and expression of p‐ERK1/2 (Thr202/Tyr204) in UT‐SCC‐42A shScramble and shPPFIA1_1 (construct #69) cells as visualized by immunofluorescence microscopy. Scale bar is 10 μm. (C) Quantification of p‐ERK1/2 staining in A and B is shown in bar chart as a fold change (FC) between shScramble and shPPFIA1 cells and asterisk (*) means statistical significance (P < 0.05). Student's two‐tailed t‐test was used to calculate the statistical significance. Error bar indicates the standard deviation of the mean. A minimum of 70 individual cells were quantitated three times from two (shScramble) or three (shPPFIA1) different experiments for both of the cell lines and representative images are shown for MDA‐MB‐231 cell line in 2A and for UT‐SCC‐42A in 2B. (D) Western blot showing protein levels of liprin‐α1, p‐ERK1/2 (Thr202/Tyr204), ERK1/2, MEK1/2 and p‐MEK1/2 (Ser217/221) in a panel of studied shScramble and shPPFIA1 cells. GAPDH, α‐tubulin and vinculin were used as the loading controls. The intensity of p‐ERK1/2 bands was quantified for individual cell lines and the values are described under the blot. In addition, western blot for UT‐SCC‐42A and UT‐SCC‐42B was performed with two different constructs for p‐ERK (Fig. S2D). (E) Heatmap showing MAPK pathway activity score in MDA‐MB‐231 and UT‐SCC‐42A shScr and shPPFIA1 cells, and in UT‐SCC‐95 control and PPFIA1 overexpressing cells. For MDA‐MB‐231 and UT‐SCC‐42A cells, z‐scores were computed from previously published RNAseq data [9]. For UT‐SCC‐95 cell line, z‐scores were computed from the RMA‐normalized expression values from microarrays [7]. The EPHA4 gene had two probe sets mapping to the same gene, so the mean expression value was used as a basis for the z‐score. Finally, the mean z‐scores from different constructs were calculated. For MDA‐MB‐231 cell line, three replicates of shScr and shPPFIA1 cells were included into the analysis whereas for UT‐SCC‐42A cell line, three replicates from shScr cells and two replicates from shPPFIA1 cells were analyzed. For UT‐SCC‐95, one control and two overexpressing samples were included into the analysis. (F, G) Western blot analysis from MDA‐MB‐231 (F) and UT‐SCC‐42A (G) cells treated 48 h with trametinib. Protein levels of liprin‐α1, ERK1/2, p‐ERK1/2 (T202/Y204), p‐AKT (Ser473) and p‐rS6 (Ser235/236) proteins are shown for shScramble and shPPFIA1 cells. DMSO‐treated cells were used as a negative control for trametinib treatment, whereas α‐tubulin and vinculin served as loading controls. Figure S3C,D shows quantification of p‐ERK1/2 immunoblot results calculated from four experiments for MDA‐MB‐231 and five experiments for UT‐SCC‐42A. Liprin‐α1, p‐AKT and p‐rS6 western blot experiments were performed twice for each cell line and each condition (Fig. 2F,G; Fig. S3A,B).
Fig. 3
Fig. 3
Effect of liprin‐α1 on pan‐RAS localization and RAS activity. (A) Localization of pan‐RAS in MDA‐MB‐231 shScramble and shPPFIA1 cells. Scale bar is 10 μm. Quantification of immunofluorescence staining is shown in C. (B) Localization of pan‐RAS in UT‐SCC‐42A shScramble and shPPFIA1 cells. Scale bar is 10 μm. Quantification of immunofluorescence staining is shown in C. (C) Bar plots show quantification of membrane localization of pan‐RAS in MDA‐MB‐231 (A) and UT‐SCC‐42A (B). A minimum of 70 individual cells were quantitated three times from three different experiments. Error bars have been calculated as a standard deviation of the mean. Student's two‐tailed t‐test was used to calculate the statistical significance. Asterisk (*) indicates statistical significance (P < 0.05). (D) Basal activation of Ras in cell lines with high liprin‐α1 expression (shScramble) and liprin‐α1 knockdown (shPPFIA1). Serum‐starved cells were lysed with high MgCl2 buffer, and the lysates were immunoprecipitated with Raf‐GST agarose beads. The precipitates were then immunoblotted with pan‐Ras antibody. Total pan‐Ras was detected from 10 μg of input lysates from each cell line and α‐tubulin was used as the loading control. Immunoblotting was carried out as a single experiment. (E) Western blot analysis of RAF in MDA‐MB‐231 and UT‐SCC‐42A cells transduced with two different knockdown constructs. Vinculin was used as the loading control. (F, G) Immunofluoresence staining of RAF‐1 in MDA‐MB‐231 (F) and in UT‐SCC‐42A shScramble and shPPFIA1 cells (G). The stainings for both of the cell lines were performed as single experiment. Scale bar is 10 μm.

Similar articles

References

    1. Serra‐Pages C, Kedersha NL, Fazikas L, Medley Q, Debant A, Streuli M. The LAR transmembrane protein tyrosine phosphatase and a coiled‐coil LAR‐interacting protein co‐localize at focal adhesions. EMBO J. 1995;14(12):2827–2838. - PMC - PubMed
    1. Serra‐Pages C, Medley QG, Tang M, Hart A, Streuli M. Liprins, a family of LAR transmembrane protein‐tyrosine phosphatase‐interacting proteins. J Biol Chem. 1998;273(25):15611–15620. - PubMed
    1. Jarvinen AK, Autio R, Haapa‐Paananen S, Wolf M, Saarela M, Grénman R, et al. Identification of target genes in laryngeal squamous cell carcinoma by high‐resolution copy number and gene expression microarray analyses. Oncogene. 2006;25(52):6997–7008. - PubMed
    1. Huang X, Gollin SM, Raja S, Godfrey TE. High‐resolution mapping of the 11q13 amplicon and identification of a gene, TAOS1, that is amplified and overexpressed in oral cancer cells. Proc Natl Acad Sci USA. 2002;99(17):11369–11374. - PMC - PubMed
    1. Huang C, Chen L, Savage SR, Eguez RV, Dou Y, Li Y, et al. Proteogenomic insights into the biology and treatment of HPV‐negative head and neck squamous cell carcinoma. Cancer Cell. 2021;39(3):361–379.e16. - PMC - PubMed

MeSH terms

Substances