. 2024 Jun;91(6):2229-2246.
doi: 10.1002/mrm.30001. Epub 2024 Jan 24.

Universal dynamic fitting of magnetic resonance spectroscopy

Affiliations

Universal dynamic fitting of magnetic resonance spectroscopy

William T Clarke et al. Magn Reson Med. 2024 Jun.

Abstract

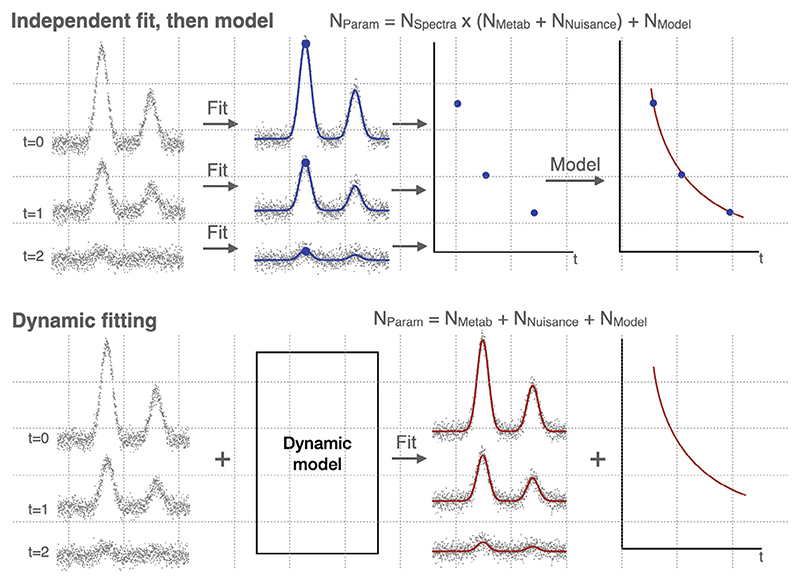
Purpose: Dynamic (2D) MRS is a collection of techniques where acquisitions of spectra are repeated under varying experimental or physiological conditions. Dynamic MRS comprises a rich set of contrasts, including diffusion-weighted, relaxation-weighted, functional, edited, or hyperpolarized spectroscopy, leading to quantitative insights into multiple physiological or microstructural processes. Conventional approaches to dynamic MRS analysis ignore the shared information between spectra, and instead proceed by independently fitting noisy individual spectra before modeling temporal changes in the parameters. Here, we propose a universal dynamic MRS toolbox which allows simultaneous fitting of dynamic spectra of arbitrary type.

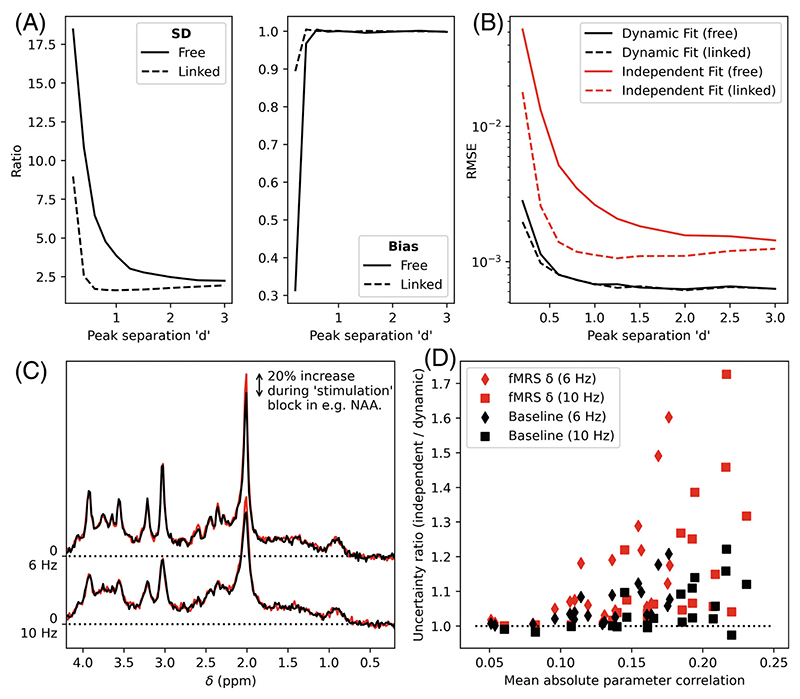
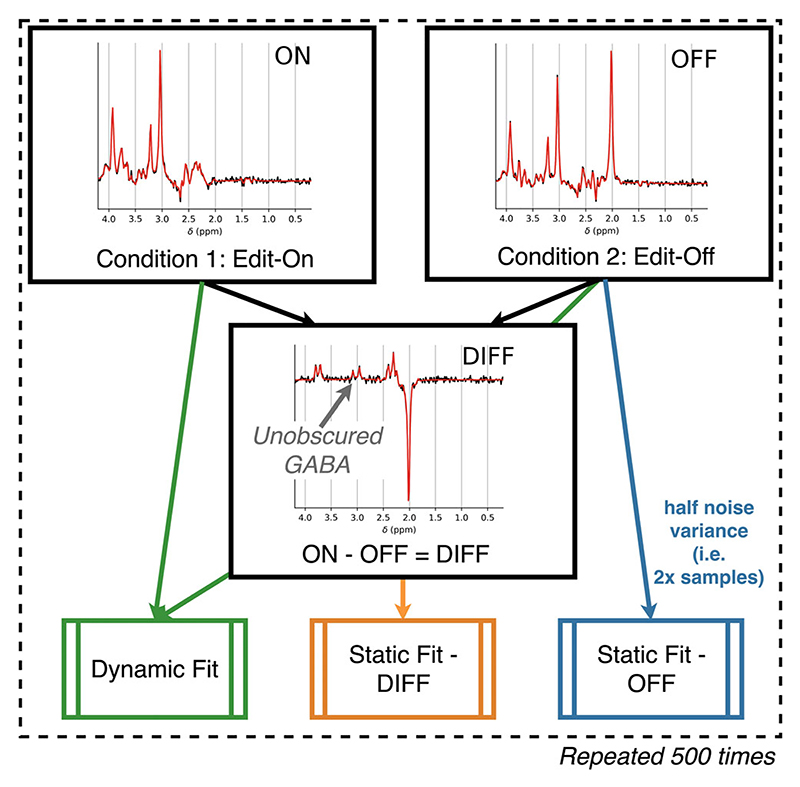
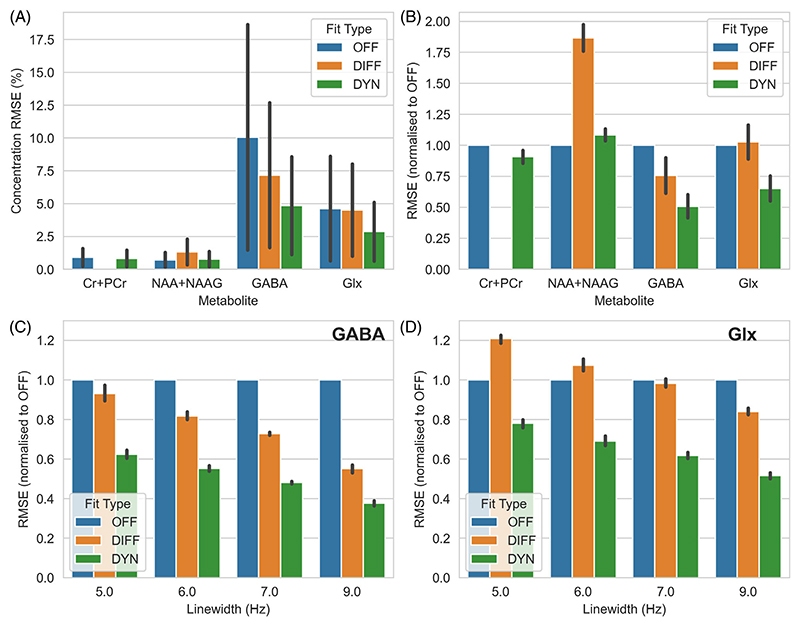
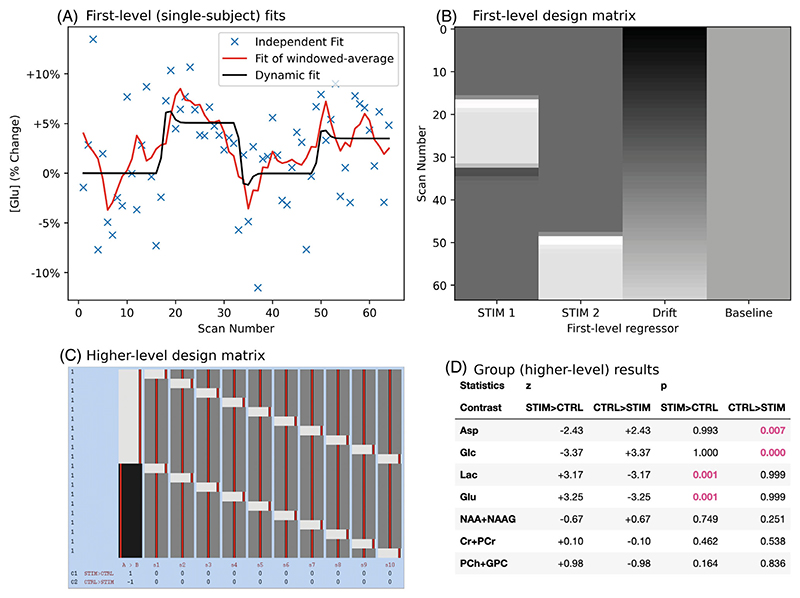
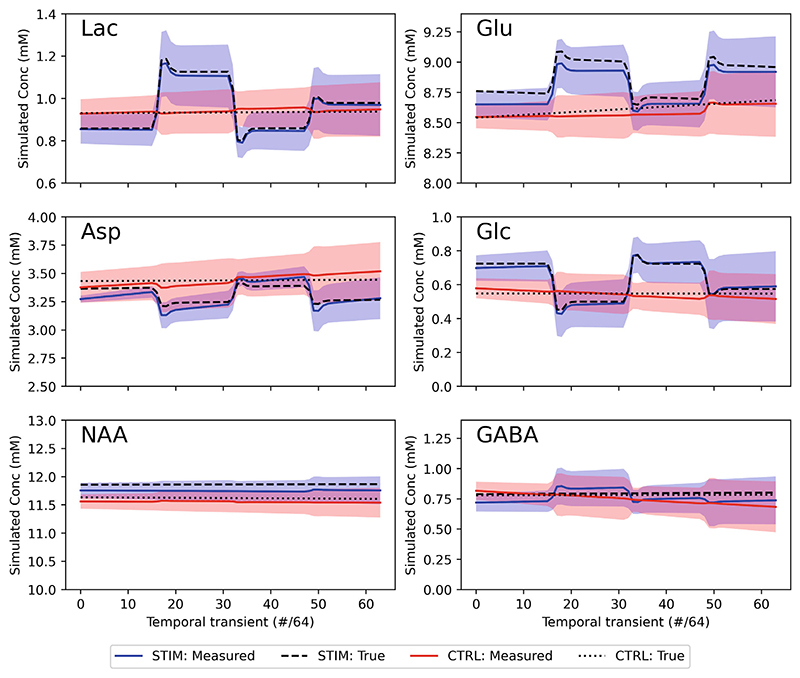
Methods: A simple user-interface allows information to be shared and precisely modeled across spectra to make inferences on both spectral and dynamic processes. We demonstrate and thoroughly evaluate our approach in three types of dynamic MRS techniques. Simulations of functional and edited MRS are used to demonstrate the advantages of dynamic fitting.

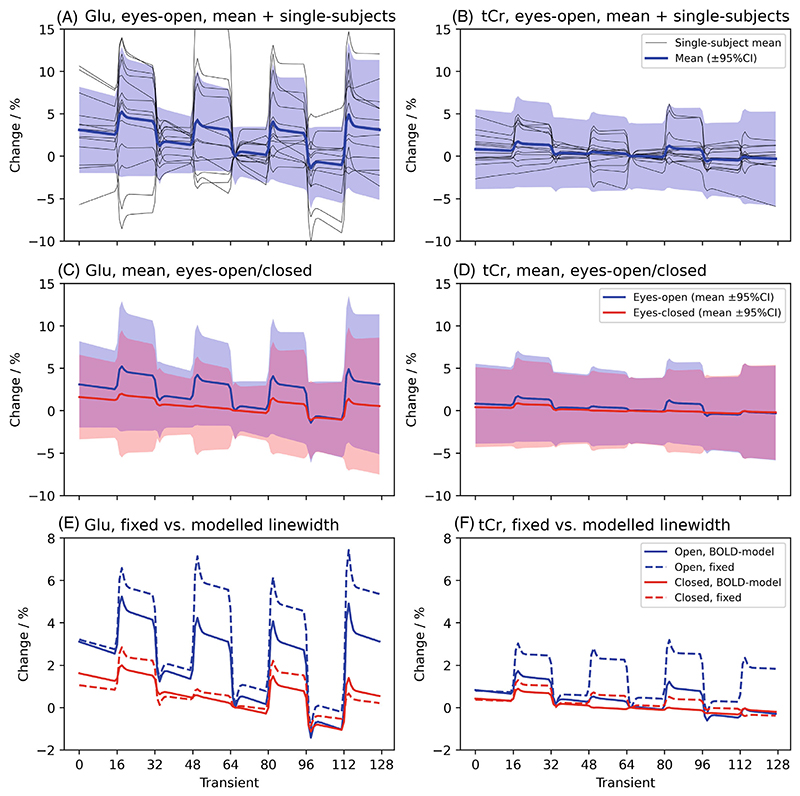
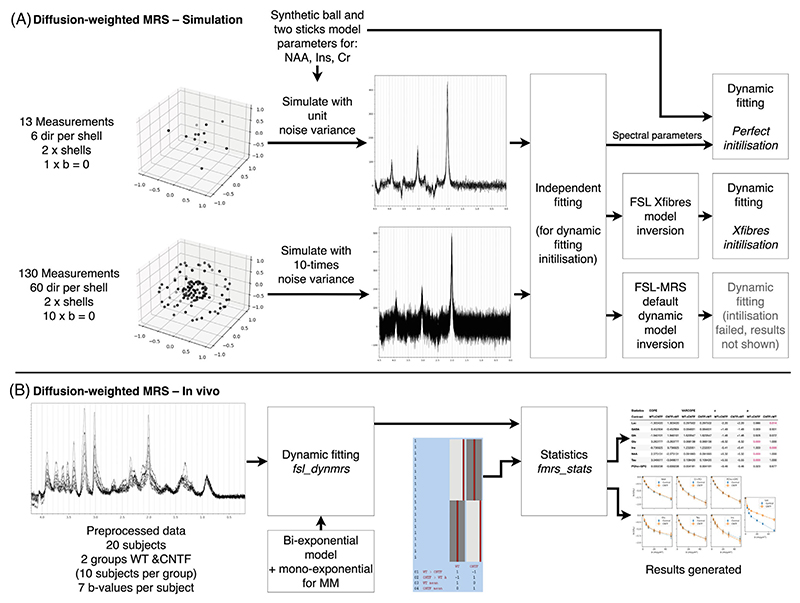
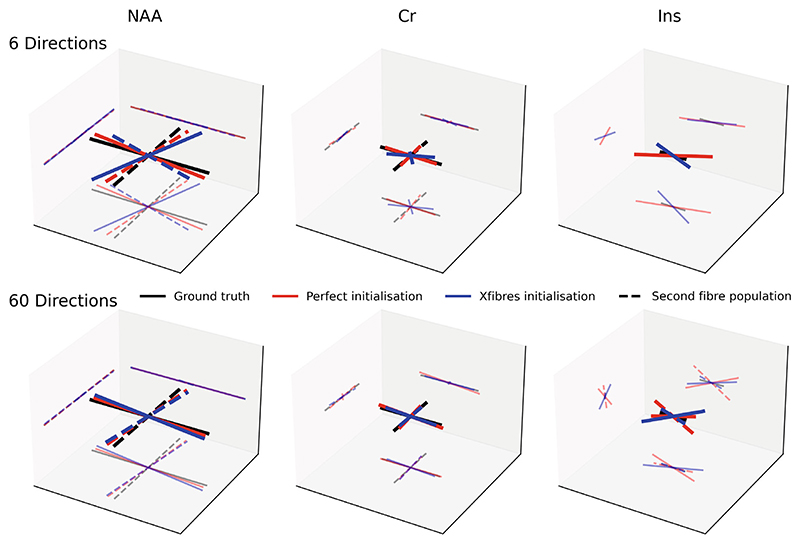
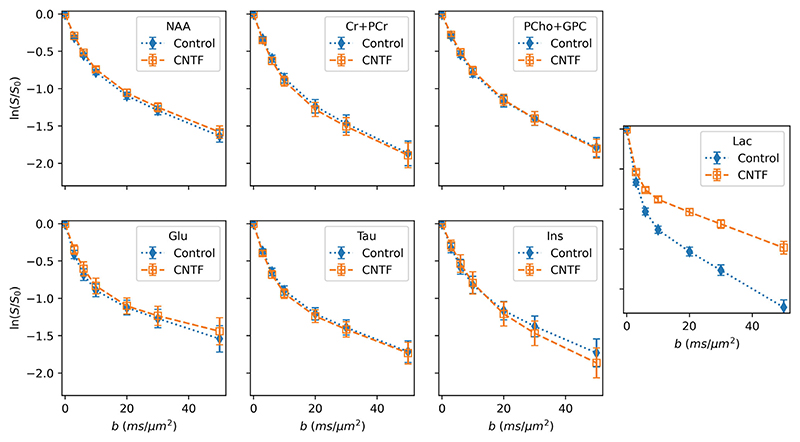
Results: Analysis of synthetic functional 1H-MRS data shows a marked decrease in parameter uncertainty as predicted by prior work. Analysis with our tool replicates the results of two previously published studies using the original in vivo functional and diffusion-weighted data. Finally, joint spectral fitting with diffusion orientation models is demonstrated in synthetic data.

Conclusion: A toolbox for generalized and universal fitting of dynamic, interrelated MR spectra has been released and validated. The toolbox is shared as a fully open-source software with comprehensive documentation, example data, and tutorials.

Keywords: MRS; dMRS; edited‐MRS; fMRS; spectroscopy.


Figures

Figure 1
Figure 1. Typical current independent fitting of dynamic data vs. proposed dynamic fitting.
The typically used approach in fitting a model to dynamic MRS data (top) is to model the changing parameters after an independent spectral fitting stage (where each spectrum is treated independently). The proposed approach (and as examined by Tal) is to simultaneously fit a spectral and dynamic model. This is known as dynamic, “2D,” or spectral-temporal fitting. This approach reduces the number of parameters to fit by allowing estimation of shared model parameters at once. This shared estimation increases the amount of data used to estimate parameters that are expected to be static (or functionally linked) across transients, mitigating the effect of noise which would otherwise result in multiple, low precision estimates of the parameter. This results in a decrease in parameter uncertainty. NParam: Total number of fitted parameters, NMetab: number of metabolite concentration parameters, NNuisance: number of spectral fitting parameters not of direct interest (e.g., line broadening), NModel: number of dynamic model parameters.
Figure 2
Figure 2. Results of the functional MRS validation.
(A) Ratio of Monte Carlo measured SDs and bias (independent fitting/dynamic fitting) for the concentration increase as a function of peak separation in the toy two-peak simulation (see Figure S3). Results for a model with all parameters unlinked “Free” and the standard FSL-MRS fitting model “Linked” are given (see §Functional MRS–Simulation). (B) RMSEs for the same simulation. As shown in A&B Dynamic fitting reduces uncertainty and overall error. (C) Extension of fMRS validation to realistic 1H-MRS data. Paired data with 20% increases in concentration were simulated for each metabolite (NAA shown) at two linewidths. (D) The uncertainty ratio (ratio of SDs, independent fitting/dynamic fitting) for each metabolite’s baseline concentration and increase (delta) is shown as a function of the parameter’s mean correlation with other parameters (see Figure S4). A value >1 indicates that dynamic fitting is decreasing the uncertainty compared to independent fitting.
Figure 3
Figure 3. Approach to edited MRS analysis simulation.
Simulation is carried out by generating pairs of synthetic MEGA-edited spectra (both the edit-off [OFF] and edit-on [ON] saturation case), and the corresponding difference spectrum (by subtraction, [DIFF]). The DIFF and OFF spectra are fit using single spectrum fitting, and the ON + OFF spectra are fit using the dynamic approach. The statically fitted OFF spectrum is constructed with half the noise variance to simulate matched time acquisitions. This is repeated 500 times in a Monte Carlo approach for each noise level and line broadening. Spectra are shown with static fitting and have the lowest linewidth (5 Hz) and intermediate noise (noise SD = 144).
Figure 4
Figure 4. Results of the editing simulation.
(A) RMSE (±SD) across all noise levels and linewidths for each examined metabolite, expressed as percentage of the true metabolite concentration. (B) As (A), but with the results normalized to OFF for each metabolite. (C, D) The effect of linewidth on the relative performance for GABA and Glx (glutamate + glutamine). In all cases, except the measurement of NAA + NAAG, the RMSE is lowest for the dynamic approach.
Figure 5
Figure 5. Subject and group analysis of functional MRS using a GLM.
(A) Single subject fit of glutamate. A single subject’s stimulation data are shown for relative glutamate changes. Independent, moving-window temporally smoothed, and dynamically modeled results are shown. Note that no formal comparison is made to the moving-window method, comparison of dynamic fitting to independent fitting is made in CS1. (B) Design matrix used to both generate and fit the fMRS data at the first level. There are two stimulation regressors, a linear drift regressor and a constant regressor. (C) The group level analysis used this design matrix to run a paired t-test for stimulation and control (no effect) datasets. Each row indicates one scan (control or stimulation) with all stimulation listed first, columns show each explanatory variable with a value of −1 (black), 0 (dark gray), or 1 (gray). The matrix was created and displayed using FSL tools as explained at Reference 42. (D) Output of FSL-MRS’s fmrs_stats tool showing group z and p statistics for each first-level contrast. The tool accurately identifies the metabolites changing in the simulation as significant.
Figure 6
Figure 6. Visual representation of functional mrs (fMRS) demonstration group-level results.
Stimulation and control (no stimulation) cases are plotted as a function of temporal transient showing group mean and SD. The true values are shown as dashed/dotted lines. All metabolites that had simulated changes (Lac & Glu—positive, Asp & Glc—negative) are shown alongside two with non-changing metabolites (NAA—high SNR, GABA—low SNR).
Figure 7
Figure 7. Results of the functional MRS (fMRS) in vivo validation for two metabolites
glutamate, which is expected to increase with stimulation (Glu, left) and total creatine which is not expected to change (tCr, right). (A, B) Group-level mean and 95% CI (colored), and single-subject concentrations expressed as a percentage change relative to the middle time point. (C, D) Comparison of the group level means and 95% CIs for the stimulation (eyes-open) and control (eyes-closed) case. (E, F) Comparison of the results when using a model that incorporates the effect of BOLD on metabolite linewidths, to one with linewidths that are fixed across all timepoints (see Supporting Information S1). When fixed, spuriously large changes are observed during stimulation, including for non-modulating metabolites.
Figure 8
Figure 8. dMRS.
(A) Schematic of the simulated analysis of multi-direction data using FSL-MRS’s dynamic approach. Time-matched data with different numbers of diffusion directions were analyzed, implementing a ball-and-two-sticks model into the spectral-dynamic fitting. Different fitting initialization approaches were trialed for each case. (B) Previously published multi-b-value dMRS data were reanalyzed using spectral-dynamic fitting, implementing a biexponential model (exponential for macromolecules). The group-level analysis using fmrs_stats was qualitatively compared to the published results. CNTF, cytokine ciliary neurotrophic factor.
Figure 9
Figure 9. Fitting the ball and two-sticks model to simulated multi-direction diffusion data.
This is a demonstration of the ability of the tool to simultaneously fit more complex diffusion models and spectral information. However, a good initialization point (provided by FSL’s xfibers tool) is required. Simulated data with more diffusion directions (but correspondingly lower spectral SNR) provide a better estimate of fiber directions than lower numbers of directions, which is required for stable spectral fits when no information is shared. The xfibres initialized fit, achievable on real data, is compared with an artificial perfect initialization approach (which requires the ground truth) and the ground truth. Each metabolite simulates a different cellular compartmentalization and therefore has a different ground truth.
Figure 10
Figure 10. Dynamically-fitted concentrations of key metabolites in the in vivo dMRS validation.
The results closely match the magnitude and direction of the original publication’s results, which found significant differences in myo-inositol (Ins) and lactate (Lac) diffusion properties between the control and CNTF cohorts. Changes in overall metabolite concentrations were also found (see Table S3), again matching the original publication.

References

    1. Craven AR, Dwyer G, Ersland L, et al. GABA, glutamatergic dynamics and BOLD contrast concurrently assessed using functional MR spectroscopy during a cognitive task. bioRxiv. 2023;2023:539017. - PubMed
    1. Hui SCN, Mikkelsen M, Zöllner HJ, et al. Frequency drift in MR spectroscopy at 3T. Neuroimage. 2021;241:118430. doi: 10.1016/j.neuroimage.2021.118430. - DOI - PMC - PubMed
    1. Edden RAE, Puts NAJ, Harris AD, Barker PB, Evans CJ. Gannet: A Batch-Processing Tool for the Quantitative Analysis of Gamma-Aminobutyric Acid–Edited MR Spectroscopy Spectra. J Magn Reson Imaging JMRI. 2014;40:1445. doi: 10.1002/jmri.24478. - DOI - PMC - PubMed
    1. Near J, Edden R, Evans CJ, Paquin R, Harris A, Jezzard P. Frequency and phase drift correction of magnetic resonance spectroscopy data by spectral registration in the time domain. Magn Reson Med. 2015;73:44–50. doi: 10.1002/mrm.25094. - DOI - PMC - PubMed
    1. Stanley JA, Raz N. Functional magnetic resonance spectroscopy: the “new” MRS for cognitive neuroscience and psychiatry research. Front Psych. 2018;9:76. doi: 10.3389/fpsyt.2018.00076. - DOI - PMC - PubMed

LinkOut - more resources