. 2024 Mar;20(3):2143-2154.
doi: 10.1002/alz.13651. Epub 2024 Jan 24.

Comparison of plasma biomarkers and amyloid PET for predicting memory decline in cognitively unimpaired individuals

Affiliations

Comparison of plasma biomarkers and amyloid PET for predicting memory decline in cognitively unimpaired individuals

Clifford R Jack Jr et al. Alzheimers Dement. 2024 Mar.

Abstract

Background: We compared the ability of several plasma biomarkers versus amyloid positron emission tomography (PET) to predict rates of memory decline among cognitively unimpaired individuals.

Methods: We studied 645 Mayo Clinic Study of Aging participants. Predictor variables were age, sex, education, apolipoprotein E (APOE) ε4 genotype, amyloid PET, and plasma amyloid beta (Aβ)42/40, phosphorylated tau (p-tau)181, neurofilament light (NfL), glial fibrillary acidic protein (GFAP), and p-tau217. The outcome was a change in a memory composite measure.

Results: All plasma biomarkers, except NfL, were associated with mean memory decline in models with individual biomarkers. However, amyloid PET and plasma p-tau217, along with age, were key variables independently associated with mean memory decline in models combining all predictors. Confidence intervals were narrow for estimates of population mean prediction, but person-level prediction intervals were wide.

Discussion: Plasma p-tau217 and amyloid PET provide useful information about predicting rates of future cognitive decline in cognitively unimpaired individuals at the population mean level, but not at the individual person level.

Keywords: amyloid PET; cognitive decline; cognitive decline and Alzheimer's disease; plasma biomarkers and Alzheimer's disease.


Conflict of interest statement

CR Jack receives funding from the NIH and the Alexander Family Alzheimer's Disease Research Professorship of the Mayo Clinic. A Algeciras‐Schimnich has participated in advisory boards for Roche Diagnostics, Fujirebio Diagnostics, and Siemens Healthineers. DJ Figdore, VK Ramanan, PM Cogswell, SD Weigand, HJ Wiste, and J Fields report no disclosures. TM Therneau receives NIH support. MM Mielke receives research support from the NIH and DOD and has consulted for Biogen, Brain Protection Company, LabCorp, Lilly, Merck, Roche, Siemens Healthineers, and Sunbird Bio. MM Machulda and ML Senjem report no disclosures. DS Knopman serves on a Data Safety Monitoring Board for the Dominantly Inherited Alzheimer Network Treatment Unit study. He served on a Data Safety monitoring Board for a tau therapeutic for Biogen (until 2021) but received no personal compensation. He is an investigator in clinical trials sponsored by Biogen, Lilly Pharmaceuticals, and the University of Southern California. He has served as a consultant for Roche, Samus Therapeutics, Magellan Health, BioVie, and Alzeca Biosciences but receives no personal compensation. He attended an Eisai advisory board meeting for lecanemab on December 2, 2022, but received no compensation. He receives funding from the NIH. J Graff‐Radford receives funding from the NIH. He is an investigator in clinical trials sponsored by Biogen, Eisai, and the University of Southern California. VJ Lowe consults for Bayer Schering Pharma, Piramal Life Sciences, Eisai, Inc., AVID Radiopharmaceuticals, and Merck Research, and receives research support from GE Healthcare, Siemens Molecular Imaging, AVID Radiopharmaceuticals, and the NIH (NIA, NCI). P Vemuri receives funding from the NIH. CG Schwarz receives funding from the NIH. RC Petersen has consulted for Roche, Inc., Genentech, Inc., Eli Lilly, Inc., Nestle, Inc., and Eisai, Inc.; has served on a DSMB for Genentech, Inc., and receives royalties from Oxford University Press for Mild Cognitive Impairment and from UpToDate. His research funding is from NIH/NIA. Author disclosures are available in the supporting information.

Figures

FIGURE 1
FIGURE 1
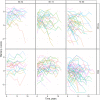
Memory z‐score trajectories over time in a random subset of 200 participants with three or more visits. Trajectories are shown within age and sex groups to aid in seeing individual lines.
FIGURE 2
FIGURE 2
Difference in estimated mean (95% confidence interval) annual memory change for contrasts of interest. Estimates are from linear mixed effects models with memory z‐score as the outcome and time, age, sex, education, APOE genotype, plasma biomarkers, and amyloid PET as predictors. MCSA visit number was included to adjust for potential practice effects. All biomarkers were fit with a log‐transformation except for Aβ42/40. Estimates are shown from three sets of models: estimates shown in grey are from models that included one biomarker at a time, estimates in blue are from models that included all plasma biomarkers, and estimates shown in black include all plasma biomarkers and amyloid PET. Models with all plasma biomarkers only included one of the two plasma p‐tau measures at a time; estimates in the left panel are from models that included Lilly MSD p‐tau217 and estimates in the right panel included Quanterix Simoa p‐tau181. The individual models that did not include p‐tau (Aβ42/40, GFAP, NfL, and amyloid PET) are shown in both panels but are exactly the same. All models include person‐specific random intercepts and slopes. While age, sex, education, and APOE are included in all models, these effects are only shown for the models with all plasma biomarkers and amyloid PET. The contrasts shown for the biomarkers are the 75th versus 25th percentile (or 25th vs 75th for Aβ42/40). Amyloid PET Centiloid values of 10 and 29 correspond to SUVR values of 1.34 and 1.57. Aβ, amyloid beta; APOE, apolipoprotein E; GFAP, glial fibrillary acidic protein; MCSA, Mayo Clinic Study of Aging; NfL, neurofilament light; PET, positron emission tomography; p‐tau, phosphorylated tau; SUVR, standardized uptake value ratio.
FIGURE 3
FIGURE 3
Scatter plots with Spearman correlations (ρ) showing the associations between Quanterix Simoa p‐tau181 (pg/mL) and Lilly MSD p‐tau217 (pg/mL) and their correlations with amyloid PET (Centiloid and SUVR). P‐tau181 and p‐tau217 are both shown on the log scale. PET, positron emission tomography; p‐tau, phosphorylated tau; SUVR, standardized uptake value ratio.
FIGURE 4
FIGURE 4
Estimated mean annual change in memory z‐score among cognitively unimpaired participants for two levels (75th and 25th percentiles) of amyloid PET Centiloid and two levels (75th and 25th percentiles) of p‐tau217 (top) or p‐tau181 pg/mL (bottom) at age 70 and age 80. The left panels show 95% confidence intervals for the mean memory change while the right panels show 95% (thinner line) and 80% (thicker line) prediction intervals for estimated annual memory change at the person level. Estimates and predictions are from the plasma plus PET biomarker models described above and assume all other covariates in the model are averaged over the study cohort. The amyloid PET and p‐tau values shown correspond to the 25th and 75th percentiles in the study. Amyloid PET Centiloid values of 10 and 29 correspond to SUVR values of 1.34 and 1.57. PET, positron emission tomography; p‐tau, phosphorylated tau; SUVR, standardized uptake value ratio.
FIGURE 5
FIGURE 5
Estimated mean annual change in memory z‐score among cognitively unimpaired participants for amyloid PET and plasma p‐tau both at the 5th percentile or both at the 95th percentile (p‐tau217, top and p‐tau181, bottom) at age 70 and age 80. The left panels show 95% confidence intervals for the mean memory change while the right panels show 95% (thinner line) and 80% (thicker line) prediction intervals for estimated annual memory change at the person level. Estimates and predictions are from the plasma plus PET biomarker models and assume all other covariates in the model are averaged over the study cohort. Amyloid PET Centiloid values of 2 and 95 correspond to SUVR values of 1.26 and 2.31. PET, positron emission tomography; p‐tau, phosphorylated tau; SUVR, standardized uptake value ratio.

References

    1. Karikari TK, Benedet AL, Ashton NJ, et al. Diagnostic performance and prediction of clinical progression of plasma phospho‐tau181 in the Alzheimer's Disease Neuroimaging Initiative. Mol Psychiatry. 2020. Online ahead of print. - PubMed
    1. Shen XN, Li JQ, Wang HF, et al. Plasma amyloid, tau, and neurodegeneration biomarker profiles predict Alzheimer's disease pathology and clinical progression in older adults without dementia. Alzheimers Dement (Amst). 2020;12(1):e12104. - PMC - PubMed
    1. Palmqvist S, Tideman P, Cullen N, et al. Prediction of future Alzheimer's disease dementia using plasma phospho‐tau combined with other accessible measures. Nat Med. 2021;27(6):1034‐1042. - PubMed
    1. Brickman AM, Manly JJ, Honig LS, et al. Plasma p‐tau181, p‐tau217, and other blood‐based Alzheimer's disease biomarkers in a multi‐ethnic, community study. Alzheimers Dement. 2021;17(8):1353‐1364. - PMC - PubMed
    1. Therriault J, Benedet AL, Pascoal TA, et al. Association of plasma P‐tau181 with memory decline in non‐demented adults. Brain Commun. 2021;3(3):fcab136. - PMC - PubMed

Publication types

MeSH terms