Meta-Analysis
. 2024 Jan-Dec;16(1):2304900.
doi: 10.1080/19490976.2024.2304900. Epub 2024 Jan 24.

Meta-analysis reveals obesity associated gut microbial alteration patterns and reproducible contributors of functional shift

Affiliations
Meta-Analysis

Meta-analysis reveals obesity associated gut microbial alteration patterns and reproducible contributors of functional shift

Deep Chanda et al. Gut Microbes. 2024 Jan-Dec.

Abstract

The majority of cohort-specific studies associating gut microbiota with obesity are often contradictory; thus, the replicability of the signature remains questionable. Moreover, the species that drive obesity-associated functional shifts and their replicability remain unexplored. Thus, we aimed to address these questions by analyzing gut microbial metagenome sequencing data to develop an in-depth understanding of obese host-gut microbiota interactions using 3329 samples (Obese, n = 1494; Control, n = 1835) from 17 different countries, including both 16S rRNA gene and metagenomic sequence data. Fecal metagenomic data from diverse geographical locations were curated, profiled, and pooled using a machine learning-based approach to identify robust global signatures of obesity. Furthermore, gut microbial species and pathways were systematically integrated through the genomic content of the species to identify contributors to obesity-associated functional shifts. The community structure of the obese gut microbiome was evaluated, and a reproducible depletion of diversity was observed in the obese compared to the lean gut. From this, we infer that the loss of diversity in the obese gut is responsible for perturbations in the healthy microbial functional repertoire. We identified 25 highly predictive species and 37 pathway associations as signatures of obesity, which were validated with remarkably high accuracy (AUC, Species: 0.85, and pathway: 0.80) with an independent validation dataset. We observed a reduction in short-chain fatty acid (SCFA) producers (several Alistipes species, Odoribacter splanchnicus, etc.) and depletion of promoters of gut barrier integrity (Akkermansia muciniphila and Bifidobacterium longum) in obese guts. Our analysis underlines SCFAs and purine/pyrimidine biosynthesis, carbohydrate metabolism pathways in control individuals, and amino acid, enzyme cofactor, and peptidoglycan biosynthesis pathway enrichment in obese individuals. We also mapped the contributors to important obesity-associated functional shifts and observed that these are both dataset-specific and shared across the datasets. In summary, a comprehensive analysis of diverse datasets unveils species specifically contributing to functional shifts and consistent gut microbial patterns associated to obesity.

Keywords: functional contributors; gut microbial association; machine learning; meta-analysis; obesity.


Conflict of interest statement

No potential conflict of interest was reported by the author(s).

Figures

Figure 1.
Figure 1.
PRISMA flow diagram of the study selection process. Study selection was performed according to the most recent preferred reporting items for systematic reviews and meta-analyses (PRISMA) guidelines.
Figure 2.
Figure 2.
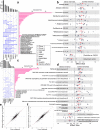
Reproducible taxonomic and functional microbial features across datasets identified by comparing obese and lean controls. (A) The UpSet plot showing the number of reproducible taxonomic features identified using LEfSe on MetaPhlAn3 generated species profiles shared among the datasets. Species highlighted in bold are differentially abundant in at least four datasets and were identified from species-level meta-analysis. GBR, Great Britain; UK, United Kingdom.(B) Pooled effect sizes for the 16 significant species with FDR less than 0.05 and effect size cut off ± 0.25. Red lines represent the 95% confidence interval for the random effects model estimate. Species marked in bold refer to the signatures identified from the machine learning analyses (figure 4). Species marked in ‘*’ denote reproducible contributors of obesity-associated gut microbial signature pathways, as identified from FishTaco analyses (figure 6). (C) UpSet plot showing the number of gut microbial pathway signatures identified using LEfSe on HUMAnN3 generated pathway profiles shared among datasets. Pathways highlighted in bold are differentially abundant in at least four datasets and were identified from the pathway-level meta-analysis. (D) pooled effect sizes for the 17 significant pathways with FDR less than 0.05 and effect size cut off ± 0.25. Red lines represent the 95% confidence interval for the random effects model estimate. Pathways marked in bold refer to the pathway signatures identified from the machine learning analyses. (E-F) Scatter plot of crude and age, sex, and comorbidity adjusted coefficients obtained from linear models using MetaPhlAn3 species abundances (E) and HUMAnN3 pathway abundances (F).
Figure 3.
Figure 3.
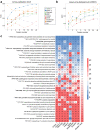
Identification of obesity-associated signature species required for class prediction, their dataset-specific and overall ranking across datasets. (A-B) predictive accuracy with increasing number of species features in cross-validation (CV) (A) and leave-one-dataset-out (LODO) (B) experiment obtained by using backend feature ranking algorithm of random forest classifier. (C) Representation of the rank matrix along with final median rank of top 16 species in each LODO validation making a panel of 25 unique species. Species marked in bold denote signatures also identified from species-level meta-analysis. ‘*’ marked species are the control-enriched signatures as identified from species-level meta-analysis without employing any FDR and effect size cutoffs. Rest is obese enriched. ‘†’ indicates species which were obtained as reproducible contributors of obesity-associated signature pathway shifts from FishTaco (Figure 2 and Figure 6).
Figure 4.
Figure 4.
Identification of obesity associated signature pathways required for class prediction, their dataset-specific and overall ranking across datasets. (A-B) predictive accuracy with increasing number of pathway features in cross-validation (CV) (A) and leave-one-dataset-out (LODO) (B) experiment obtained by using backend feature ranking algorithm of random forest classifier. (C) Representation of the rank matrix along with final median rank of top 16 pathways in each LODO validation making a panel of 37 unique pathways. Pathways marked in bold denote signatures also identified from pathway-level meta-analysis. ‘*’ marked pathways are the control-enriched signatures as identified from species-level meta-analysis without employing any FDR and effect size cutoffs.
Figure 5.
Figure 5.
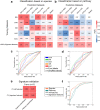
Prediction performance assessment of gut microbiome within and across general diet clusters and validation of signature features. (A-B) Matrix reporting prediction performances in terms of AUC values obtained from MetAML using (A) species and (B) pathway relative abundances. Diagonal values refer to average AUC obtained from 10-fold cross-validations (CV) iterated 20 times. Off-diagonal values report AUC values generated by training classifier on a dataset present in a row and validated on a dataset in the corresponding column representing cross study validation (CSV). Last rows refer to the accuracy achieved by performing LODO with the model generated exclusively using signature features associated to obesity. (C-D) Average ROC curves (over fold) obtained from LODO using (E) species and (F) pathway signature abundance data contrasting sensitivity and specificity of the learning model trained with true and shuffled class labels. (E-F) Prediction accuracy matrix for the models generated from cross-validation (CV) (using all features and signature features) in an independent French validation dataset (E) and the associated ROC curves (over fold) (F) demonstrate utilizing only signature features can yield comparable levels of accuracy to using all features. Diet clusters: BIN (British cluster comprising Great Britain, Ireland, Netherlands, and UK datasets), CHN (Chinese cluster comprising China:1, China:2 datasets); SCN (Scandinavian cluster comprising Sweden and Denmark datasets); ISR (Israeli cluster comprising Israel dataset), and KAZ (Kazakhstan comprising the Kazakhstan dataset).
Figure 6.
Figure 6.
Reproducible contributors of the control-enriched signature pathway shifts and predictive modulation of those pathways by the minimal replicable contributor set. (A) Sankey diagram representing reproducible contributors (5 out of 9 datasets) and their contributed pathways. Values mentioned in second column denotes the number of datasets where a particular contributor drives specific functions it is connected to. Species marked in bold are the ones identified as obesity-associated signatures from MetAML and species bounded with rectangle was identified from meta-analysis. ‘*’ marked are the potential species which were predicted as the minimal set contributing to the maximum number of reproducible pathways. (B) Sankey diagram shows probable control-enriched signature pathways that can be predictively perturbed by minimal reproducible contributor set in different datasets. Values mentioned in each ‘dataset’ column represents the number of control-enriched pathways the minimal set of species directly drives.

References

    1. WHO . 2021. Obesity and overweight. http://www.who.int/news-room/fact-sheets/detail/obesity-and-overweight.
    1. Locke AE, Kahali B, Berndt SI, Justice AE, Pers TH, Day FR, Powell C, Vedantam S, Buchkovich ML, Yang J. et al. Genetic studies of body mass index yield new insights for obesity biology. Nature. 2015;518(7538):197–24. doi:10.1038/nature14177. - DOI - PMC - PubMed
    1. Wheeler E, Huang N, Bochukova EG, Keogh JM, Lindsay S, Garg S, Henning E, Blackburn H, Loos RJ, Wareham NJ. et al. Genome-wide SNP and CNV analysis identifies common and low-frequency variants associated with severe early-onset obesity. Nat Genet. 2013;45(5):513–517. doi:10.1038/NG.2607. - DOI - PMC - PubMed
    1. Ogden CL, Carroll MD, Kit BK, Flegal KM. Prevalence of childhood and adult obesity in the United States, 2011-2012. JAMA. 2014;311(8):806–814. doi:10.1001/jama.2014.732. - DOI - PMC - PubMed
    1. Spiegelman BM, Flier JS. Obesity and the regulation of energy balance. Cell. 2001;104(4):531–543. doi:10.1016/s0092-8674(01)00240-9. - DOI - PubMed

Publication types

LinkOut - more resources