. 2024 Jan 24;147(1):24.
doi: 10.1007/s00401-023-02674-x.

Molecular characteristics and improved survival prediction in a cohort of 2023 ependymomas

Affiliations

Molecular characteristics and improved survival prediction in a cohort of 2023 ependymomas

Lara C Pohl et al. Acta Neuropathol. .

Abstract

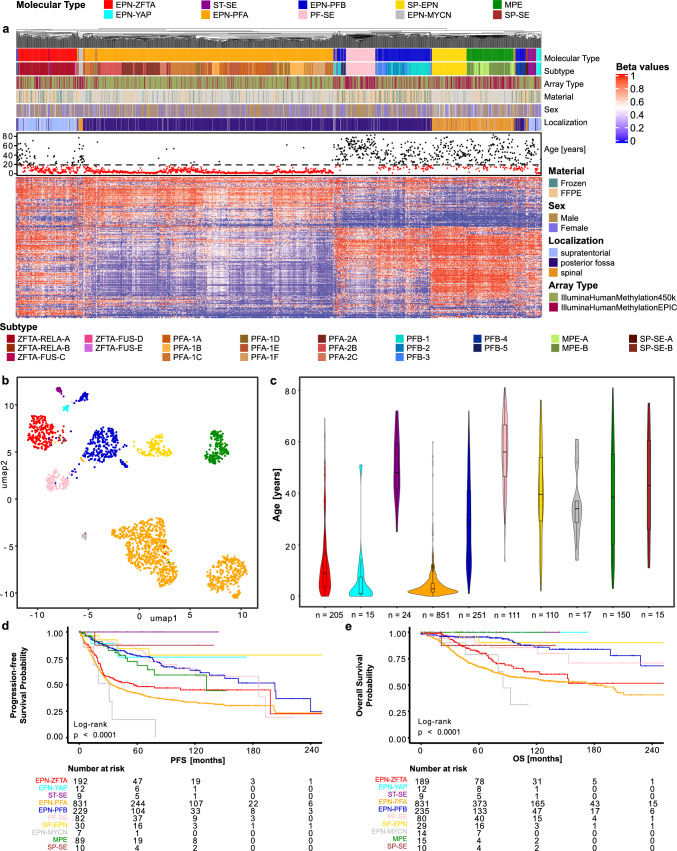
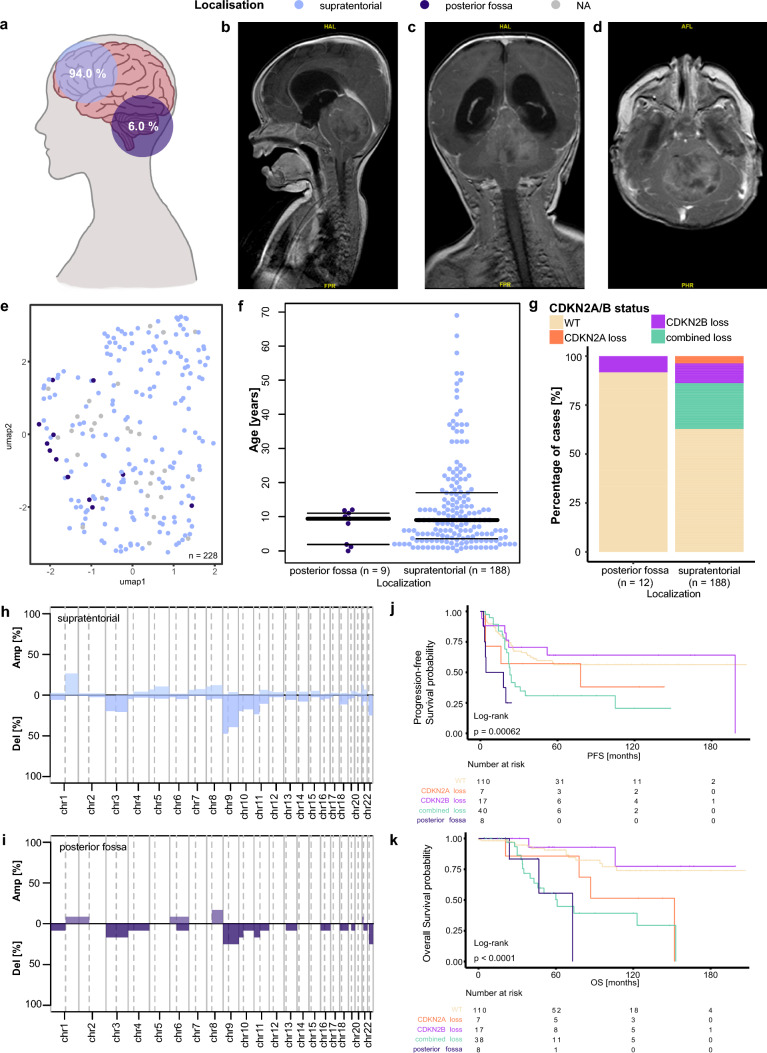
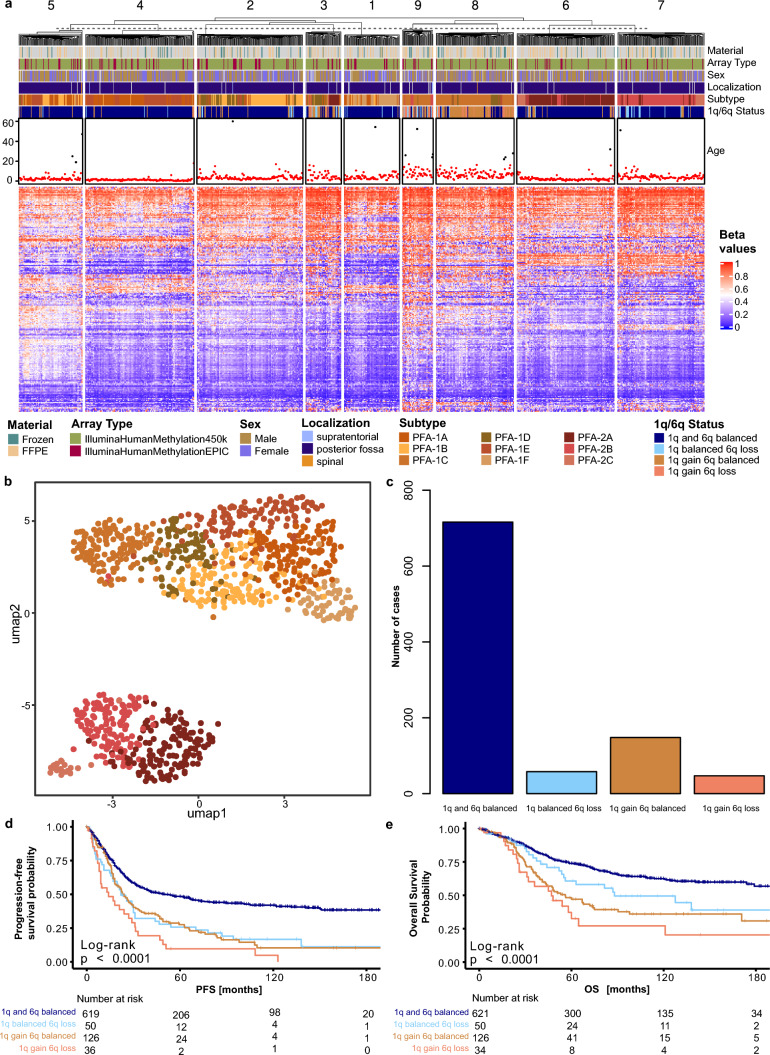
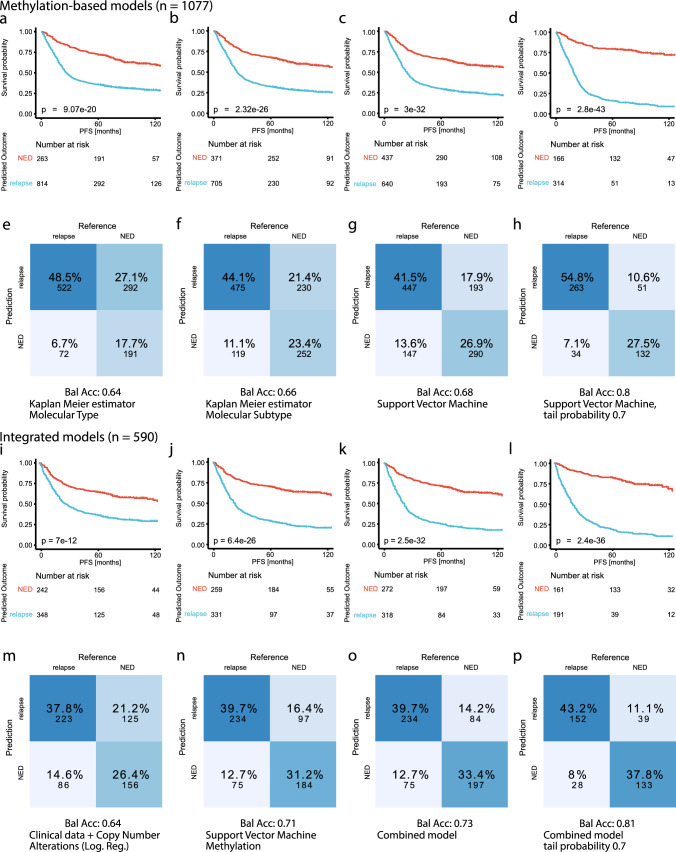
The diagnosis of ependymoma has moved from a purely histopathological review with limited prognostic value to an integrated diagnosis, relying heavily on molecular information. However, as the integrated approach is still novel and some molecular ependymoma subtypes are quite rare, few studies have correlated integrated pathology and clinical outcome, often focusing on small series of single molecular types. We collected data from 2023 ependymomas as classified by DNA methylation profiling, consisting of 1736 previously published and 287 unpublished methylation profiles. Methylation data and clinical information were correlated, and an integrated model was developed to predict progression-free survival. Patients with EPN-PFA, EPN-ZFTA, and EPN-MYCN tumors showed the worst outcome with 10-year overall survival rates of 56%, 62%, and 32%, respectively. EPN-PFA harbored chromosome 1q gains and/or 6q losses as markers for worse survival. In supratentorial EPN-ZFTA, a combined loss of CDKN2A and B indicated worse survival, whereas a single loss did not. Twelve out of 200 EPN-ZFTA (6%) were located in the posterior fossa, and these tumors relapsed or progressed even earlier than supratentorial tumors with a combined loss of CDKN2A/B. Patients with MPE and PF-SE, generally regarded as non-aggressive tumors, only had a 10-year progression-free survival of 59% and 65%, respectively. For the prediction of the 5-year progression-free survival, Kaplan-Meier estimators based on the molecular subtype, a Support Vector Machine based on methylation, and an integrated model based on clinical factors, CNV data, and predicted methylation scores achieved balanced accuracies of 66%, 68%, and 73%, respectively. Excluding samples with low prediction scores resulted in balanced accuracies of over 80%. In sum, our large-scale analysis of ependymomas provides robust information about molecular features and their clinical meaning. Our data are particularly relevant for rare and hardly explored tumor subtypes and seemingly benign variants that display higher recurrence rates than previously believed.

Keywords: DNA methylation; Ependymoma; Machine learning; Molecular types; Survival.


Figures

Fig. 1
Fig. 1
Ten molecular classes of ependymoma defined by DNA methylation-based class prediction form distinct clusters in a large new cohort. a Heatmap showing the hierarchical clustering of the DNA methylation profiles of 2023 ependymomas. Each column represents one sample, and the rows show the 10,000 most variable CpG sites. Methylated (red) and unmethylated (blue) sites (beta values) are depicted by a color scale as shown. The associated subtype, array type, material, sex, age, and localization are indicated. b Uniform Manifold Approximation and Projection (UMAP) of the ependymoma cohort samples (n = 2023) on the 10,000 most variable CpG sites. Individual samples are color-coded according to the respective molecular class as defined by random forest-based class prediction. c Violin plot showing the patient age at diagnosis across the ten molecular types. d Progression-free survival (PFS) across the ten molecular types. e Overall survival (OS) across the ten molecular types
Fig. 2
Fig. 2
Clinical and molecular characteristics of supratentorial and posterior fossa EPN-ZFTA. a Distribution of supratentorial and posterior fossa localization of ZFTA tumors (n = 200). bd MRI images of a ZFTA tumor located in the posterior fossa: b sagittal, c coronal, d transversal. e UMAP of ZFTA tumors (n = 228). f Age distribution across the localizations in a beeswarm plot. g Distribution of CDKN2A/B loss across the localizations. hi Overview of chromosome arm-wise copy number alterations in supratentorial and posterior fossa tumors. j PFS of supratentorial tumors with CDKN2A/B alterations and posterior fossa tumors. k OS of supratentorial tumors with CDKN2A/B alterations and posterior fossa tumors
Fig. 3
Fig. 3
Combined 1q gain and 6q loss leads to worse outcomes in EPN-PFA. a Heatmap showing the k-means clustering (k = 9) of 969 PFA ependymomas. Each column corresponds to one sample, and the rows represent the 10,000 most variable CpG sites. Methylated (red) and unmethylated (blue) sites (beta values) are indicated by a color scale as shown. The associated material, array type, sex, localization, subtype, 1q and 6q status, as well as the patient’s age at diagnosis, are shown. b Unsupervised clustering of PFA samples (n = 969) in a UMAP using the 10,000 most variable CpG sites. Individual samples are color-coded according to their subtype. c Bar plot showing the distribution of chromosome 1q gain and 6q loss status. d PFS according to the 1q and 6q status. e OS according to the 1q and 6q status
Fig. 4
Fig. 4
Comparison of molecular subtyping and machine learning models in survival prediction. ad PFS stratified by the predicted 5-year PFS based on: a the molecular type, b the molecular subtype, c the Support Vector Machine (SVM), d the SVM predictions with a probability score below 0.3 or above 0.7. eh Confusion matrices and balanced accuracy for the predicted 5-year PFS based on: e the molecular type, f the molecular subtype, g the SVM, h the SVM predictions with a probability score below 0.3 or above 0.7. il PFS stratified by the predicted 5-year PFS from the integrated models based on: i clinical data and copy number alterations, j the SVM, k the combined logistic regression model, l the predictions from the combined model with a probability score below 0.3 or above 0.7. mp Confusion matrices and balanced accuracy for the predicted 5-year PFS from the integrated models based on: m clinical data and copy number alterations, n the SVM, o the combined logistic regression model, p the predictions from the combined model with a probability score below 0.3 or above 0.7. NED, no evidence of disease/progression

References

    1. Aryee MJ, Jaffe AE, Corrada-Bravo H, Ladd-Acosta C, Feinberg AP, Hansen KD, et al. Minfi: a flexible and comprehensive bioconductor package for the analysis of infinium DNA methylation microarrays. Bioinformatics. 2014;30:1363–1369. doi: 10.1093/bioinformatics/btu049. - DOI - PMC - PubMed
    1. Baroni LV, Sundaresan L, Heled A, Coltin H, Pajtler KW, Lin T, et al. Ultra high-risk PFA ependymoma is characterized by loss of chromosome 6q. Neuro Oncol. 2021;23:1360–1370. doi: 10.1093/neuonc/noab034. - DOI - PMC - PubMed
    1. Bockmayr M, Harnisch K, Pohl LC, Schweizer L, Mohme T, Korner M, et al. Comprehensive profiling of myxopapillary ependymomas identifies a distinct molecular subtype with relapsing disease. Neuro Oncol. 2022;24:1689–1699. doi: 10.1093/neuonc/noac088. - DOI - PMC - PubMed
    1. Cage TA, Clark AJ, Aranda D, Gupta N, Sun PP, Parsa AT, et al. A systematic review of treatment outcomes in pediatric patients with intracranial ependymomas. J Neurosurg Pediatr. 2013;11:673–681. doi: 10.3171/2013.2.PEDS12345. - DOI - PubMed
    1. Capper D, Jones DTW, Sill M, Hovestadt V, Schrimpf D, Sturm D, et al. DNA methylation-based classification of central nervous system tumours. Nature. 2018;555:469–474. doi: 10.1038/nature26000. - DOI - PMC - PubMed

Publication types