. 2024 Jun;72(3):383-394.
doi: 10.1007/s12026-023-09441-w. Epub 2024 Jan 24.

Characteristics of splenic PD-1+ γδT cells in Plasmodium yoelii nigeriensis infection

Affiliations

Characteristics of splenic PD-1+ γδT cells in Plasmodium yoelii nigeriensis infection

Dianhui Chen et al. Immunol Res. 2024 Jun.

Erratum in

Abstract

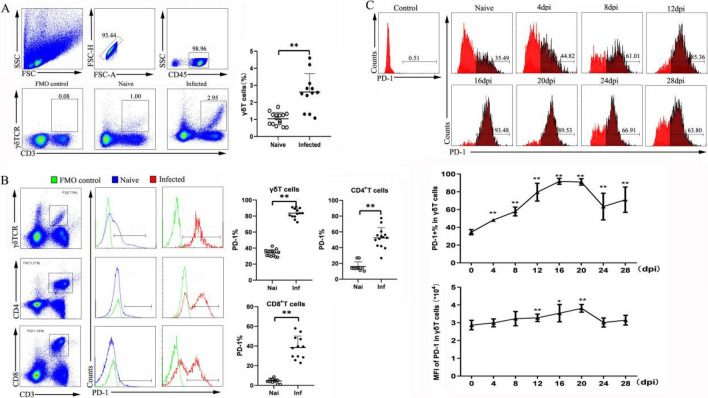
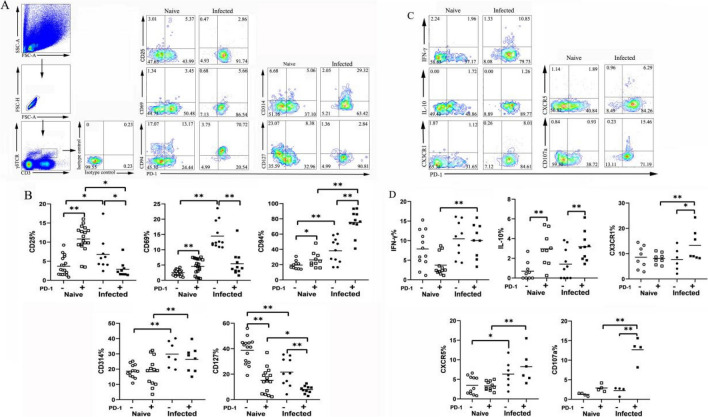
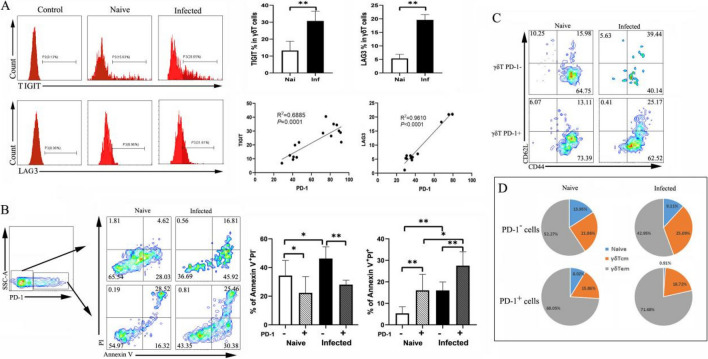
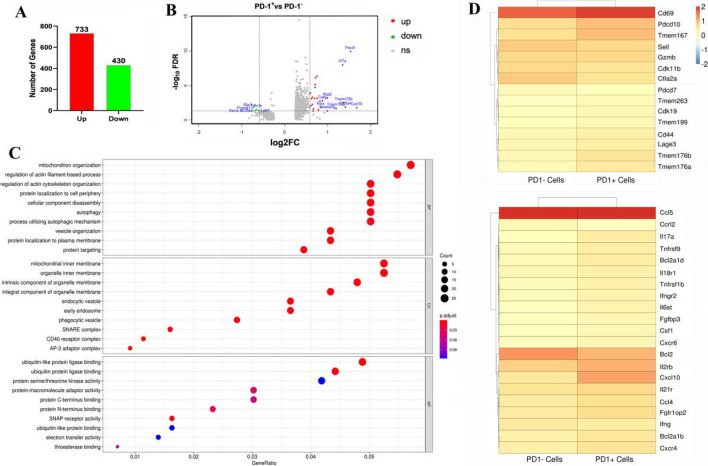
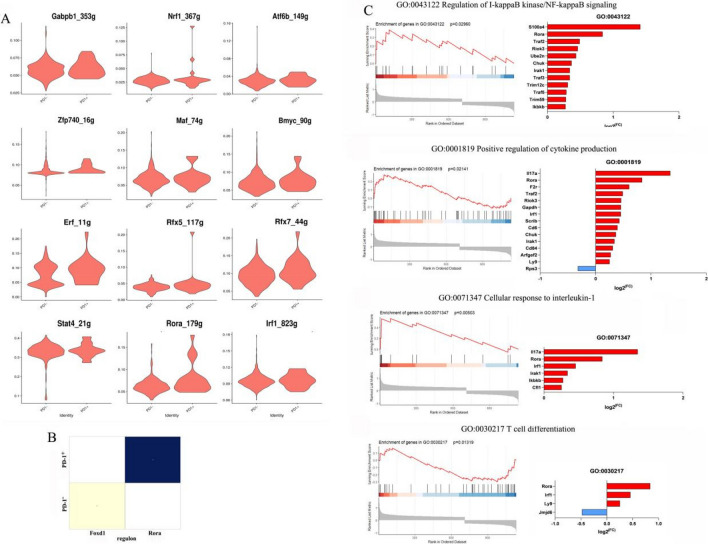
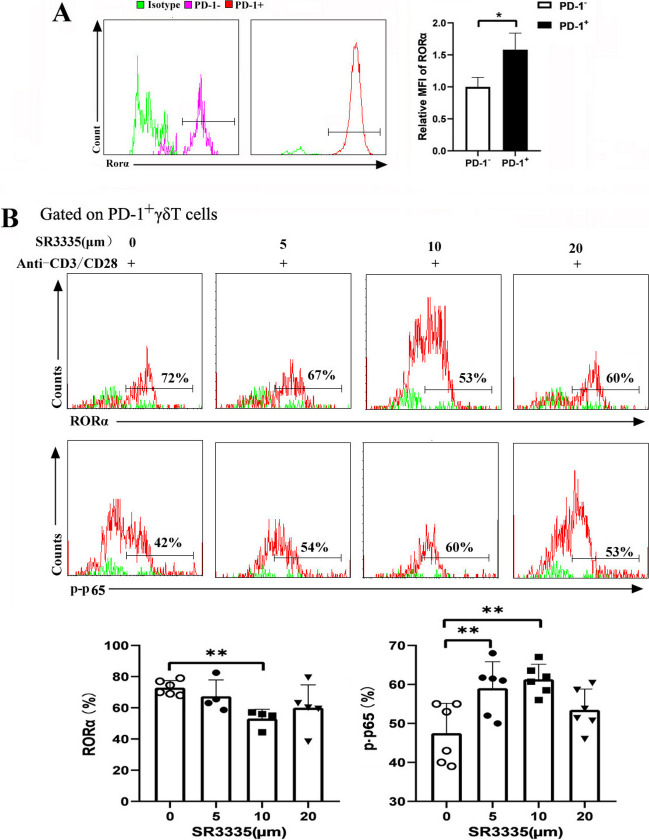
Although the functions of programmed death-1 (PD-1) on αβ T cells have been extensively reported, a role for PD-1 in regulating γδT cell function is only beginning to emerge. Here, we investigated the phenotypic and functional characteristics of PD-1-expressing γδT cells, and the molecular mechanism was also explored in the Plasmodium yoelii nigeriensis (P. yoelii NSM)-infected mice. Flow cytometry and single-cell RNA sequencing (scRNA-seq) were performed. An inverse agonist of RORα, SR3335, was used to investigate the role of RORα in regulating PD-1+ γδT cells. The results indicated that γδT cells continuously upregulated PD-1 expression during the infection period. Higher levels of CD94, IL-10, CX3CR1, and CD107a; and lower levels of CD25, CD69, and CD127 were found in PD-1+ γδT cells from infected mice than in PD-1- γδT cells. Furthermore, GO enrichment analysis revealed that the marker genes in PD-1+ γδT cells were involved in autophagy and processes utilizing autophagic mechanisms. ScRNA-seq results showed that RORα was increased significantly in PD-1+ γδT cells. GSEA identified that RORα was mainly involved in the regulation of I-kappaB kinase/NF-κB signaling and the positive regulation of cytokine production. Consistent with this, PD-1-expressing γδT cells upregulated RORα following Plasmodium yoelii infection. Additionally, in vitro studies revealed that higher levels of p-p65 were found in PD-1+ γδT cells after treatment with a RORα selective synthetic inhibitor. Collectively, these data suggest that RORα-mediated attenuation of NF-κB signaling may be fundamental for PD-1-expressing γδT cells to modulate host immune responses in the spleen of Plasmodium yoelii nigeriensis-infected C57BL/6 mice, and it requires further investigation.

Keywords: Plasmodium yoelii nigeriensis NSM; NF-κB; PD-1; RORα; γδT cells.


Conflict of interest statement

The authors declare that they have no conflict of interest.

Figures

Fig. 1
Fig. 1
The expression of PD-1 in γδT cells increased upon P. yoelii NSM infection. A Splenic lymphocytes were stained with anti-CD3 and anti-γδTCR fluorescent mAbs. The expression of CD3 and γδT on spleen lymphocytes of naive and infected mice was analyzed by flow cytometry. Flow cytometric analysis from one representative experiment and average percentages of γδT cells were calculated. B PD-1 expression by gated populations of γδT cells, CD4+ T cells, and CD8+T cells from normal and infected mice, respectively. The proportions of PD-1+γδT cells, PD-1+CD4+T cells, and PD-1+CD8+T cells from naive and infected mice were compared. C The dynamic changes of PD-1+ γδT cells in P. yoelii NSM-infected mice were investigated from 0 to 28 days. A total of 3–5 samples were prepared for each group, and the experiments were repeated three times. One million cells from one animal were stained for the cell surface antigens. *P < 0.05, **P < 0.01, the error bars indicate SD
Fig. 2
Fig. 2
The expression of surface markers and cytokines on the PD-1+γδT cells. Single splenic lymphocytes were stained with fluorescent antibodies CD25, CD69, CD94, CD314, CD127. (A) One representative flow cytometry analysis. B The percentages of different surface markers were calculated. C Single splenic lymphocytes incubated with fluorescent antibodies: CX3CR1, CXCR5, and CD107a and then intracellularly stained with IFN-γ and IL-10. One representative flow cytometry analysis. D The percentages of different markers were calculated. A total of 3–5 samples were prepared for each group, and the experiments were repeated three times. One million cells from one animal were stained for the cell surface antigens. Two million cells from one animal were stained for the cell cytokines. *P < 0.05, **P < 0.01, the error bars indicate SD
Fig. 3
Fig. 3
Characterization of co-expression of checkpoints, apoptosis, and memory of PD-1+ γδT cells. A γδT cells from naive and infected mice were analyzed for TIGIT and LAG-3 expression. The correlations between the expression of TIGIT and LAG-3 and PD-1 in naive and P. yoelii infected mice. B Representative contour plots showing the apoptosis of PD-1+/− γδT cells from naive and infected mice (left). The percentage changes of Annexin V+PI and Annexin V+PI+ were calculated (right). C Representative contour plot to distinguish between CD62L+CD44 (Naïve), CD62L+CD44+(CM), and CD62L-CD44+( EM) cells among PD-1-γδT and PD-1+γδT cells from naive and infected mice. D Frequencies of naïve γδT, γδTcm, and γδTem cells among PD-1 γδT and PD-1+γδT cells from naive and infected mice. A total of 3–5 samples were prepared for each group, and the experiments were repeated three times. One million cells from one animal were stained for the cell surface antigens. *P < 0.05, **P < 0.01, the error bars indicate SD
Fig. 4
Fig. 4
RNA-sequencing analysis of the differently expressed genes between PD-1−/+ γδT cells post P. yoelii infection. The PD-1+ and PD-1 γδT cells from the spleens of mice infected with P. yoelii (14 days post-infection) were sorted and sequenced by Single-cell RNA-sequencing. A Numbers of up-regulated and down-regulated genes in PD-1+γδT cells cells. B Differential gene expression was summarized in the mean difference (MD) plot of log2 expression fold-changes against the average log expressions for each gene. The differentially expressed (DE) genes relative to a fold change threshold of 1.5 are highlighted, with points colored in red and green indicating up- and down-regulated genes, respectively. C GO enrichment of different expressed genes. GO, Genetic Ontology; BP, biological process; CC, cellular component; MF, molecular function. D The heatmap for the surface molecules and cytokines expressed in PD-1−/+ γδT cells
Fig. 5
Fig. 5
Differentially expressed transcription factors in PD-1−/+ γδT cells post P. yoelii infection. A The violin of the area under the curve (AUC) scores of transcription factors (TF) motifs. B The heatmap of the two largest differentially expressed transcription factors in PD-1+γδT cells and PD-1γδT cells. C Gene-set enrichment analysis (GSEA) using the transcriptomes of PD-1+ γδT cells. There is a significantly enriched expression of Rora associated with the regulation of I-kappaB kinase/NF-kappaB signaling, positive regulation of cytokine, cellular response to interleukin-1, and T-cell differentiation
Fig. 6
Fig. 6
RORα inhibitors possessed the ability to increase the expression of p-NF-κβ. Female C57BL/6 mice were infected with P. yoelii. Splenocytes were separated (12–14 days post-infection) and then stained with monoclonal antibodies against mouse CD3, γδTCR, PD-1 for flow cytometry analysis. A The expressions of RORα in PD-1+/−γδT cells were measured by flow cytometry (left). The numbers represent the relative MFI of stained RORα protein (right). B Normal female C57BL/6 mice were sacrificed. Splenocytes were treated with SR3335 at doses of 5, 10, and 20 μm for 48 h. Intranuclear amount of p-p65 were measured. The counts of RORα and p-p65 in PD-1+γδT cells were analyzed by flow cytometry and the percentages were calculated. *P < 0.05, **P < 0.01, the error bars indicate SD

Similar articles

Cited by

References

    1. Xie H, Xie S, Wang M, et al. Properties and Roles of γδT Cells in Plasmodium yoelii nigeriensis NSM Infected C57BL/6 Mice. Front Cell Infect Microbiol. 2021;11:788546. - PMC - PubMed
    1. Daily JP, Minuti A, Khan N. Diagnosis, treatment, and prevention of malaria in the US: a review. JAMA. 2022;328(5):460–471. - PubMed
    1. Pamplona A, Silva-Santos B. γδ T cells in malaria: a double-edged sword. FEBS J. 2021;288(4):1118–1129. - PMC - PubMed
    1. Ortiz-Ruiz A, Postigo M, Gil-Casanova S, et al. Plasmodium species differentiation by non-expert on-line volunteers for remote malaria field diagnosis. Malar J. 2018;17(1):54. - PMC - PubMed
    1. Yahata K, Treeck M, Culleton R, Gilberger TW, Kaneko O. Time-lapse imaging of red blood cell invasion by the rodent malaria parasite Plasmodium yoelii. PLoS One. 2012;7(12):e50780. - PMC - PubMed

Publication types

MeSH terms

Substances