. 2024 Feb 27;43(2):113700.
doi: 10.1016/j.celrep.2024.113700. Epub 2024 Jan 23.

Arachidonic acid inhibition of the NLRP3 inflammasome is a mechanism to explain the anti-inflammatory effects of fasting

Affiliations

Arachidonic acid inhibition of the NLRP3 inflammasome is a mechanism to explain the anti-inflammatory effects of fasting

Milton Pereira et al. Cell Rep. .

Abstract

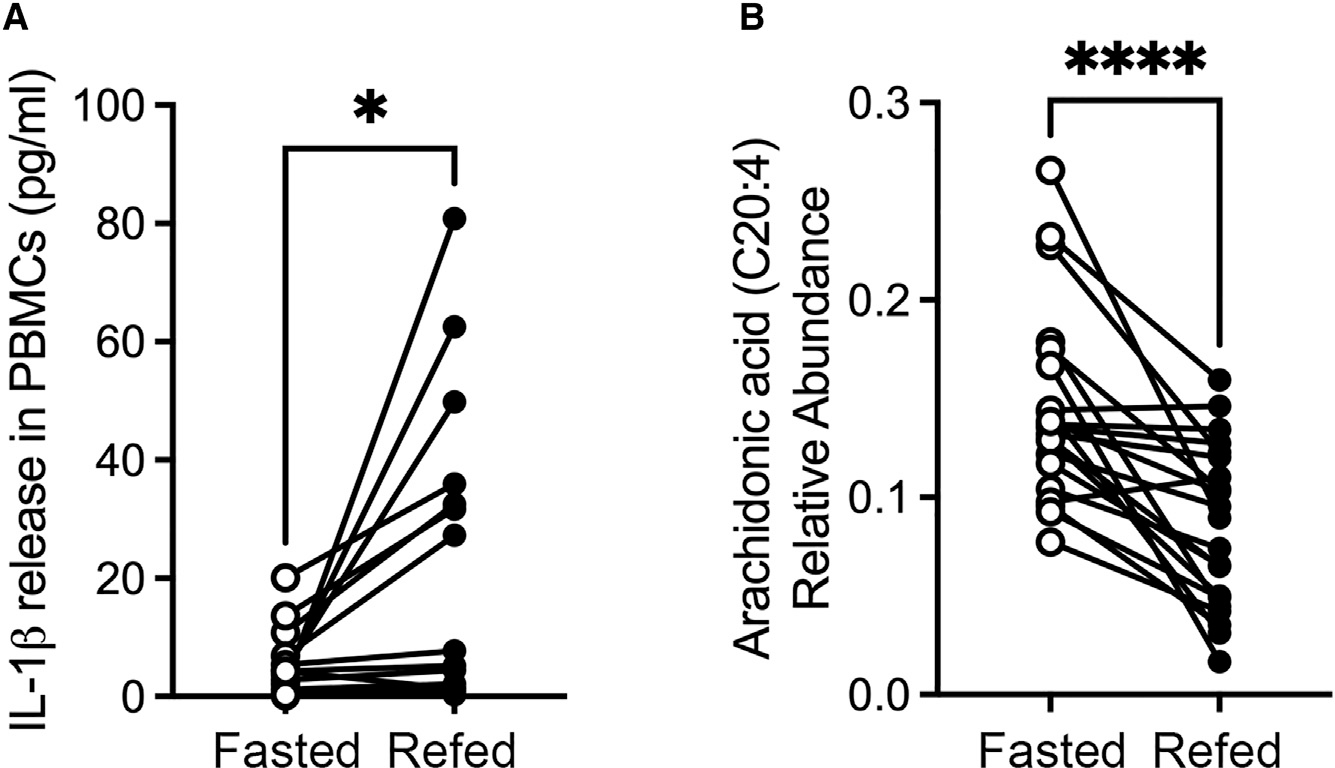
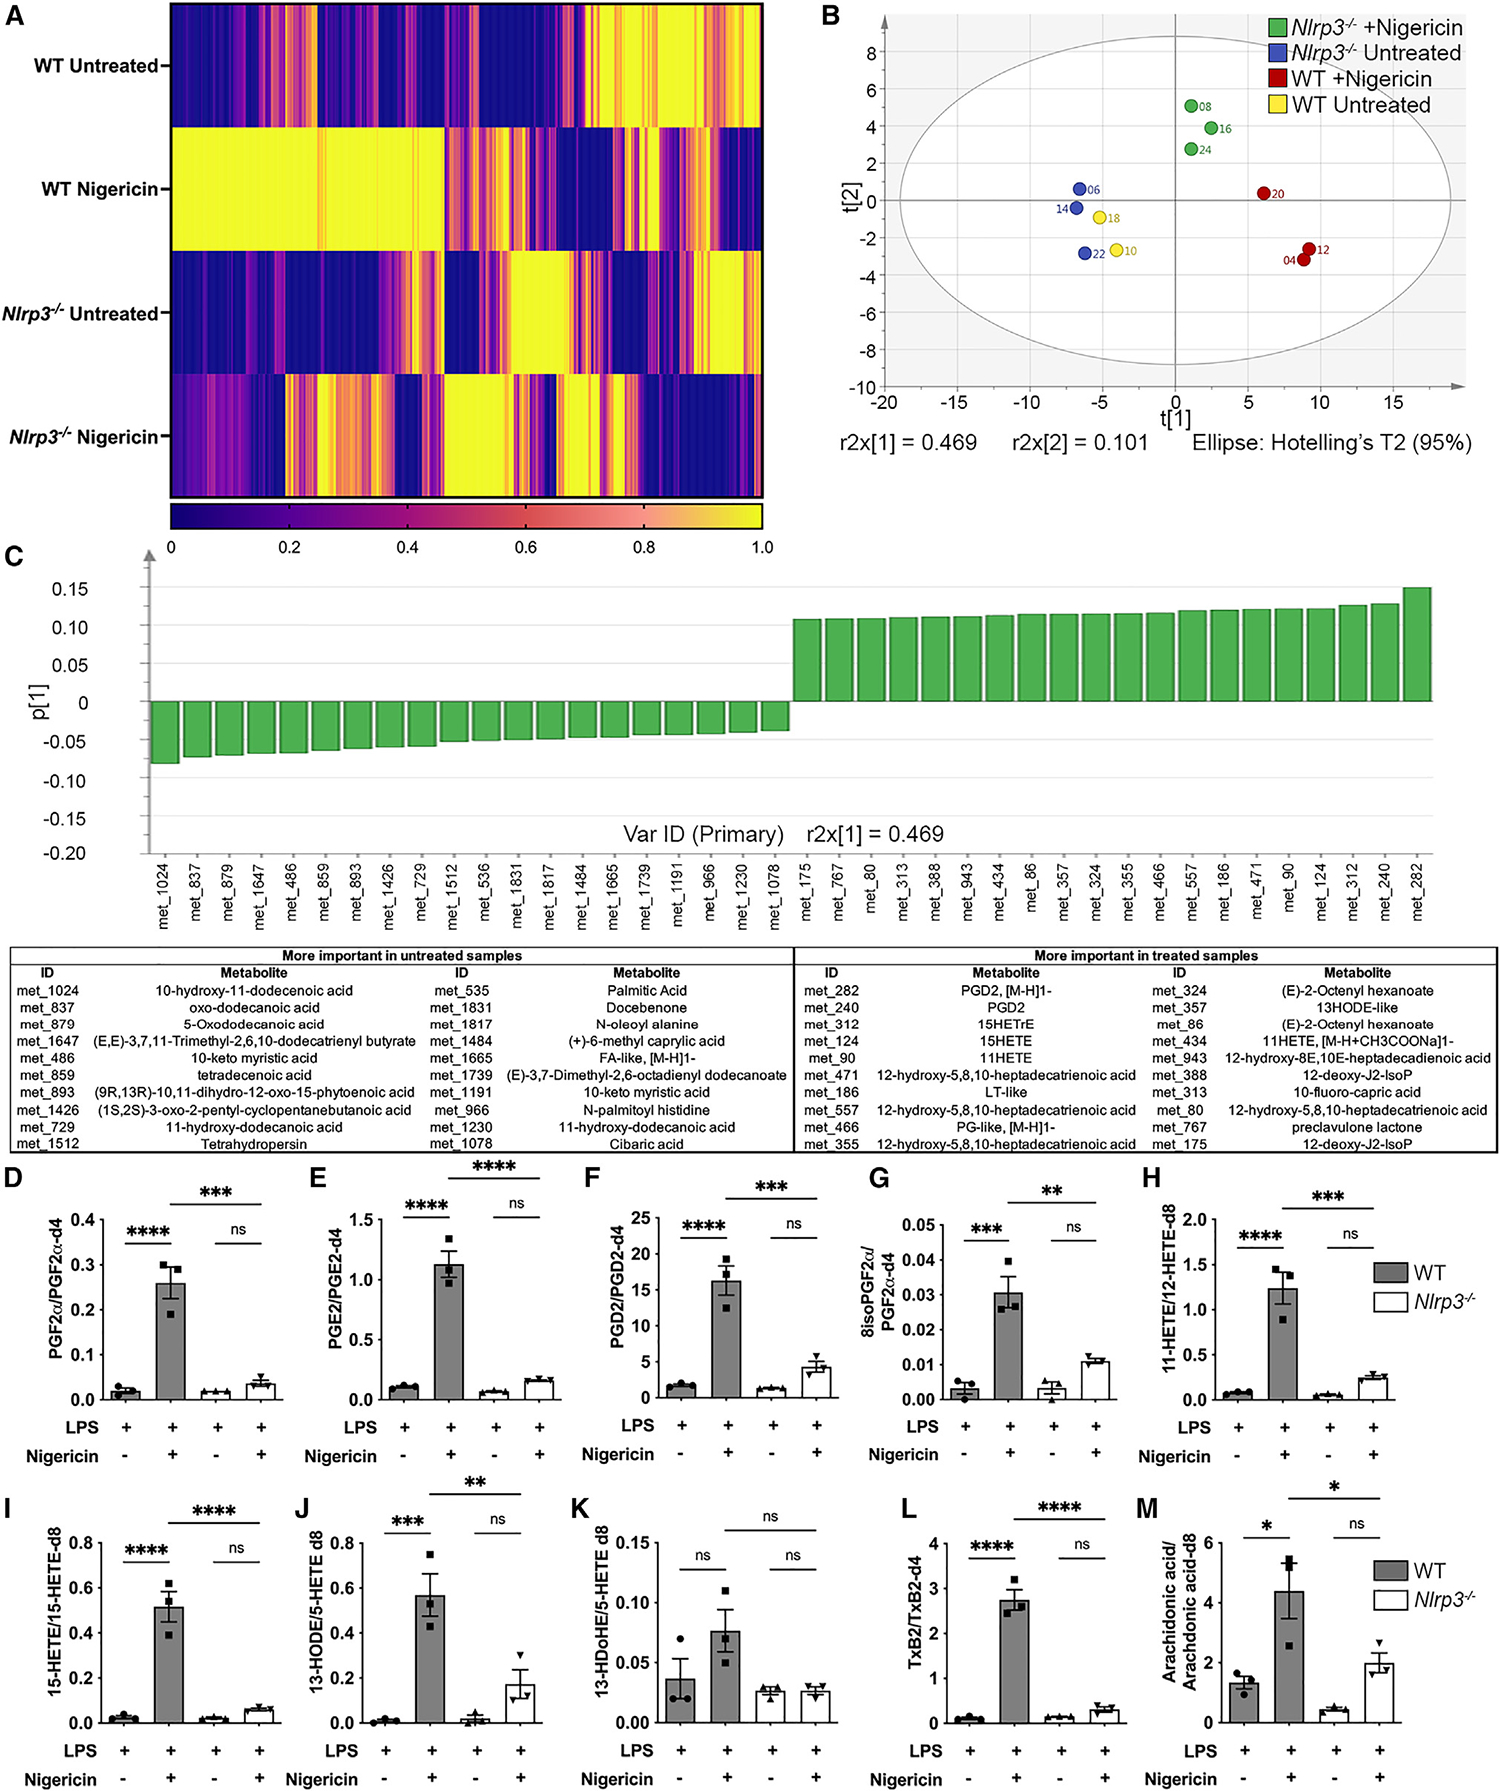
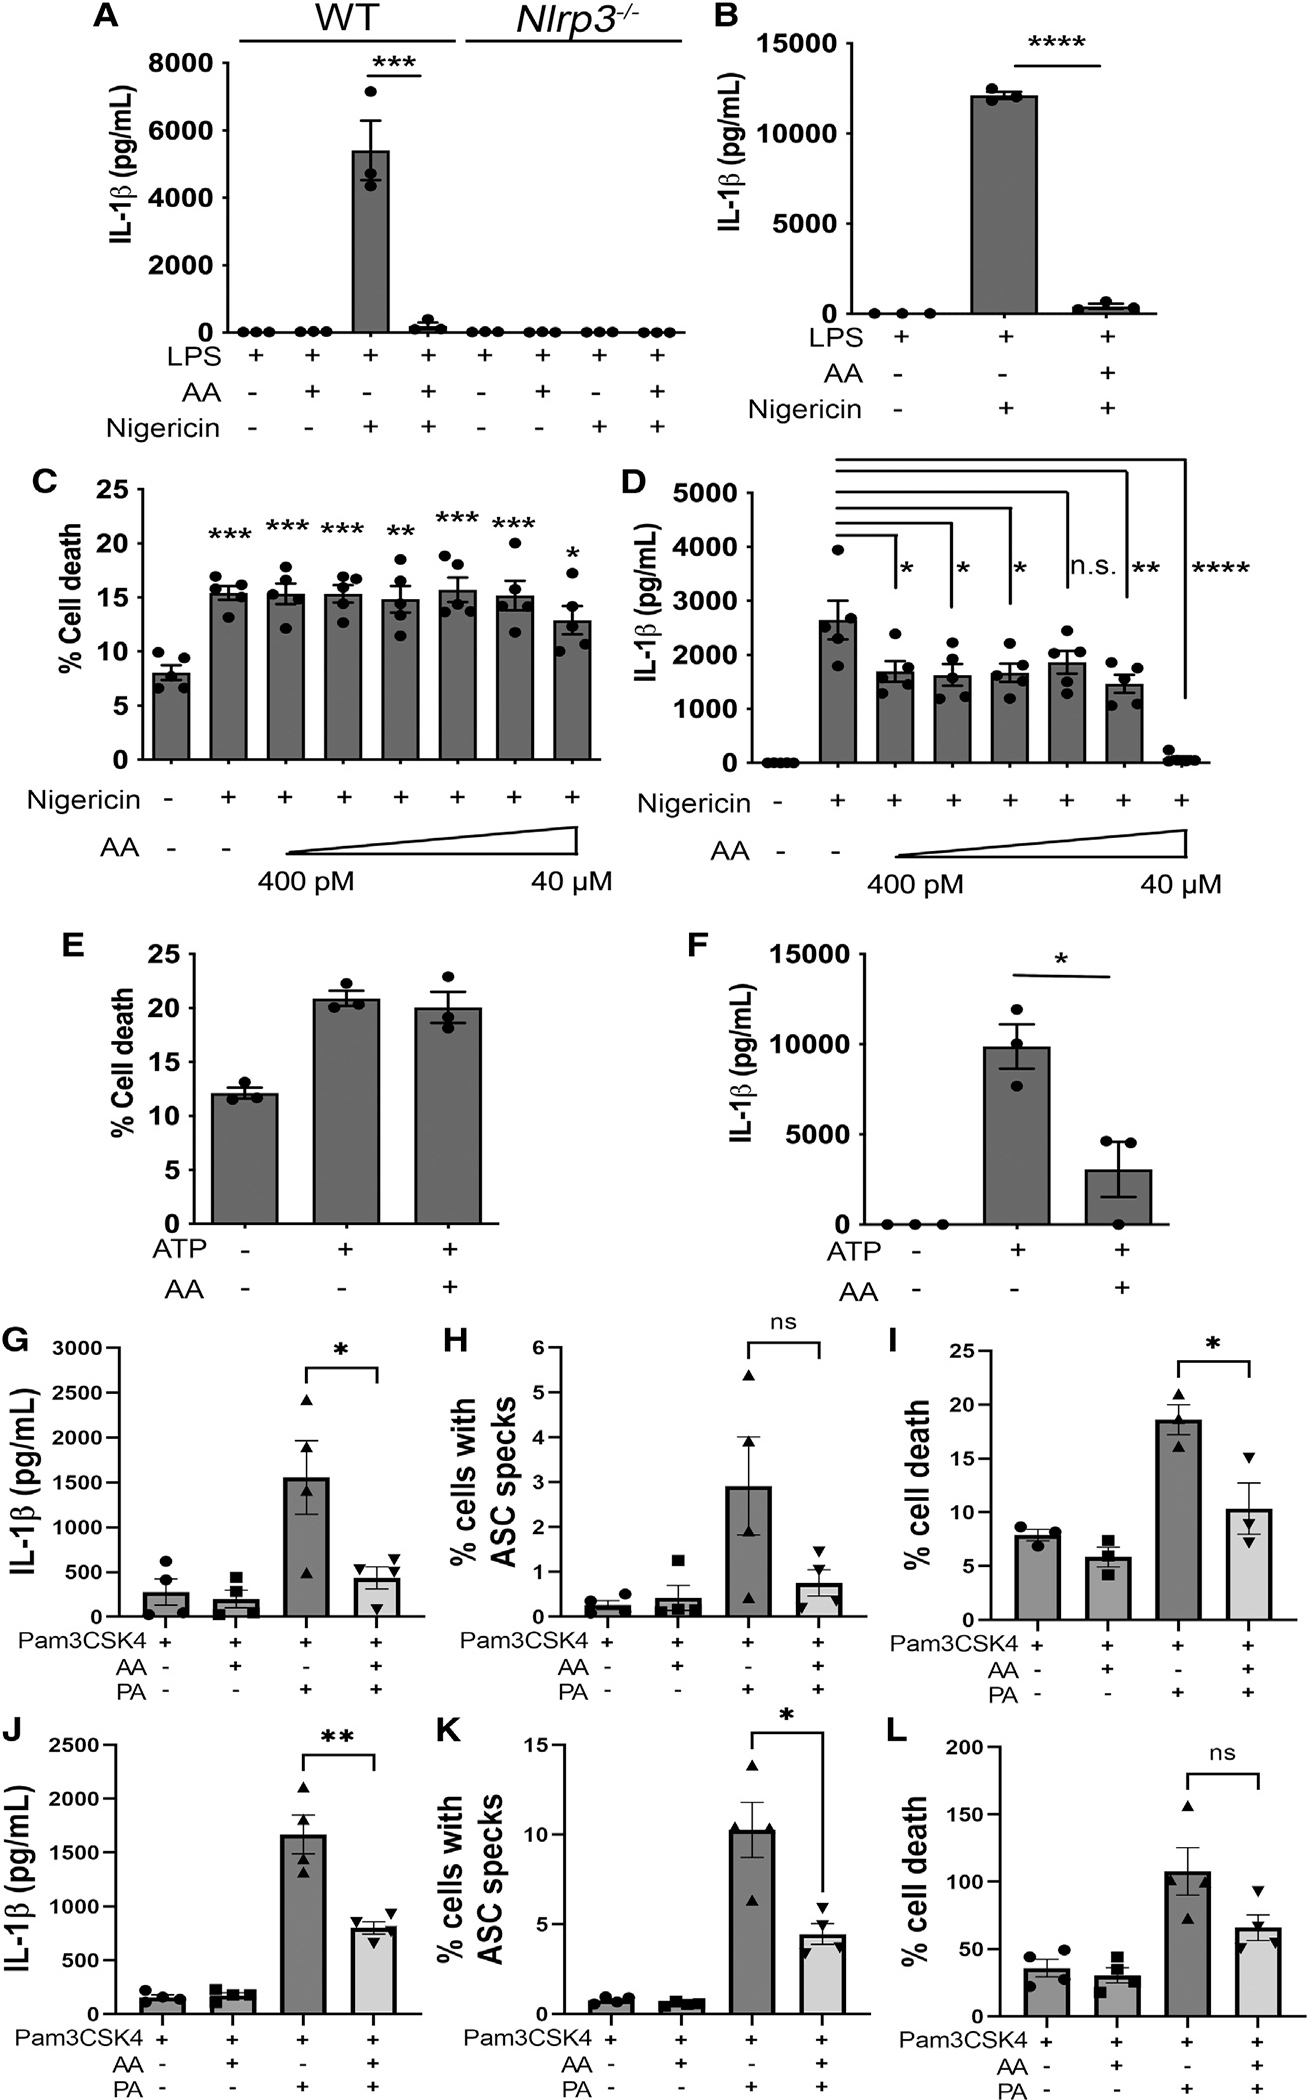
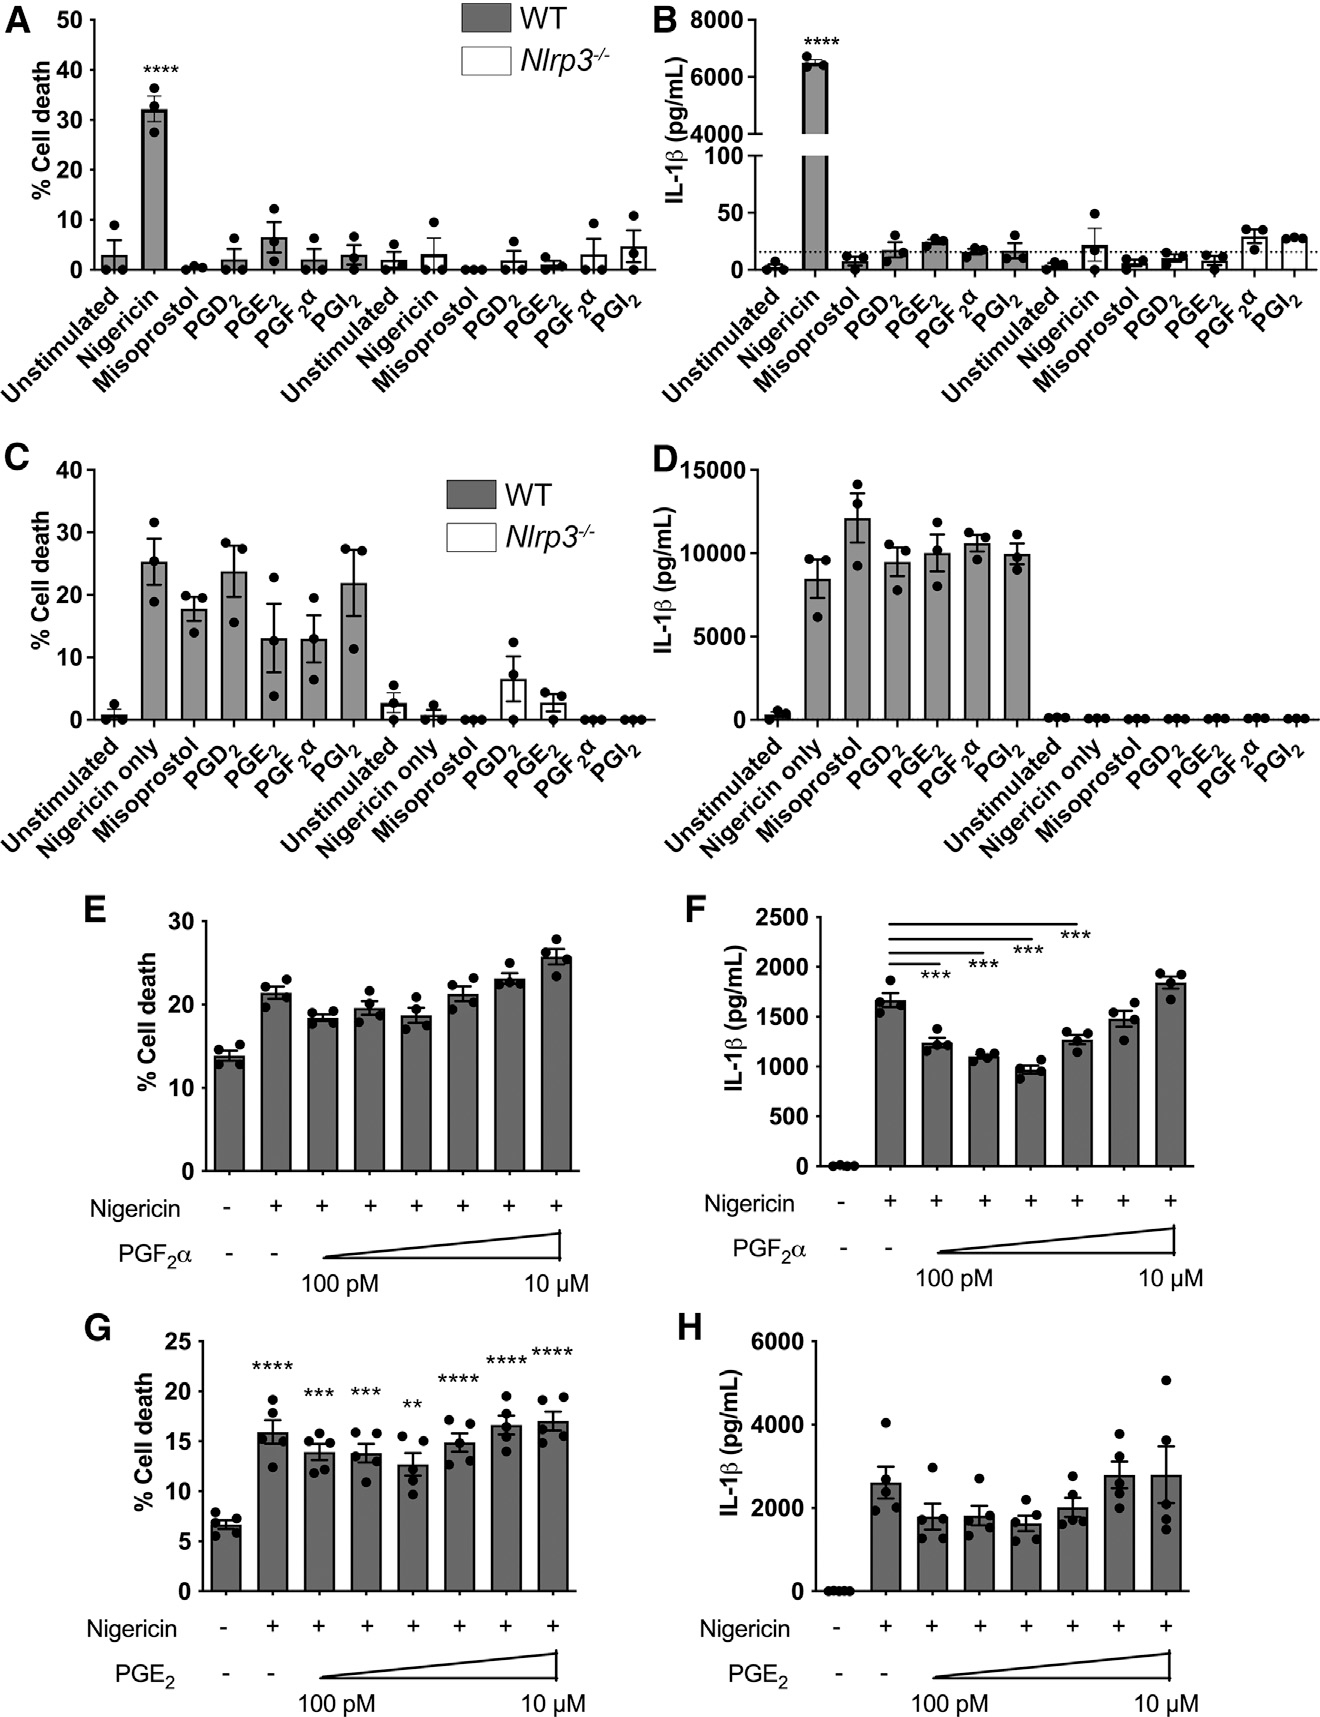
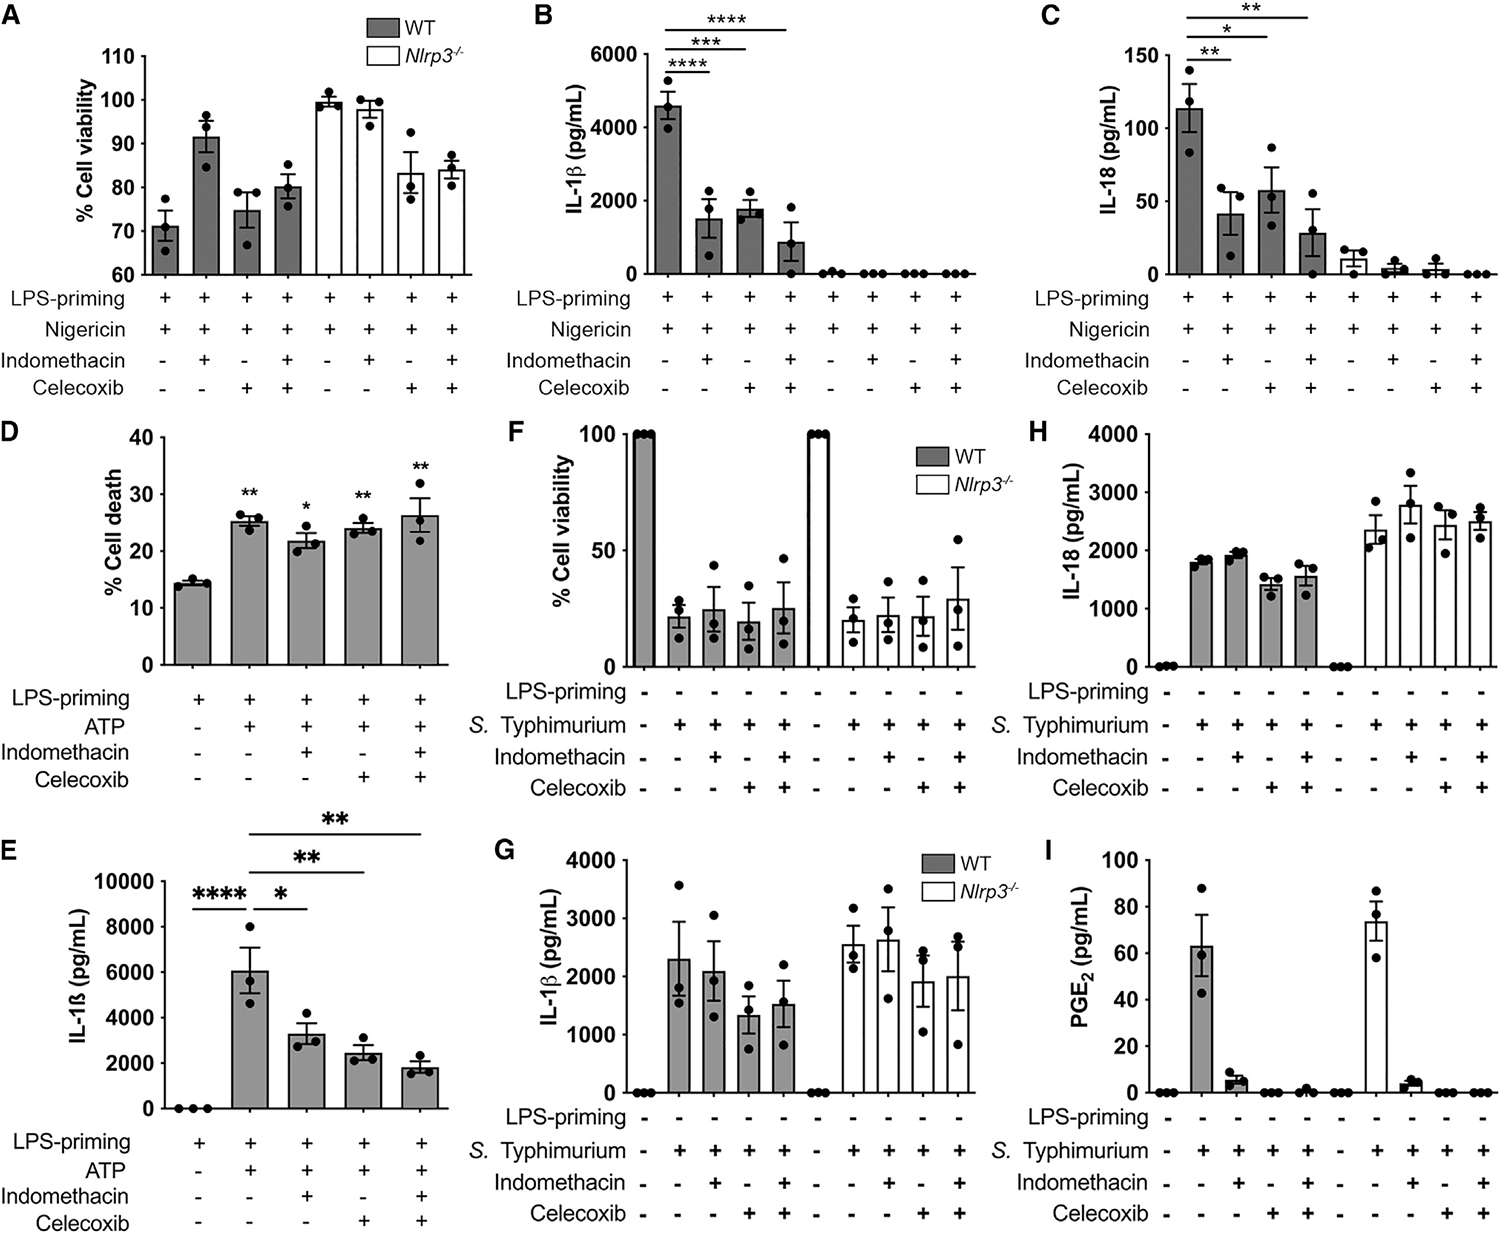
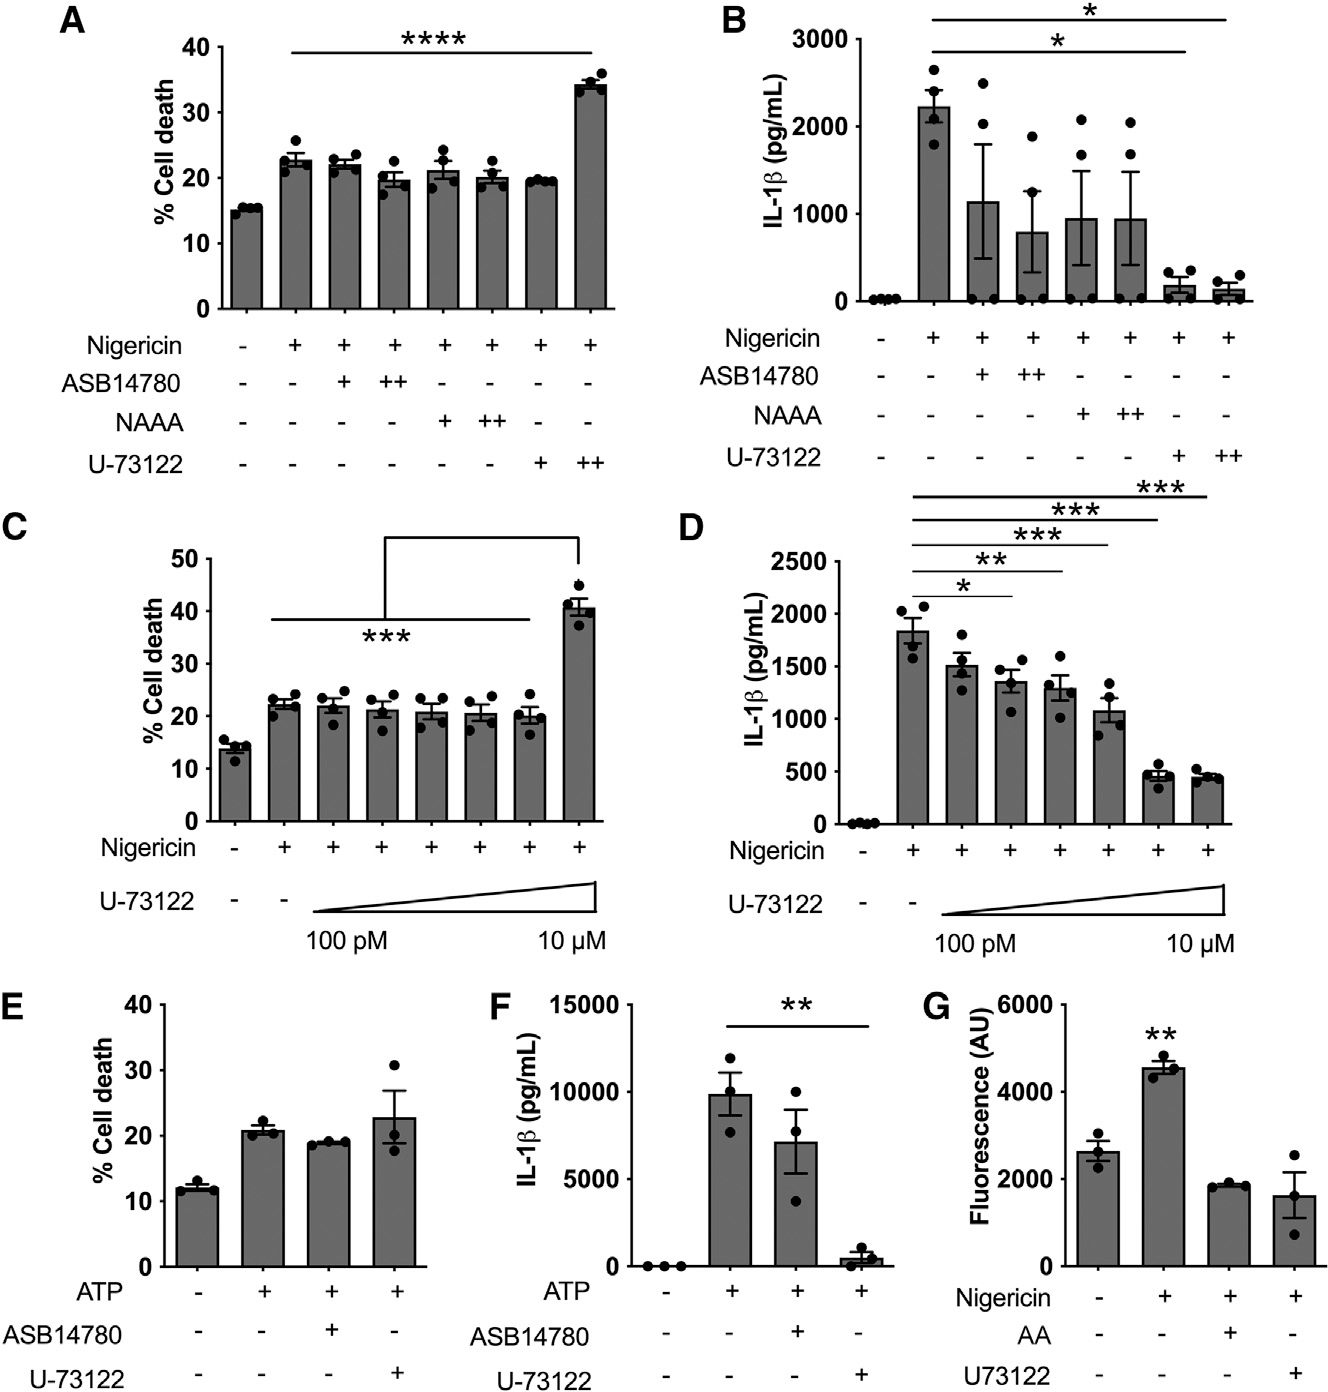
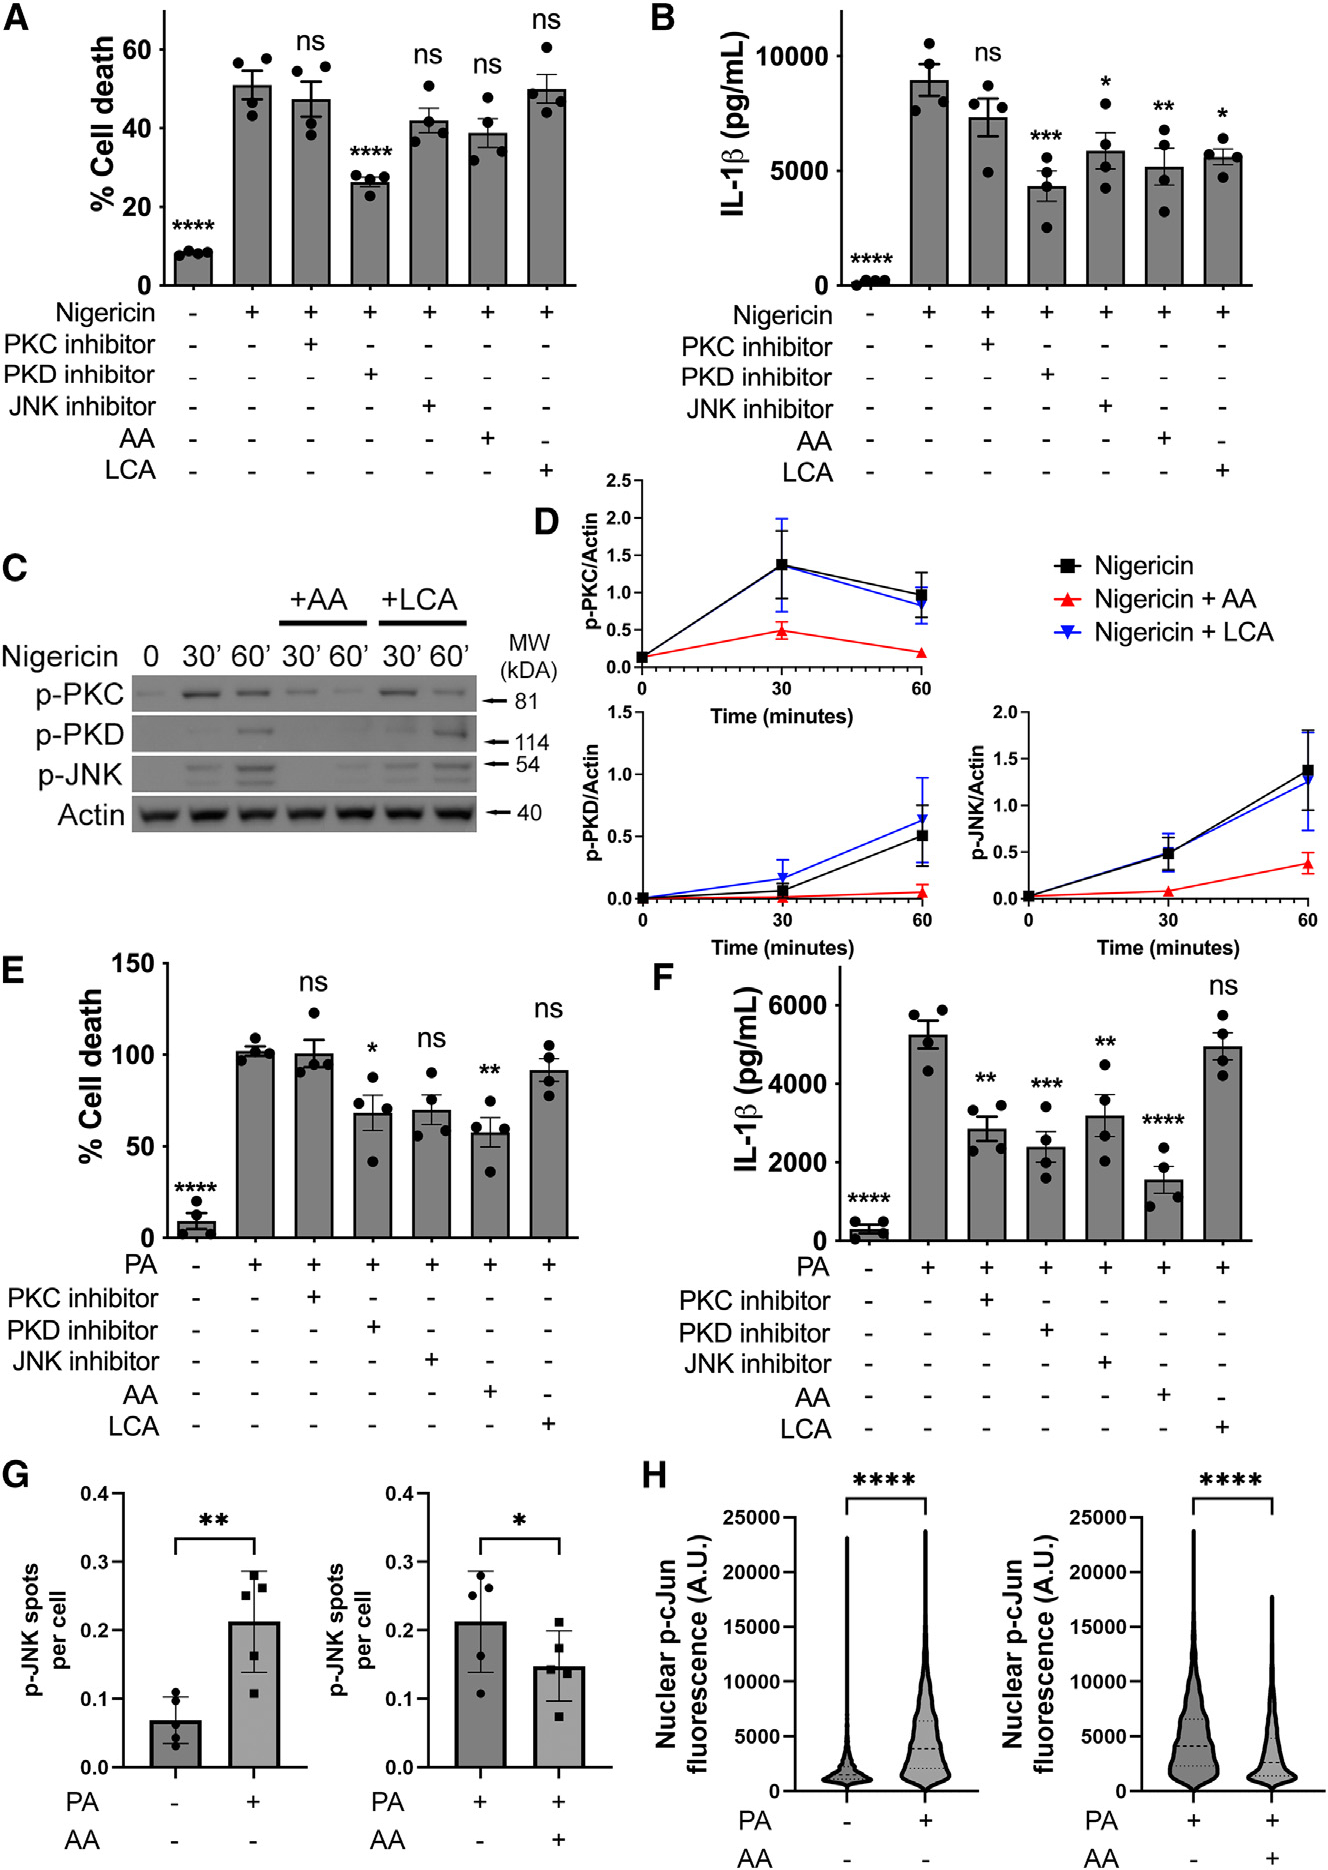
Elevated interleukin (IL)-1β levels, NLRP3 inflammasome activity, and systemic inflammation are hallmarks of chronic metabolic inflammatory syndromes, but the mechanistic basis for this is unclear. Here, we show that levels of plasma IL-1β are lower in fasting compared to fed subjects, while the lipid arachidonic acid (AA) is elevated. Lipid profiling of NLRP3-stimulated mouse macrophages shows enhanced AA production and an NLRP3-dependent eicosanoid signature. Inhibition of cyclooxygenase by nonsteroidal anti-inflammatory drugs decreases eicosanoid, but not AA, production. It also reduces both IL-1β and IL-18 production in response to NLRP3 activation. AA inhibits NLRP3 inflammasome activity in human and mouse macrophages. Mechanistically, AA inhibits phospholipase C activity to reduce JNK1 stimulation and hence NLRP3 activity. These data show that AA is an important physiological regulator of the NLRP3 inflammasome and explains why fasting reduces systemic inflammation and also suggests a mechanism to explain how nonsteroidal anti-inflammatory drugs work.

Keywords: CP: Immunology; CP: Metabolism; NLRP3; eicosanoids; inflammasome; inflammation; lipidomics; metaflammation; prostaglandins.


Conflict of interest statement

Declaration of interests C.E.B. is a co-founder of Danger Bio, on the scientific advisory board of Nodthera and Related Sciences, and is a consultant for Janssen.

Figures

Figure 1.
Figure 1.. Fasting human volunteers have elevated arachidonic acid (AA) levels
(A) Peripheral blood mononuclear cells were isolated from the volunteers and IL-1β production measured by ELISA before and after refeeding (n = 16). (B) Plasma AA was measured in the same volunteers before and after fasting (n = 21).
Figure 2.
Figure 2.. Canonical NLRP3 inflammasomes leads to eicosanoid production
(A) Heatmap analysis of lipids present in culture supernatants of LPS-primed (200 ng/mL for 3 h) WT and Nlrp3−/− BMDMs stimulated with nigericin (10 μM, 1 h), identified by liquid chromatography/drift tube ion mobility-mass spectrometry (LC/DTIM-MS). (B) Principal-component analysis of the samples used in this study. (C) Lipids that contribute the most to the differences between nigericin-treated and untreated groups. (D–M) Quantification by LC/DTIM-MS of eicosanoids PGF2α (D), PGE2 (E), PGD2 (F), 8-iso-PGF2α (G), 11-HETE (H), 15-HETE (I), 13-hydroxydocosahexaenoate (J), 13-hydroxyoctadecadienoic acid (K), TxB2 (L), and AA (M), present in culture supernatants of LPS-primed (200 ng/mL for 3 h) WT and Nlrp3−/− BMDMs stimulated with nigericin (10 μM, 1 h). *p < 0.05, **p < 0.01, ***p < 0.001, ****p < 0.0001 (one-way analysis of variance with Tukey’s multiple comparison test). Data are from three independent experiments (mean and SEM).
Figure 3.
Figure 3.. AA inhibits the NLRP3 inflammasome
(A and B) IL-1β production in LPS-primed BMDMs after 1 h stimulation with 10 μM nigericin with or without 40 μM AA added after priming (A) or during priming (B). (C-F) Cellular viability (C and E) and IL-1β (D and F) produced by LPS-primed WT BMDMs after stimulation with nigericin (10 μM, 1 h) (C and D) or ATP (5 mM, 30 min) (E and F) in presence of 40 μM AA. (G-I) Cellular viability (G), ASC speck quantification (H), and IL-1β (I) produced by WT BMDMs primed with Pam3CSK4 (200 ng/mL, 4 h) after stimulation with palmitic acid (PA; 1 mM, 16 h) in presence of 40 μM AA. (J-L) Cellular viability (J), ASC speck quantification (K), and IL-1β (L) produced by THP-1 cells (differentiated with PMA, 200 ng/mL for 24 h followed by 24 h washout) primed with Pam3CSK4 (200 ng/mL, 4 h) after stimulation with PA (500 μM, 24 h) in presence of 40 μM AA. *p < 0.05, **p < 0.01, ***p < 0.001, and ****p < 0.0001 (one-way analysis of variance with Tukey’s multiple comparison test or Student’s unpaired t test). n.s., not significant. Data are from at least three independent experiments (mean and SEM).
Figure 4.
Figure 4.. Individual eicosanoids have little effect on NLRP3 activity
(A-D) Cell death (A and C), and IL-1β (B and D) produced by LPS-primed (200 ng/mL for 3 h) WT and Nlrp3−/− BMDMs in response to 1 h stimulation with 1 μM misoprostol, PGD2, PGE2, PGF2α, and PGI2. (E-H) Cell death (E and G) and IL-1β (F and H) produced by LPS-primed WT BMDMs in response to 1 h stimulation with 10 mM nigericin in presence of increasing concentrations of PGF2α (E and F) and PGE2 (G and H). *p < 0.05, **p < 0.01, ***p < 0.001, and ****p < 0.0001 in comparison to untreated controls unless indicated otherwise (one-way analysis of variance with Tukey’s multiple comparison test). Dashed line represents the assay detection limit. Data are from three (A-D) or four (E-H) independent experiments (mean and SEM).
Figure 5.
Figure 5.. Cyclooxygenase (COX) activity regulates NLRP3 activity but not NLRC4
(A-H) Cellular viability (A and D), IL-1β (B and E), and IL-18 (C) produced by LPS-primed (200 ng/mL for 3 h) WT and Nlrp3−/− BMDMs in response to NLRP3 stimulant nigericin (10 μM, 1 h) or ATP (5 mM, 30 min) in presence of COX inhibitors indometacin (100 μM) or celecoxib (10 μM). (F-I) Cellular viability (F), IL-1β (G), IL-18 (H), and PGE2 (I) produced by unprimed WT and Nlrp3−/− BMDMs in response to S. Typhimurium infection (MOI 10, 2 h) in presence of COX inhibitors. *p < 0.05, **p < 0.01, ***p < 0.001, and ****p < 0.0001 (one-way analysis of variance with Tukey’s multiple comparison test). Data are from three independent experiments (mean and SEM).
Figure 6.
Figure 6.. PLC is required for canonical NLRP3 activity
(A and B) Cell death (A) and IL-1β production (B) in LPS-primed (200 ng/mL for 3 h) WT BMDMs in response to 1 h stimulation with 10 mM nigericin in presence of 1 (+) or 10 μM (++)PLA2 inhibitors ASB1414780 and NAAA or PLC inhibitor U-73122. (C and D) Cell death (C) and IL-1β (D) produced by LPS-primed WT BMDMs stimulated for 1 h with 10 mM nigericin in presence of increasing concentrations of PLC inhibitor U-73122. (E and F) Cell death (E) and IL-1β (F) produced by LPS-primed WT BMDMs stimulated for 30 min with 5 mM ATP in presence of 1 mM ASB14780 (PLA2 inhibitor) or 1 μM U-73122 (PLC inhibitor). (G) PLC activity of LPS-primed WT BMDMs stimulated with 10 μM nigericin for 1 h in presence of U-73122 or 40 μM AA. *p < 0.05, **p < 0.01, ***p < 0.001, and ****p < 0.0001 (one-way analysis of variance with Tukey’s multiple comparison test or Student’s unpaired t test). Data are from three (E–G) or four (A-D) independent experiments (mean and SEM).
Figure 7.
Figure 7.. AA inhibits PKC, PKD, and JNK
(A and B) Cell death (A) and IL-1β production (B) in THP-1 cells primed with LPS (200 ng/mL, 3 h) followed by stimulation with nigericin (10 μM, 1 h) in presence of PKC inhibitor (sotrastaurin, 10 μM), PKD inhibitor (CRT006601, 10 μM), JNK inhibitor (SP600125, 10 μM), AA (40 μM), or LCA (30 μM). (C and D) Immunoblots (C) and densitometric quantification (D) of THP-1 cells primed with LPS (200 ng/mL, 3 h) and stimulated with nigericin (10 μM) in presence of AA (40 μM) or LCA (30 μM) for up to 60 min. (E and F) Cell death (E) and IL-1β production (F) in THP-1 cells primed with Pam3CSK4 (200 ng/mL, 4 h) followed by stimulation with PA (500 μM, 16 h) in presence of PKC inhibitor (sotrastaurin, 10 μM), PKD inhibitor (CRT006601, 10 μM), JNK inhibitor (SP600125, 10 μM), AA (40 μM), or LCA (30 μM). (G and H) Quantification of p-JNK (G) and nuclear p-c-Jun (H) in THP-1 cells primed with Pam3CSK4 (200 ng/mL, 4 h) after stimulation with PA (500 μM, 24 h) in presence of 40 μM AA. THP-1 cells were differentiated with PMA (200 ng/mL) for 24 h followed by 24 h washout prior to the experiments. *p < 0.05, **p < 0.01, ***p < 0.001, and ****p < 0.0001 in comparison to nigericin-treated cells (A and B) or PA-treated cells (E and F) unless indicated otherwise (one-way analysis of variance with Tukey’s multiple comparison test). n.s., not significant. Data are from three (C and D), four (A, B, E, and F), or five (G and H) independent experiments (mean and SEM).

References

    1. Christ A, Lauterbach M, and Latz E (2019). Western Diet and the Immune System: An Inflammatory Connection. Immunity 51, 794–811. - PubMed
    1. Traba J, Kwarteng-Siaw M, Okoli TC, Li J, Huffstutler RD, Bray A, Waclawiw MA, Han K, Pelletier M, Sauve AA, et al. (2015). Fasting and refeeding differentially regulate NLRP3 inflammasome activation in human subjects. J. Clin. Invest. 125, 4592–4600. - PMC - PubMed
    1. Wiedemann SJ, Trimigliozzi K, Dror E, Meier DT, Molina-Tijeras JA, Rachid L, Le Foll C, Magnan C, Schulze F, Stawiski M, et al. (2022). The cephalic phase of insulin release is modulated by IL-1βeta. Cell Metab. 34, 991–1003.e6. - PubMed
    1. Misaki Y, Miyauchi R, Mochizuki K, Takabe S, Shimada M, Ichikawa Y, and Goda T (2010). Plasma interleukin-1beta concentrations are closely associated with fasting blood glucose levels in healthy and pre-clinical middle-aged nonoverweight and overweight Japanese men. Metabolism 59, 1465–1471. - PubMed
    1. Swanson KV, Deng M, and Ting JPY (2019). The NLRP3 inflammasome: molecular activation and regulation to therapeutics. Nat. Rev. Immunol. 19, 477–489. - PMC - PubMed

Publication types

MeSH terms