. 2024 Jan 24;19(1):e0292700.
doi: 10.1371/journal.pone.0292700. eCollection 2024.

A participatory approach to model the neighbourhood food environment

Affiliations

A participatory approach to model the neighbourhood food environment

Amanda Karapici et al. PLoS One. .

Abstract

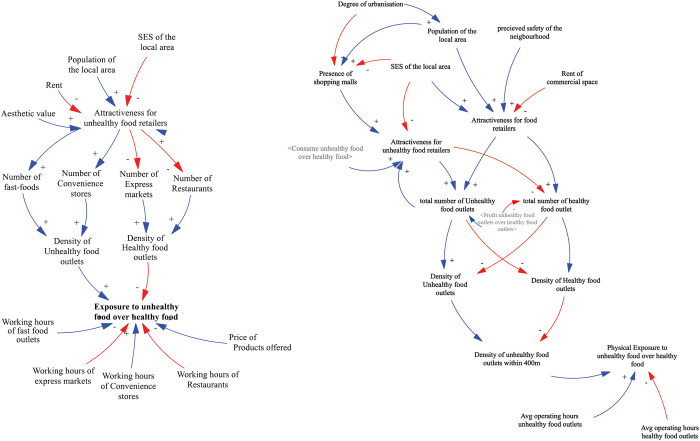
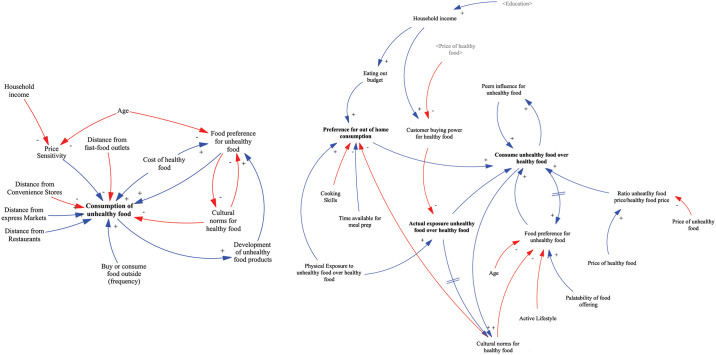
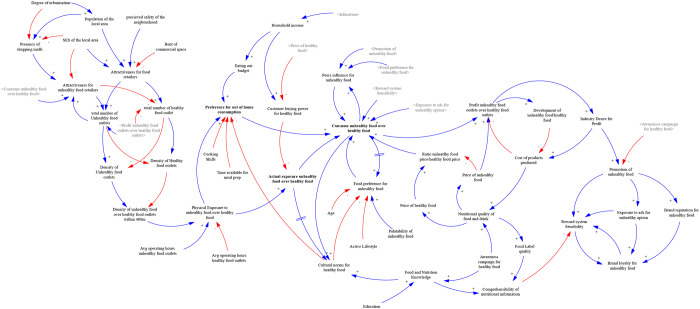
Inequalities in exposure to a health-promoting local food environment have been implicated in the generation of inequalities in diet-related behaviours and outcomes, including obesity and diabetes. Increasingly, poor diet and diet-related disease have been characterised as an emergent property of a complex system and, as such, the drivers of poor diet may be better understood by using a complex system perspective. In this study, we describe a participatory approach for understanding the system drivers of unhealthy food consumption. System dynamics (SD) was used to identify, understand, and visualise the elements of the neighbourhood food retail system that influence individuals' eating behaviour. Group Model Building (GMB), undertaken online with stakeholders (n = 11), was used to funnel existing knowledge and evidence on urban food environments and to build a conceptual system map of the local food retail environment inclusive of the drivers that influence the decision to purchase and consume meals that are high in fat, salt, and sugar (HFSS), and calories. The GMB was organised as a knowledge elicitation process involving a questionnaire, a workbook, and a structured workshop. The GMB generated a comprehensive causal loop diagram (CLD) of the retail environment inclusive of the drivers that influence the decision to purchase and consume unhealthy meals. The CLD was designed around two main variables (i) exposure to food outlets and (ii) food consumption. The system map built during the Group Model Building session linked exposure to food outlets with the possibility to purchase and consume unhealthy meals. The effectiveness of this link will be tested in an Agent-Based model. The conceptual model illustrates the complexity of the factors responsible for inequalities in unhealthy eating. The GMB approach provides a basis for building an agent-based model for local authorities to characterise their food retail environment, uncover potential leverage points for interventions and test them 'in silico' in a virtual environment.


Conflict of interest statement

The authors have declared that no competing interests exist.

Figures

Fig 1
Fig 1. Knowledge elicitation process [adapted from [15, 16]], integrated within the GMB.
Fig 2
Fig 2. Timeline of GMB.
Fig 3
Fig 3. Snapshot from the questionnaire.
Fig 4
Fig 4. Snapshot from the workbook.
Fig 5
Fig 5. Screenshot of the whiteboard used during the workshop.
Fig 6
Fig 6. Preliminary conceptual model.
Blue line represents a positive link, indicating a move in the same direction. Red line represents a negative link, indicating a move in different directions. Greyed variables represent shadow variables that are defined elsewhere in the model.
Fig 7
Fig 7. Changes in section I of the CLD.
Left side represents the preliminary model as presented in questionnaire. Right side represents the model as presented in the workbook, workshop, and the final model. Blue line represents a positive link, indicating a move in the same direction. Red line represents a negative link, indicating a move in different directions. Greyed variables represent shadow variables that are defined elsewhere in the model.
Fig 8
Fig 8. Changes in section II of the CLD.
Left side represents the preliminary model as presented in the questionnaire. Right side represents the model as presented in the workshop and the final model. Blue line represents a positive link, indicating a move in the same direction. Red line represents a negative link, indicating a move in different directions. Greyed variables represent shadow variables that are defined elsewhere in the model.
Fig 9
Fig 9. Food and nutrition knowledge system structure.
Blue line represents a positive link, indicating a move in the same direction. Red line represents a negative link, indicating a move in different directions.
Fig 10
Fig 10. Business perspective system structure.
Blue line represents a positive link, indicating a move in the same direction. Red line represents a negative link, indicating a move in different directions.
Fig 11
Fig 11. Final conceptual model of the food retail environment.
Blue line represents a positive link, indicating a move in the same direction. Red line represents a negative link, indicating a move in different directions. Greyed variables represent shadow variables that are defined elsewhere in the model.
Fig 12
Fig 12. Key feedback loops of the model.
Blue line represents a positive link, indicating a move in the same direction. Red line represents a negative link, indicating a move in different directions. Greyed variables represent shadow variables that are defined elsewhere in the model.

References

    1. Powell LM, Auld MC, Chaloupka FJ, O’Malley PM, Johnston LD. Associations Between Access to Food Stores and Adolescent Body Mass Index. American Journal of Preventive Medicine. 2007;33(4 SUPPL.):301–7. doi: 10.1016/j.amepre.2007.07.007 - DOI - PubMed
    1. Rose D, Richards R. Food store access and household fruit and vegetable use among participants in the US Food Stamp Program. Public Health Nutrition. 2004;7(8):1081–8. doi: 10.1079/PHN2004648 - DOI - PubMed
    1. Wang MC, Kim S, Gonzalez AA, MacLeod KE, Winkleby MA. Socioeconomic and food-related physical characteristics of the neighbourhood environment are associated with body mass index. Journal of Epidemiology and Community Health. 2007;61(6):491–8. doi: 10.1136/jech.2006.051680 - DOI - PMC - PubMed
    1. Richardson A, Ghosh-Dastidar M, Beckman R, Flórez KR, DeSantis A, Collins RL, et al.. Can the introduction of a full-service supermarket in a food desert improve residents’ economic status and health? Annals of Epidemiology. 2017;27(12):771–6. doi: 10.1016/j.annepidem.2017.10.011 - DOI - PMC - PubMed
    1. Bezerra IN, Curioni C, Sichieri R. Association between eating out of home and body weight. Nutrition Reviews. 2012;70(2):65–79. doi: 10.1111/j.1753-4887.2011.00459.x - DOI - PubMed

Substances