

Pooled analysis of routine safety parameters observed in healthy participants at baseline and following placebo administration in early phase clinical studies
- PMID: 38266056
- PMCID: PMC10777607
- DOI: 10.1111/cts.13715
Pooled analysis of routine safety parameters observed in healthy participants at baseline and following placebo administration in early phase clinical studies
Abstract
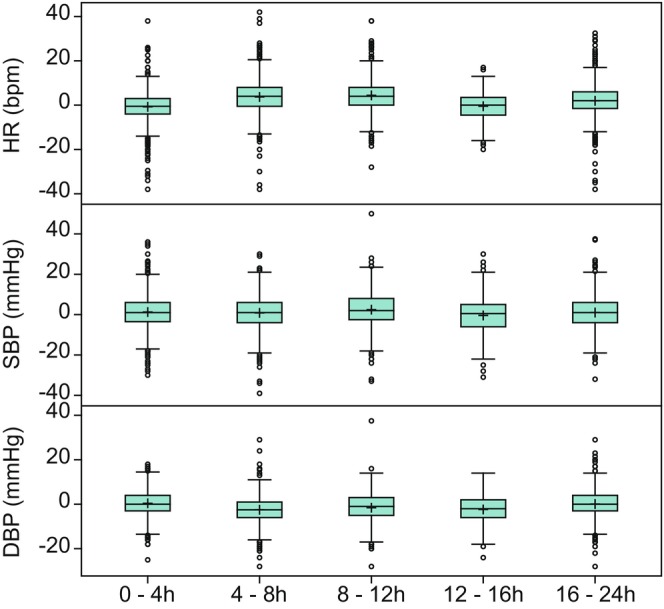
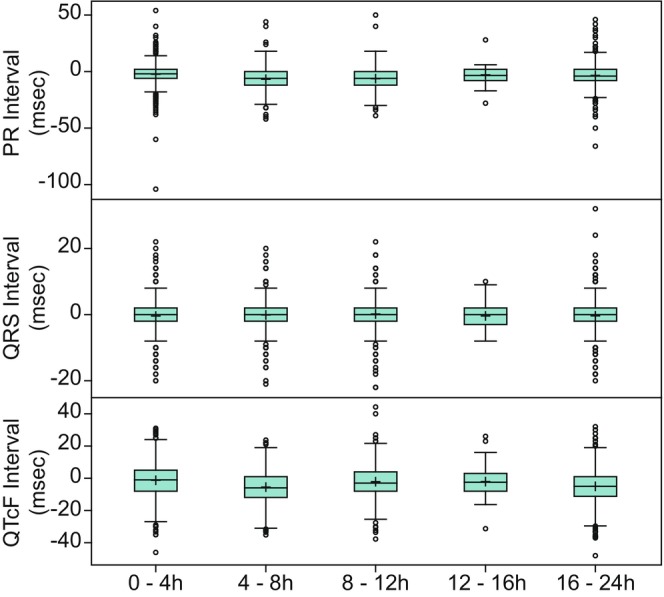
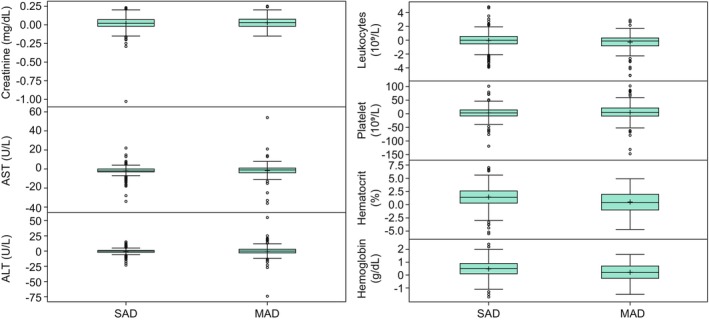
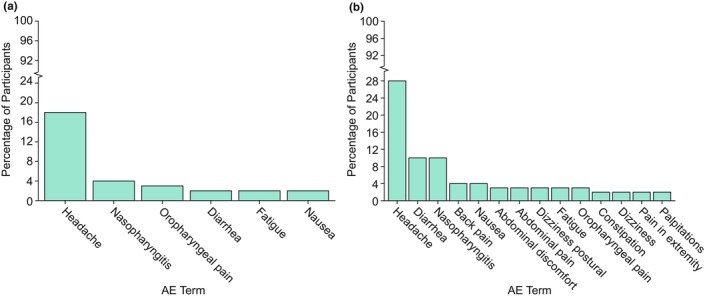
Phase I trials inform on the initial safety profile of a new molecule and impact whether further development is pursued or not. Understanding the effect of non-pharmacological factors on the variability of routine safety parameters could improve decision making in these early clinical trials, helping to separate signals related to the new molecule from background "noise." To understand the impact of non-pharmacological factors on routine safety parameters, we evaluated pooled safety data from over 1000 healthy participants treated with placebo in phase I trials between 2009 and 2018. The phase I participants were predominantly men, less than or equal to 50 years, White, and non-Hispanic; and approximately an equal proportion had body mass index in the normal and overweight/obese range. Following administration of placebo, vital signs, electrocardiogram, and laboratory parameters remained near predose baseline values. Large changes from baseline were observed for many safety parameters, but these occurred in a relatively small number of participants. At least one adverse event (AE) occurred in 49.7% of participants receiving placebo in single ascending dose (SAD) studies and in 72.4% of participants receiving placebo in multiple ascending dose (MAD) studies, with headache being the most commonly reported AE (18.7% in SAD and 28.3% in MAD studies). Overall, these analyses are consistent with non-pharmacological factors having a small impact on routine safety parameters in a phase I trial. The provided supplemental data may be used to contextualize the magnitude and frequency of abnormal safety values and AEs observed in phase I trials.
© 2024 The Authors. Clinical and Translational Science published by Wiley Periodicals LLC on behalf of American Society for Clinical Pharmacology and Therapeutics.
Conflict of interest statement
K.E.D., R.L., L.M., A.K., S.A.S, and G.A.W. are employees of Merck Sharp & Dohme LLC, a subsidiary of Merck & Co., Inc., Rahway, NJ, USA, and may own stock/stock options in Merck & Co., Inc., Rahway, NJ, USA.
Figures
Similar articles
-
Results of two Phase 1, Randomized, Double-blind, Placebo-controlled, Studies (Ascending Single-dose and Multiple-dose Studies) to Determine the Safety, Tolerability, and Pharmacokinetics of Orally Administered LX9211 in Healthy Participants.Clin Ther. 2021 Jun;43(6):1029-1050. doi: 10.1016/j.clinthera.2021.04.014. Epub 2021 Jun 6. Clin Ther. 2021. PMID: 34108079 Clinical Trial.
-
Safety and Pharmacokinetics of HRS-2261, a P2X3 Receptor Antagonist, in Healthy Subjects: A Randomized, Double-Blind, Placebo-Controlled Phase 1 Study.Clin Pharmacokinet. 2024 Mar;63(3):293-302. doi: 10.1007/s40262-023-01330-7. Epub 2024 Jan 10. Clin Pharmacokinet. 2024. PMID: 38198010 Clinical Trial.
-
Safety, pharmacokinetics and pharmacodynamics of branebrutinib (BMS-986195), a covalent, irreversible inhibitor of Bruton's tyrosine kinase: Randomised phase I, placebo-controlled trial in healthy participants.Br J Clin Pharmacol. 2020 Sep;86(9):1849-1859. doi: 10.1111/bcp.14290. Epub 2020 Apr 12. Br J Clin Pharmacol. 2020. PMID: 32198939 Free PMC article. Clinical Trial.
-
Inhibition of Diacylglycerol Acyltransferase 2 Versus Diacylglycerol Acyltransferase 1: Potential Therapeutic Implications of Pharmacology.Clin Ther. 2023 Jan;45(1):55-70. doi: 10.1016/j.clinthera.2022.12.008. Epub 2023 Jan 21. Clin Ther. 2023. PMID: 36690550 Review.
-
Antibiotics for induction and maintenance of remission in Crohn's disease.Cochrane Database Syst Rev. 2019 Feb 7;2(2):CD012730. doi: 10.1002/14651858.CD012730.pub2. Cochrane Database Syst Rev. 2019. PMID: 30731030 Free PMC article.
Cited by
-
Optimized communication during risk disclosure to reduce nocebo headache after lumbar puncture-a study protocol for a randomized controlled clinical trial.Front Psychol. 2025 Feb 26;16:1521978. doi: 10.3389/fpsyg.2025.1521978. eCollection 2025. Front Psychol. 2025. PMID: 40078436 Free PMC article.
References
-
- Sibille M. Selection of healthy volunteers for phase I studies. Fundam Clin Pharmacol. 1990;4(Suppl 2):167s‐176s. - PubMed
-
- Pasqualetti G, Gori G, Blandizzi C, Del Tacca M. Healthy volunteers and early phases of clinical experimentation. Eur J Clin Pharmacol. 2010;66:647‐653. - PubMed
-
- Atkinson AJ Jr. Introduction to clinical pharmacology. In: Atkinson AJ Jr, Huang S‐M, Lertora JJL, Markey SP, eds. Principles of Clinical Pharmacology. 3rd ed. Elsevier Science and Technology; 2012:1‐9.
Publication types
MeSH terms
Grants and funding
LinkOut - more resources
Full Text Sources
Medical
