. 2024 Apr 1;73(4):554-564.
doi: 10.2337/db23-0704.

DNA Methylation-Based Assessment of Cell Composition in Human Pancreas and Islets

Affiliations

DNA Methylation-Based Assessment of Cell Composition in Human Pancreas and Islets

Zeina Drawshy et al. Diabetes. .

Abstract

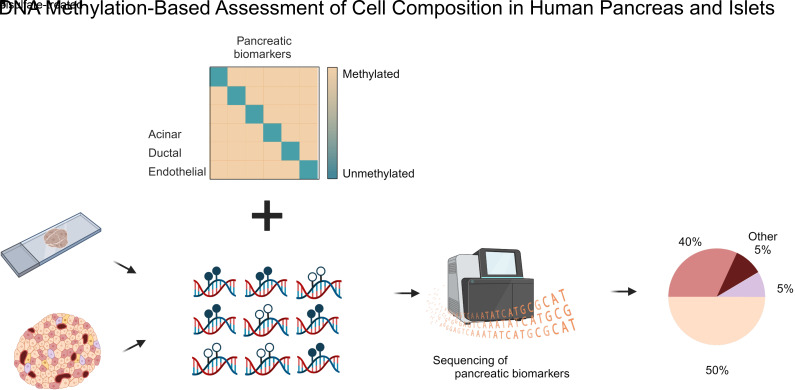
Assessment of pancreas cell type composition is crucial to the understanding of the genesis of diabetes. Current approaches use immunodetection of protein markers, for example, insulin as a marker of β-cells. A major limitation of these methods is that protein content varies in physiological and pathological conditions, complicating the extrapolation to actual cell number. Here, we demonstrate the use of cell type-specific DNA methylation markers for determining the fraction of specific cell types in human islet and pancreas specimens. We identified genomic loci that are uniquely demethylated in specific pancreatic cell types and applied targeted PCR to assess the methylation status of these loci in tissue samples, enabling inference of cell type composition. In islet preparations, normalization of insulin secretion to β-cell DNA revealed similar β-cell function in pre-type 1 diabetes (T1D), T1D, and type 2 diabetes (T2D), which was significantly lower than in donors without diabetes. In histological pancreas specimens from recent-onset T1D, this assay showed β-cell fraction within the normal range, suggesting a significant contribution of β-cell dysfunction. In T2D pancreata, we observed increased α-cell fraction and normal β-cell fraction. Methylation-based analysis provides an accurate molecular alternative to immune detection of cell types in the human pancreas, with utility in the interpretation of insulin secretion assays and the assessment of pancreas cell composition in health and disease.


Conflict of interest statement

Duality of Interest. D.N., J.M., T.K., R.S., B.G., A.K., and Y.D. have filed patents on DNA methylation biomarkers and methods. No other potential conflicts of interest relevant to this article were reported.

Figures

None
Graphical abstract
Figure 1
Figure 1
Pancreas cell type–specific DNA methylation markers. A: Schematic of the human insulin gene, highlighting distinct clusters of CpG sites. Red line indicates the CpG sites targeted by ddPCR. B: A heat map showing the methylation status of each insulin gene CpG cluster in the DNA of pancreas and blood cell types based on our published methylome atlas (13). Only region 5 (within intron 2 of insulin) is unmethylated uniquely in β-cells. C: A heat map showing methylation status of 20 loci that are differentially methylated in the indicated pancreas cell types, as inferred from the methylome atlas. In both B and C, for each sorted cell type, the average was calculated for three to four different donors, except for CD3 (n = 2) and islet endothelium (n = 1). D: Schematic of the method used for targeted analysis of methylation markers on DNA extracted from tissue or from histological sections. E: Specificity of α-cell markers. Bars show the percentage of molecules carrying the α-cell–specific methylation pattern (unmethylated for CCDC73 and PELI2, methylated for PDX1) in DNA from the indicated sources. F: Specificity of the β-cell markers. In both E and F, sorted α-cells, n = 6; sorted β-cells, n = 4; sorted δ-cells, n = 6; sorted acinar cells, n = 5; sorted ductal cells, n = 5; and sorted endothelial cells and leukocytes, n = 1. GJ: Sensitivity and linearity of the assay. α- or β-cell DNA was mixed in the indicated proportions with the non–α- or non–β-fraction of dissociated and sorted islets, and methylation markers were used to determine the percentage of α- or β-cell DNA in each mixture. G and H show assay performance across the entire range of concentrations, and α- or β-cell DNA mixed in leukocytes and HEK-293 DNA in I and J show performance where the cell type of interest comprises just 0–3% of the mixture. Circles and triangles represent the average of all markers used for α- or β-cells, respectively. NK, natural killer.
Figure 2
Figure 2
ddPCR for detection of human β-cell DNA. A: Schematic of the method. One pair of primers is used to amplify a region in the insulin gene after bisulfite treatment. One TaqMan probe (hexachlorofluorescein [HEX] fluorophore) reports on the total number of template molecules (i.e., the number of positive droplets), while another probe (fluorescein amidite [FAM] fluorophore) reports on the number of unmethylated insulin molecules. B: Percentage of β-cell DNA as determined using ddPCR on DNA from the indicated sources. The ddPCR TaqMan probe for β-cell–specific methylation targets the second intron of the human insulin gene and is specific for demethylated CpG sites in positions +1169, +1172, and +1180. Islets, n = 6; sorted β-cells, n = 9; sorted β-cells T2D, n = 3; EndoC, n = 1; sorted α-cells, n = 8; sorted δ-cells, n = 6; sorted acinar cells, n = 4; sorted ductal cells, n = 4; and HEK-293 cells, n = 1. C: Comparison of the performance of β-cell methylation markers using ddPCR and next-generation sequencing (NGS). DNA from sorted human β-cells (0–20 ng) was mixed with DNA from sorted human islet non–β-cells (total DNA 20 ng) from the same donor. Analysis of DNA was performed using NGS targeting three specific β-cell markers, ddPCR targeting three CpG sites within the insulin gene, and NGS targeting the same three CpG sites as ddPCR.
Figure 3
Figure 3
HPAP islet cell composition and normalized β-cell function. A: Total DNA content extracted from the indicated preparations, in nanograms, normalized per 100 islets. B: Insulin content as measured by radioimmunoassay and normalized per 100 islets. C: Insulin content as measured by radioimmunoassay and normalized to β-cell number in 100 islets. D: Glucagon content as measured by radioimmunoassay per 100 islets. E: Glucagon content as measured by radioimmunoassay and normalized to α-cell number in 100 islets. F: Islet cell composition. Shown is the percentage of methylation markers of α-, β-, and acinar cells, cumulatively. Each bar represents the average of all samples in each group. GI: Dynamic insulin secretion from perifused human islet preparations in different conditions, normalized to 100 islets (G), to insulin content in 100 islets (H), and to β-cell number in 100 islets, as determined using methylation markers (I). J: Insulin secretion in high glucose as a function of β-cell number in the same islet preparation. ND Aab−, n = 39–45; ND Aab+, n = 12–15; T2D, n = 25–27; T1D, n = 9–10. Black open circles represent donors who were ND with more than one autoantibody. *P < 0.05. AAM, amino acid mixture.
Figure 4
Figure 4
Quantification of α- and β-cell fractions in DNA extracted from sections of FFPE pancreata. A and B: α-Cell and β-cell DNA, as a function of the percentage of glucagon- and insulin-stained area in the same slide. ND Aab−, n = 24; T2D, n = 15; and T1D, n = 18. In all panels, black triangles represent patients with recently diagnosed T1D. C: Pancreas weight in the indicated donors. ND Aab−, n = 20; T2D, n = 14; and T1D, n = 16. D and E: Percentage of β-cell DNA and insulin-stained area in pancreatic slides from the indicated donors. Black triangles indicate patients with recently diagnosed T1D (0 duration of disease). F and G: β-Cell mass calculated by multiplying pancreas mass by the fraction of β-cells inferred from methylation markers (F) and from insulin immunostaining (G). ND Aab−, n = 20; T2D, n = 14; and T1D, n = 16. H and I: Percentage of α-cell DNA and glucagon-stained area in pancreatic slides from the indicated donors. J and K: α-Cell mass calculated by multiplying pancreas mass by the fraction of α-cells inferred from methylation markers (J) and from glucagon immunostaining (K). *P < 0.05, **P < 0.01, ***P < 0.001, ****P < 0.0001.

References

    1. Campbell-Thompson M, Fu A, Kaddis JS, et al. . Insulitis and β-cell mass in the natural history of type 1 diabetes. Diabetes 2016;65:719–731 - PMC - PubMed
    1. Leete P, Willcox A, Krogvold L, et al. . Differential insulitic profiles determine the extent of β-cell destruction and the age at onset of type 1 diabetes. Diabetes 2016;65:1362–1369 - PubMed
    1. Wang YJ, Traum D, Schug J, et al. ; HPAP Consortium . Multiplexed in situ imaging mass cytometry analysis of the human endocrine pancreas and immune system in type 1 diabetes. Cell Metab 2019;29:769–783.e4 - PMC - PubMed
    1. Aly H, Gottlieb P.. The honeymoon phase: intersection of metabolism and immunology. Curr Opin Endocrinol Diabetes Obes 2009;16:286–292 - PubMed
    1. Butler AE, Janson J, Bonner-Weir S, Ritzel R, Rizza RA, Butler PC.. Beta-cell deficit and increased beta-cell apoptosis in humans with type 2 diabetes. Diabetes 2003;52:102–110 - PubMed

MeSH terms