. 2024 Jan 24:12:RP92916.
doi: 10.7554/eLife.92916.

Yeast eIF2A has a minimal role in translation initiation and uORF-mediated translational control in vivo

Affiliations

Yeast eIF2A has a minimal role in translation initiation and uORF-mediated translational control in vivo

Swati Gaikwad et al. Elife. .

Abstract

Initiating translation of most eukaryotic mRNAs depends on recruitment of methionyl initiator tRNA (Met-tRNAi) in a ternary complex (TC) with GTP-bound eukaryotic initiation factor 2 (eIF2) to the small (40S) ribosomal subunit, forming a 43S preinitiation complex (PIC) that attaches to the mRNA and scans the 5'-untranslated region (5' UTR) for an AUG start codon. Previous studies have implicated mammalian eIF2A in GTP-independent binding of Met-tRNAi to the 40S subunit and its recruitment to specialized mRNAs that do not require scanning, and in initiation at non-AUG start codons, when eIF2 function is attenuated by phosphorylation of its α-subunit during stress. The role of eIF2A in translation in vivo is poorly understood however, and it was unknown whether the conserved ortholog in budding yeast can functionally substitute for eIF2. We performed ribosome profiling of a yeast deletion mutant lacking eIF2A and isogenic wild-type (WT) cells in the presence or absence of eIF2α phosphorylation induced by starvation for amino acids isoleucine and valine. Whereas starvation of WT confers changes in translational efficiencies (TEs) of hundreds of mRNAs, the eIF2AΔ mutation conferred no significant TE reductions for any mRNAs in non-starved cells, and it reduced the TEs of only a small number of transcripts in starved cells containing phosphorylated eIF2α. We found no evidence that eliminating eIF2A altered the translation of mRNAs containing putative internal ribosome entry site (IRES) elements, or harboring uORFs initiated by AUG or near-cognate start codons, in non-starved or starved cells. Thus, very few mRNAs (possibly only one) appear to employ eIF2A for Met-tRNAi recruitment in yeast cells, even when eIF2 function is attenuated by stress.

Keywords: IRES; S. cerevisiae; eIF2; eIF2A; genetics; genomics; translation; uORF; yeast.


Conflict of interest statement

SG, FG, HZ No competing interests declared, AH Reviewing editor, eLife

Figures
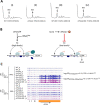
Figure 1.
Figure 1.. Elimination of eIF2A has no effect on bulk protein synthesis in the presence or absence of amino acid starvation.
(A) Polysome profiles of wild-type (WT) strain (BY4741) and eIF2AΔ mutant (F2247) untreated (iii) or treated with sulfometuron methyl (SM) (iiiiv). For (iii), cells were cultured in SC medium at 30°C to log-phase and treated with 50 μg/mL of cycloheximide 5 min prior to harvesting. For (iiiiv), cells were cultured in SC medium lacking Ile/Val and treated with 1 µg/mL of SM for 20 min before addition of cycloheximide. Cell extracts were resolved by sedimentation through sucrose density gradients and scanned continuously at 260 nm during fractionation. The plots show the A260 measured across the gradient with the top of the gradient on the left. (B) Schema of translational control of GCN4 mRNA, wherein translation of the main coding sequences (CDS) is induced by phosphorylation of eIF2α through a specialized ‘delayed reinitiation’ process mediated by four short upstream open-reading frames (uORFs). (See text for details.) (C) Genome browser view of ribosome profiling data for GCN4 mRNA. Tracks display RPF or mRNA reads mapped across the transcription unit, with the scales given in rpkm (reads per kilobase of transcript per million mapped reads). Data are presented for WT (blue) and eIF2∆ cells (purple) with or without SM treatment, as indicated. Each genotype/treatment includes two biological replicates, designated _a and _b. The main CDS is shown schematically in orange below the tracks and the four uORFs are in gray. The calculated values for log2∆TEWT+SM/WT and log2∆TEeIF2A∆+SM/eIF2A∆+SM and the respective false discovery rates (FDRs) are shown on the right.
Figure 1—figure supplement 1.
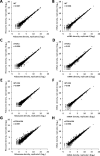
Figure 1—figure supplement 1.. High reproducibility between biological replicates of ribosome footprint profiling and RNA-seq analyses.
(A–H) Scatterplots depict the RPF (A, C, E, G) or mRNA (B, D, F, H) read densities for all expressed mRNAs across biological replicates of the wild-type (WT) (A, B), the eIF2AΔ mutant (C, D), sulfometuron methyl (SM)-treated WT (E, F), and SM-treated eIF2AΔ mutant (G, H). The read densities were calculated by mapping the reads to the coding sequences (CDS) of each gene and expressed as reads per million mapped reads (RPM) in individual libraries of biological replicates. The Pearson’s coefficient (r) is indicated in each plot, quantifying the degree of correlation between the replicate datasets.
Figure 2.
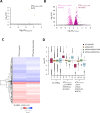
Figure 2.. eIF2A is not critical for translation of any individual mRNAs in non-starved cells and has little impact on the reprogramming of translational efficiencies (TEs) conferred by amino acid starvation.
(A) Volcano plot depicting the log2 ratios of TEs in eIF2AΔ versus wild-type (WT) cells (log2∆TEeIF2A∆/WT values) for each mRNA (x-axis) versus negative log10 of the false discovery rate (FDR) (y-axis) determined by DESeq2 analysis of ribosome profiling data for the 5340 mRNAs with evidence of translation. Genes showing a significant increase in TE in eIF2AΔ versus WT cells at FDR < 0.25 (∆TEeIF2A∆+SM/WT_up) are plotted in orange circles. The dotted line marks the 25% FDR threshold, below which all other 5337 mRNAs are plotted in gray. (B) Volcano plot as in (A) showing the log2 ratios of TEs in WT+ sulfometuron methyl (SM) cells versus WT cells (log2∆TEWT+SM/WT values) for the 5441 mRNAs with evidence of translation. The dotted line marks the 1% FDR threshold. Genes showing a significant increase (∆TEeIF2A∆+SM/WT_up) or decrease (∆TEWT+SM/WT_down) in TE in WT+SM versus WT cells at FDR < 0.01 are plotted in magenta and pink circles, respectively. (C) Hierarchical clustering analysis of log2∆TE values for the 1884 mRNAs (arrayed from top to bottom) that exhibit significant TE decreases or increases in SM-treated versus untreated WT cells at FDR < 0.01 (defined in (B)) conferred by SM treatment of WT cells (column 1) or SM treatment of eIF2AΔ cells (column 2), with the log2ΔTE values represented on a color scale ranging from 4 (dark blue) to –4 (dark red). The Pearson coefficient (r) and corresponding p-value for the correlation between log2∆TE values in the two columns are indicated below. (D) Notched box plots of log2ΔTE values for the indicated mutant/condition for all mRNAs (columns 1–4) or for the indicated mRNA groups identified in (B). The y-axis scale was expanded by excluding a few outliers from the plots.
Figure 2—figure supplement 1.
Figure 2—figure supplement 1.. Relative translational efficiency (TE) changes evoked by increased eIF2α phosphorylation in cells lacking eIF2A are broadly similar to relative TE changes conferred by increased eIF2α phosphorylation in wild-type (WT) cells.
(A) Volcano plot as in Figure 2A showing the log2 ratios of TEs in sulfometuron methyl (SM)-treated eIF2A∆ versus untreated eIF2AΔ cells (∆TEeIF2A∆+SM/eIF2A∆ values) for the 5426 mRNAs with evidence of translation. The dotted line marks the 1% false discovery rate (FDR) threshold. Genes showing a significant increase (∆TEeIF2A∆+SM/eIF2A∆_up) or decrease (∆TEeIF2A∆+SM/eIF2A∆_down) in TE in SM-treated eIF2AΔ versus eIF2AΔ mutant cells at FDR < 0.05 are plotted in dark and light blue circles, respectively. (B) Proportional Venn diagram showing overlap between the 1884 mRNAs identified in Figure 2B and 786 mRNAs identified in (A).
Figure 3.
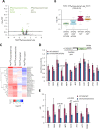
Figure 3.. Examination of a small group of mRNAs showing evidence of a conditional requirement for eIF2A when eIF2 is impaired.
(A) Volcano plot as in Figure 2A showing the log2 ratios of translational efficiencies (TEs) in eIF2AΔ cells treated with sulfometuron methyl (SM) versus wild-type (WT) cells treated with SM (log2∆TEeIF2A∆+SM/WT+SM values) for the 5482 mRNAs with evidence of translation. The dotted line marks the 25% false discovery rate (FDR) threshold. Genes exhibiting a significant increase (∆TEeIF2A∆+SM/WT+SM_up) or decrease (∆TEeIF2A∆+SM/WT+SM_down) at FDR < 0.25 are plotted in dark or light green circles, respectively. (B) Notched box plots of log2ΔTE values for the indicated mutant/condition for the 32 mRNAs in the group ∆TEeIF2A∆+SM/WT+SM_down defined in (A). The y-axis scale was expanded by excluding a few outliers from the plots. Statistical significance determined using the Mann–Whitney U test is indicated for the changes in column 4 compared to the changes observed for all mRNAs. (C) Hierarchical clustering analysis of log2∆TE values for the 32 mRNAs (arrayed from top to bottom) in the group defined in (A) for the four comparisons listed across the top, with log2ΔTE values represented on a color scale ranging from 4 (dark blue) to –4 (dark red). The systematic gene names are listed for all 32 mRNAs, and the common name is indicated for those genes subjected to LUC reporter analysis below. Genes marked with ‘#’s display the pattern of TE changes consistent with conditional stimulation by eIF2A when eIF2 function is reduced by phosphorylation. Only 17 of the 32 transcripts (marked with ‘#’) displayed the diagnostic pattern of an appreciable reduction in TE both on elimination of eIF2A in SM-treated cells and on SM treatment of cells lacking eIF2A (red or pink hues in columns 1–2) but either a lesser reduction, no change, or increase in TE on SM treatment of WT cells and on elimination of eIF2A from untreated cells (light pink, white or blue hues in columns 3–4). (D) Expression of LUC reporters in different strains/conditions constructed for selected candidate genes analyzed in (C). The schematic depicts reporter construct design wherein the native gene promoter, 5' UTR, and first 20 codons of the coding sequences (CDS) are fused to firefly luciferase coding sequences (F.LUC), followed by a modified RPL41A 3' UTR. Plasmid-borne reporter constructs were introduced into the WT and eIF2AΔ strains and three independent transformants were cultured in SC-Ura medium at 30°C to log phase (-SM) or treated with SM at 1 μg/mL after log-phase growth in SC-Ura/Ile/Val and cultured for an additional 6 hr before harvesting. Luciferase activities were quantified in whole-cell extracts (WCEs), normalized to total protein, and reported as fold change in relative light units (RLUs) per mg of protein, as means (± SEM) determined from the replicate transformants. The changes in luciferase activity plotted for each of the two comparisons depicted in the histogram were calculated as ratios of the appropriate mean activities. Results of Student’s t-tests of the differences in fold changes between the indicated mutations/conditions are indicated. (E) Determination of relative TEs for the native mRNAs of selected candidate genes analyzed in (C, D). Cells were cultured in the four conditions described in (D), WCEs were resolved by sedimentation through 10–50% sucrose gradients, and fractions were collected while scanning at 260 nm. Total RNA was extracted from 80S and polysome fractions, and the abundance of each target mRNA was quantified in each fraction by qRT-PCR, and normalized for (i) the amounts of 18S rRNA quantified for the same fractions and (ii) for the total amounts of monosomes/polysomes recovered in the gradient. The resulting normalized amounts of mRNA in each fraction were multiplied by the number of ribosomes per mRNA in that fraction, summed across all fractions, and divided by the input amount of mRNA in the WCEs, normalized to ACT1 mRNA, to yield the TE for that mRNA in each condition. (See ‘Materials and methods’ for further details.) The changes in TE conferred by SM treatment of WT or eIF2AΔ cells were calculated for each replicate culture, untreated or SM-treated, and the mean TE changes with standard error of the means (SEMs) were plotted for the indicated comparisons. The results of Student’s t-tests of the differences in mean TE changes are indicated.
Figure 3—figure supplement 1.
Figure 3—figure supplement 1.. Representative separation of polysomes by sedimentation through a sucrose density gradient in the experiment depicted in Figure 3E.
The A260 values were determined continuously during fractionation of the gradient. Fractions pooled for isolation of RNA from 80S monosome or the various polysomal species are indicated by boxes.
Figure 4.
Figure 4.. eIF2A has little or no effect on the translation of three mRNAs reported to contain internal ribosome entry sites (IRESs).
Genome browser views of RPF and RNA reads from ribosome profiling data for (A) URE2 mRNA, (B) GIC1 mRNA, and (C) PAB1 mRNA presented as in Figure 1C. The calculated values for log2∆TEeIF2A∆/WT and log2∆TEeIF2A∆+SM/WT+SM with the respective false discovery rates (FDRs) are shown on the right. The scale is shown on the left. The region containing the URE2 IRES is enclosed in a dotted box, with the AUG start codon highlighted in red. Locations of the GIC1 and PAB1 IRESs have not been defined.
Figure 5.
Figure 5.. eIF2A plays little or no role in upstream open-reading frame (uORF)-mediated translational control of CPA1 or YAP2/CAD1 mRNA.
Genome browser views of RPF and RNA reads from ribosome profiling data for (A) CPA1 mRNA and (B) YAP2/CAD1 mRNA presented as in Figures 1 and 4. Coding sequences (CDS) and uORFs are represented in orange and gray rectangles, respectively.
Figure 6.
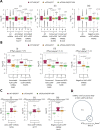
Figure 6.. Minimal effects of eliminating eIF2A on translation of mRNAs harboring translated upstream open-reading frames (uORFs).
(A) Notched box plots of log2ΔTE values for all mRNAs (for which translational efficiencies (TEs) could be determined from our ribosome profiling data) containing annotated AUG- or NCC-uORFs (i), conserved AUG- or NCC-uORFs (ii), or single functional inhibitory AUG-uORFs (iii), conferred by sulfometuron methyl (SM) treatment of wild-type (WT) cells (maroon), by the eIF2AΔ mutation in untreated cells (orange), or by the eIF2AΔ mutation in SM-treated cells (green). Statistical significance determined using the Mann–Whitney U test is indicated for selective comparisons of changes observed for the indicated groups in comparison to the changes for all mRNAs. A few outliers were omitted from the plots to expand the y-axis scale. (B) Notched box plots as in (A) for the subsets of the same mRNA groups analyzed there exhibiting >1.41-fold increases in TE in SM-treated versus untreated WT cells. A few outliers were omitted from the plots to expand the y-axis scale. Statistical significance determined as in (A). (C) Notched box plots as in (A, B) for the subsets of the mRNA groups analyzed there exhibiting >1.41-fold decreases in TE in SM-treated eIF2AΔ versus SM-treated WT cells. A few outliers were omitted from the plots to expand the y-axis scale. Statistical significance determined as in (A). (D) Proportional Venn diagram showing overlap between the 17 mRNAs identified in Figure 3A showing evidence for a conditional requirement for eIF2A when eIF2 function is reduced by SM (marked in Figure 3A with ‘#’s) and the 514 mRNAs bearing functional AUG or NCC-uORFs.
Figure 6—figure supplement 1.
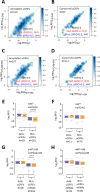
Figure 6—figure supplement 1.. eIF2A plays a minimal in regulating upstream open-reading frame (uORF)-mediated translation.
(A, B) Smoothed scatterplots displaying the relationship between log2RROWT (x-axis) and log2RROeIF2A∆ (y-axis) for all mRNAs containing annotated AUG- or NCC-uORFs (A) or evolutionarily conserved AUG- or NCC-uORFs (B) in wild-type (WT) versus eIF2AΔ cells without sulfometuron methyl (SM) treatment. No mRNAs showed ≥2-fold changes in RRO in the eIF2AΔ mutant versus WT cells at false discovery rate (FDR) < 0.5. (C, D) Smoothed scatterplots displaying the relationship between log2RROWT+SM (x-axis) versus log2RROeIF2A∆+SM (y-axis) for the same mRNAs analyzed in (A, B) but in the presence of SM. Again, no mRNAs showed ≥2-fold changes in RRO in the eIF2AΔ mutant versus WT cells at FDR < 0.5. (E–H) Notched box plot displaying log2RRO values for all mRNAs containing annotated AUG- or NCC-uORFs (E, G) or evolutionarily conserved AUG- or NCC-uORFs (F, H) in untreated WT and eIF2AΔ mutant (E, F) or SM-treated WT and eIF2AΔ mutant (G, H). The y-axis scale was expanded by omitting a few outliers. Statistical significance determined using the Mann–Whitney U test is shown for the bracketed comparisons in panels (E, G).
Figure 6—figure supplement 2.
Figure 6—figure supplement 2.. Lack of genetic interaction between eIF2A and the purine salvage pathway.
(A, B) Cell spotting assays were performed on synthetic complete (SC) plates (A) or synthetic minimal (SD) plates (B) to assess the growth of wild-type (WT), eIF2AΔ, fcy2Δ, and eIF2AΔ fcy2Δ strains. Ten-fold serial dilutions of saturated cultures were applied to SC or SD plates supplemented with the indicated concentrations of adenine and incubated at 30°C for 2 d. (C) WT and eIF2AΔ strains were transformed with the indicated lacZ reporter plasmids. Transformants were grown in SC-Ura (containing 0.015 mM adenine) to saturation and diluted into the same (fresh) medium and grown for 6 hr to A600 of ∼1.0. Whole-cell extracts (WCEs) were prepared and assayed for β-galactosidase activities, expressed in units of nmol of ONPG cleaved per mg of protein per min. The results represent the fold change of means (± SEMs) of activities (eIF2AΔ/WT) calculated from three independent transformants of each strain. The IMD2-lacZ reporter contains IMD2 coding sequences along with 1186 bp of 5’ non-coding sequences while the IMD3-lacZ reporter contains IMD3 coding sequences and 555 bp of 5’ non-coding DNA.
Figure 7.
Figure 7.. eIF2A plays no major role in stimulating translation elongation for particular tripeptide motifs.
(A) Scatterplot of average pause scores for 8006 tripeptide motifs, comparing the two biological replicates of ribosome profiling data for eIF2A∆ versus wild-type (WT) cells. Each dot on the plot represents a tripeptide motif. Pause scores were computed using a shift value of 18 nt from the 3′-end of the footprint, positioning the first codon of the tripeptide motif in the E site. (B) Scatterplot of average pause scores for 6267 tripeptide motifs, comparing the two biological replicates of sulfometuron methyl (SM)-treated versus untreated WT cells. All 351 detected motifs with valine codons in the A site are highlighted in red. Pause scores were computed as in (A).

Update of

Similar articles

Cited by

References

    1. Adams SL, Safer B, Anderson WF, Merrick WC. Eukaryotic initiation complex formation: evidence for two distinct pathways. Journal of Biological Chemistry. 1975;250:9083–9089. doi: 10.1016/S0021-9258(19)40696-0. - DOI - PubMed
    1. Anderson R, Agarwal A, Ghosh A, Guan B-J, Casteel J, Dvorina N, Baldwin WM, Mazumder B, Nazarko TY, Merrick WC, Buchner DA, Hatzoglou M, Kondratov RV, Komar AA. eIF2A-knockout mice reveal decreased life span and metabolic syndrome. FASEB Journal. 2021;35:e21990. doi: 10.1096/fj.202101105R. - DOI - PMC - PubMed
    1. Costanzo M, VanderSluis B, Koch EN, Baryshnikova A, Pons C, Tan G, Wang W, Usaj M, Hanchard J, Lee SD, Pelechano V, Styles EB, Billmann M, van Leeuwen J, van Dyk N, Lin ZY, Kuzmin E, Nelson J, Piotrowski JS, Srikumar T, Bahr S, Chen Y, Deshpande R, Kurat CF, Li SC, Li Z, Usaj MM, Okada H, Pascoe N, San Luis BJ, Sharifpoor S, Shuteriqi E, Simpkins SW, Snider J, Suresh HG, Tan Y, Zhu H, Malod-Dognin N, Janjic V, Przulj N, Troyanskaya OG, Stagljar I, Xia T, Ohya Y, Gingras AC, Raught B, Boutros M, Steinmetz LM, Moore CL, Rosebrock AP, Caudy AA, Myers CL, Andrews B, Boone C. A global genetic interaction network maps A wiring diagram of cellular function. Science. 2016;353:aaf1420. doi: 10.1126/science.aaf1420. - DOI - PMC - PubMed
    1. Delbecq P, Werner M, Feller A, Filipkowski RK, Messenguy F, Piérard A. A segment of mRNA encoding the leader peptide of the CPA1 gene confers repression by arginine on A heterologous yeast gene transcript. Molecular and Cellular Biology. 1994;14:2378–2390. doi: 10.1128/mcb.14.4.2378-2390.1994. - DOI - PMC - PubMed
    1. Dever TE, Green R. The elongation, termination, and recycling phases of translation in eukaryotes. Cold Spring Harbor Perspectives in Biology. 2012;4:a013706. doi: 10.1101/cshperspect.a013706. - DOI - PMC - PubMed

Associated data