. 2024 Apr 3;112(7):1117-1132.e9.
doi: 10.1016/j.neuron.2023.12.020. Epub 2024 Jan 23.

Direct neuronal reprogramming of NDUFS4 patient cells identifies the unfolded protein response as a novel general reprogramming hurdle

Affiliations

Direct neuronal reprogramming of NDUFS4 patient cells identifies the unfolded protein response as a novel general reprogramming hurdle

Giovanna Sonsalla et al. Neuron. .

Abstract

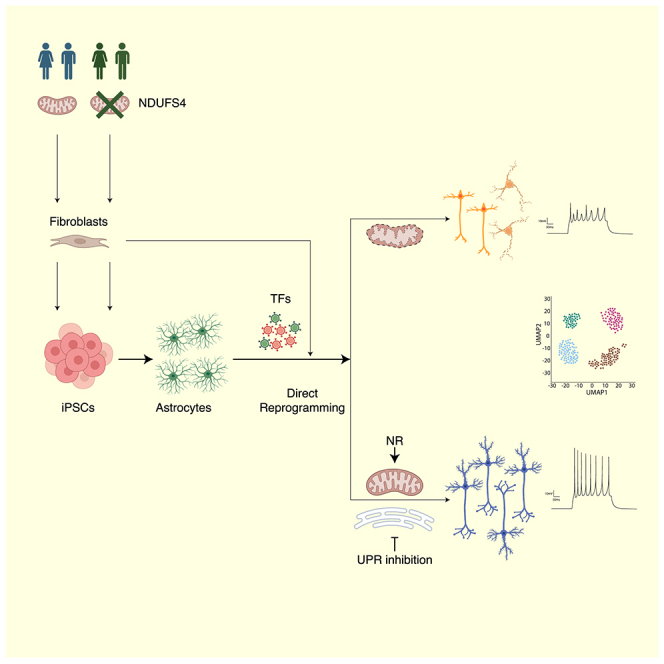
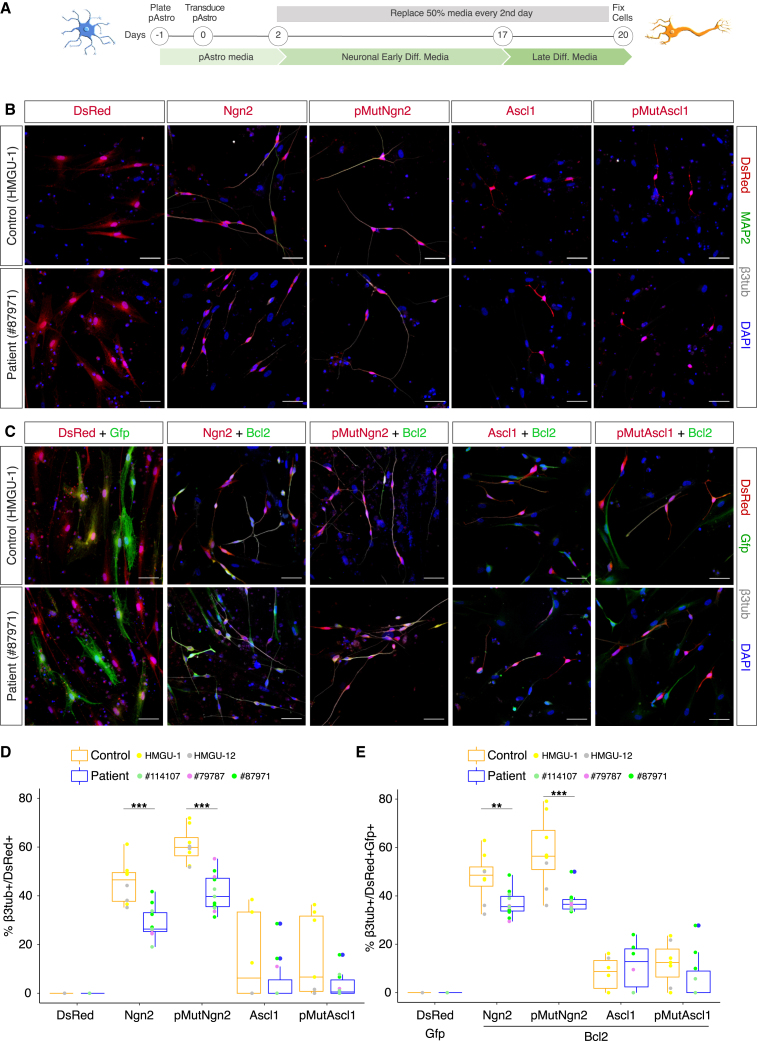
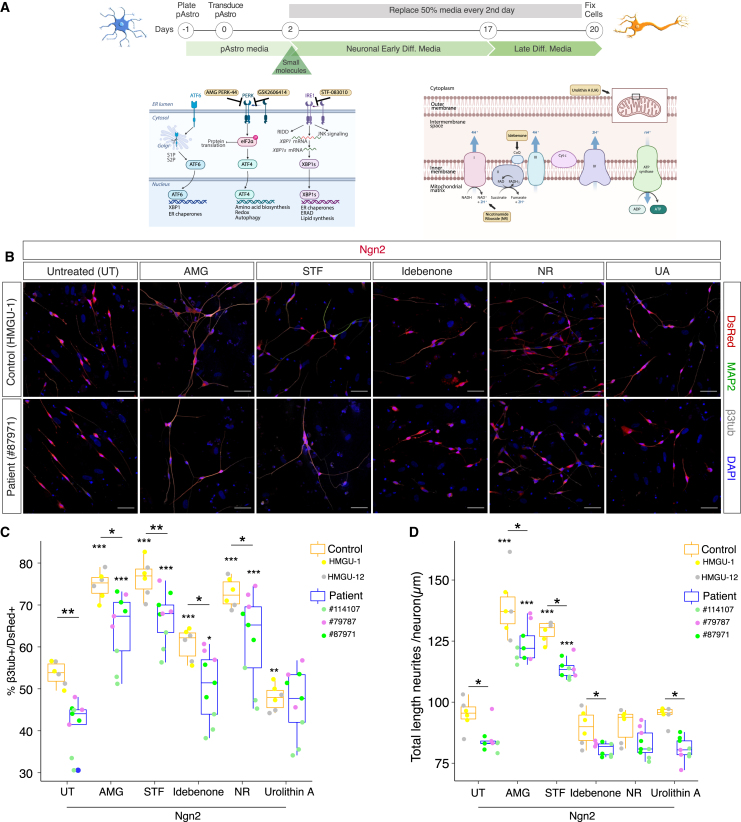
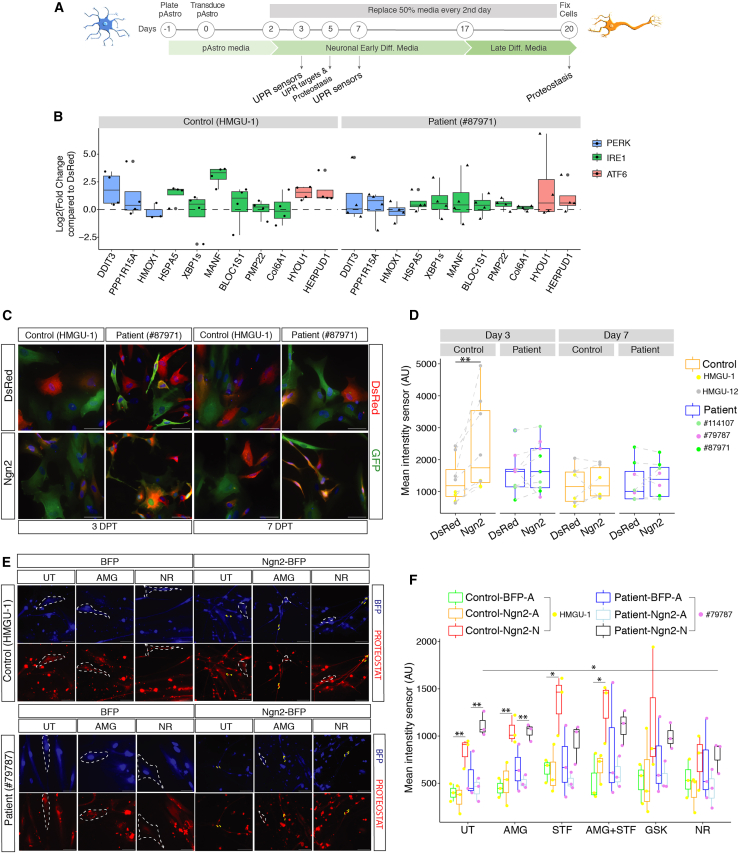
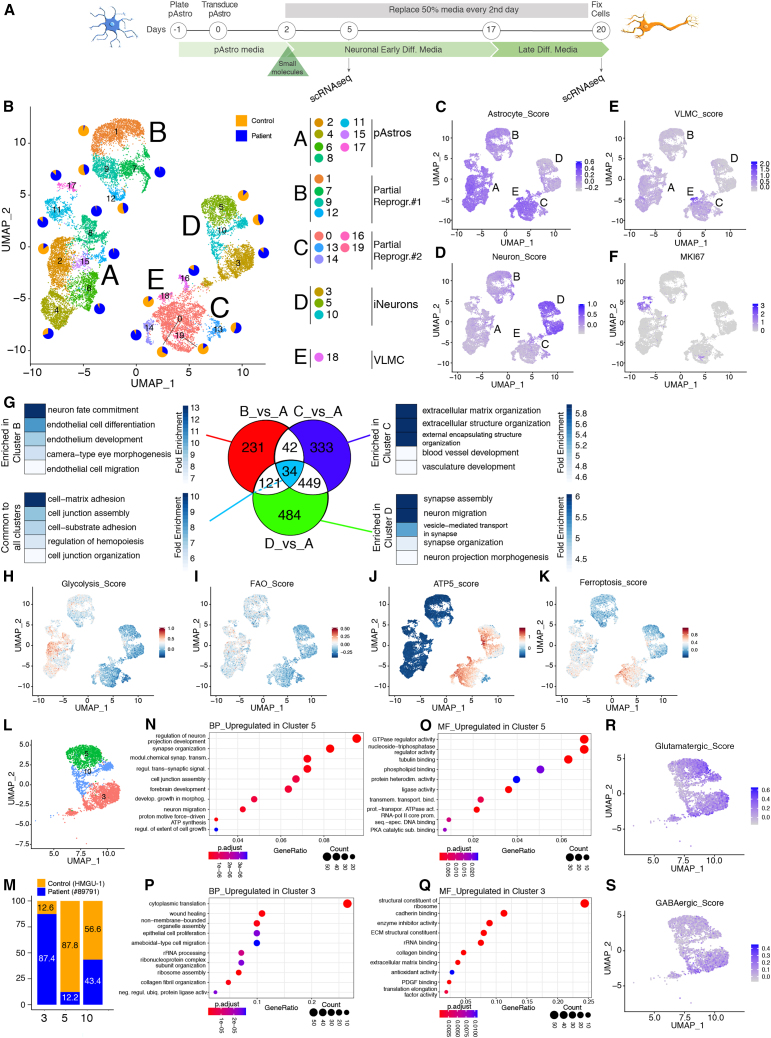
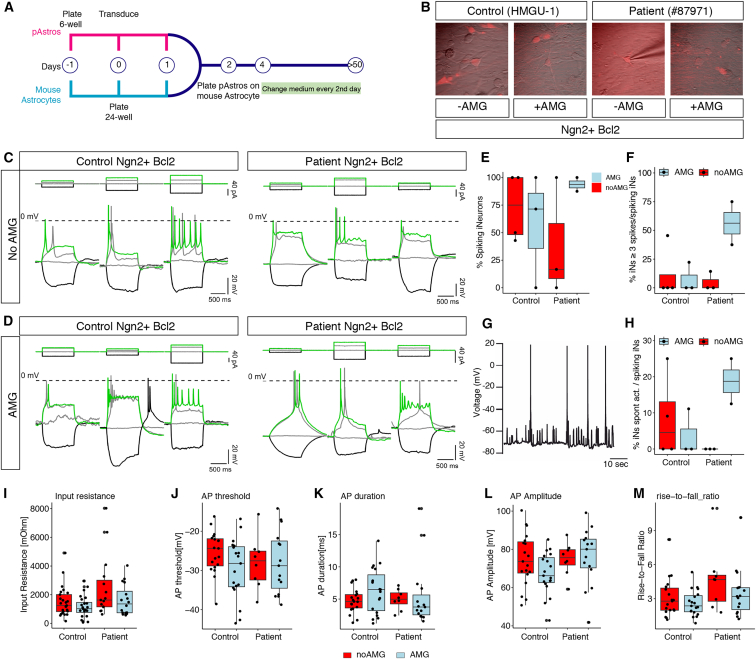
Mitochondria account for essential cellular pathways, from ATP production to nucleotide metabolism, and their deficits lead to neurological disorders and contribute to the onset of age-related diseases. Direct neuronal reprogramming aims at replacing neurons lost in such conditions, but very little is known about the impact of mitochondrial dysfunction on the direct reprogramming of human cells. Here, we explore the effects of mitochondrial dysfunction on the neuronal reprogramming of induced pluripotent stem cell (iPSC)-derived astrocytes carrying mutations in the NDUFS4 gene, important for Complex I and associated with Leigh syndrome. This led to the identification of the unfolded protein response as a major hurdle in the direct neuronal conversion of not only astrocytes and fibroblasts from patients but also control human astrocytes and fibroblasts. Its transient inhibition potently improves reprogramming by influencing the mitochondria-endoplasmic-reticulum-stress-mediated pathways. Taken together, disease modeling using patient cells unraveled novel general hurdles and ways to overcome these in human astrocyte-to-neuron reprogramming.

Keywords: Leigh syndrome; astrocytes; direct neuronal reprogramming; mitochondria; unfolded protein response.


Conflict of interest statement

Declaration of interests M. Götz is member of the advisory board of Neuron.

Figures

None
Graphical abstract
Figure 1
Figure 1
NDUFS4-patient pAstros exhibit impaired neuronal reprogramming (A) Scheme of direct neuronal reprogramming. (B and C) Micrographs depicting control (HMGU-1) and patient (#87971) pAstros transduced with the indicated transcription factors (B, single factor; C, two factors) at 20 DPT. Scale bars, 50 μm. (D and E) Boxplots of reprogramming efficiency of control and patient pAstros with different factors (D, single factor; E, two factors). Efficiency is defined as the ratio of βIII-tubulin+/dsRed+ to dsRed+ cells. Data are shown as median ± IQR. p ≤ 0.05, ∗∗p ≤ 0.01. n = 3–4 independent culture batches per line, 2 lines per control, and 3 lines per patient.
Figure 2
Figure 2
Pharmacological treatments improve direct neuronal reprogramming of pAstros (A) Scheme of direct neuronal reprogramming and the site of action of small molecules. Images adapted from Biorender.com. (B) Micrographs of control (HMGU-1) and patient (#87971) pAstros transduced with Ngn2 alone (untreated, UT) or in combination with AMG-PERK 44 (AMG), STF-083010 (STF), idebenone, nicotinamide riboside (NR), or urolithin A (UA) treatment at 20 DPT. Scale bars, 50 μm. (C and D) Boxplots of reprogramming efficiency (C) and neurite length (D) of control and patient pAstros treated with the indicated small molecules. Asterisks indicate statistical significance of the conversion between untreated and small molecules samples within the same genotype; asterisks above bar indicate the significance of the reprogramming between control and patient pAstros within the same treatment. Data are shown as median ± IQR. p ≤ 0.05, ∗∗∗p ≤ 0.001. n = 3 independent culture batches per line; 2 lines per controls (HMGU-1 and HMGU-12) and 3 lines per patient (#79787, #87971, #114107).
Figure 3
Figure 3
UPR activation and proteostasis during direct neuronal reprogramming of pAstros (A) Experimental design. (B) Boxplots depicting the expression of UPR targets in control (left) and patient (right) pAstros at 5 DPT as measured by RT-qPCR. Data are shown as the fold-change relative to dsRed and normalized to glyceraldehyde-3-phosphate dehydrogenase (GAPDH). Data are shown as median ± IQR. Each dot represents an independent biological replicate. n = 3–4 independent experiments. (C) Micrographs of control and patient pAstros transduced with ATF4-YFP sensor and dsRed or Ngn2-dsRed at 3 DPT (left) and 7 DPT (right). Scale bars, 50 μm. (D) Boxplots depicting mean fluorescent intensity of ATF4-YFP sensor at 3 DPT (left) and 7 DPT (right) in control and patient pAstros. Data are shown as median median ± IQR. n = 3–5 independent batch cultures (2 lines per control and 3 lines per patient). ∗∗p ≤ 0.01. (E) Micrographs of control and patient pAstros transduced with BFP or Ngn2-BFP with aggresomes labeled with PROTEOSTAT dye at 20 DPT. Scale bars, 50 μm. (F) Boxplots depicting aggresome detection in control and patient pAstros in different experimental conditions at 20 DPT. Cells are subdivided into Ngn2-A (astrocyte-like) and Ngn2-N (neuronal). Data are shown as median ± IQR. p ≤ 0.05; ∗∗p ≤ 0.01. n = 3 independent biological replicates per line.
Figure 4
Figure 4
scRNA-seq analysis of pAstros undergoing Ngn2-mediated direct conversion (A) Experimental design. (B) UMAP projection of cells colored by clusters, after combining scRNA-seq of control (HMGU-1) and patient (#87971) cells transduced with dsRed or Ngn2, untreated or treated with AMG, and collected at 5 or 20 DPT. Pie charts show the proportion of control (orange) and patient (blue) within each subcluster. (C–F) UMAP projection of cells colored by the Astrocyte_score (C), Neuron-score (D), VLMC_score (E), and MKI67 (F). (G) Venn diagram depicting genes unique to each cluster, common to each cluster comparison, and the top 5 GO terms associated. (H–K) UMAP projections of cells colored for Glycolysis_score (H), FAO_score (I), ATP5_score (J), and FerroptosisMarker_score (K). (L and M) UMAP projection of cells within the main cluster D (L) and proportion of cluster composition based on the genotype (M). (N–Q) GO analysis on biological processes (BP) and molecular function (MF) of genes upregulated (log2FC > 1, padj = 0.01) in cluster 5 compared with cluster 3 (N and O) and vice versa (P and Q). (R and S) UMAP projection of cells colored by glutamatergic score (R) or GABAergic score (S).
Figure 5
Figure 5
Electrophysiological analysis of control or NDUFS-4 patient iNs upon AMG treatment (A) Scheme for electrophysiological analysis of iNs. (B) Micrographs depicting the morphology of iNs before patch-clamp. (C and D) Representative traces of action potential upon increasing step depolarization in control (left) or patient (right) reprogrammed neurons following AMG treatment (D) or without (C). (E and F) Boxplots depicting the proportion of iNs spiking at least 1 (E) or 3 (F) action potentials in the indicated conditions. Each dot represents an independent batch culture. Control Ngn2+Bcl2_noAMG: n = 25 cells; control Ngn2+Bcl2_AMG: n = 25; patient Ngn2+Bcl2_noAMG: n = 15; control Ngn2+Bcl2_AMG: n = 16. (G) Example of spontaneous synaptic activity recorded from a patient-Ngn2-Bcl2-AMG-treated neuron. (H) Boxplot depicting the proportion of iNs showing a spontaneous synaptic activity. Each dot represents a biological replicate. Same number of cells as in (E) and (F). (I–M) Boxplots showing input resistance (I), action potential threshold (J), action potential duration (K), action potential amplitude (L), and rise-to-fall ratio (M) in different conditions. Each dot represents one cell. Same number of cells as in (E) and (F).

References

    1. Cruz-Haces M., Tang J., Acosta G., Fernandez J., Shi R. Pathological correlations between traumatic brain injury and chronic neurodegenerative diseases. Transl. Neurodegener. 2017;6:20. - PMC - PubMed
    1. Stanga S., Caretto A., Boido M., Vercelli A. Mitochondrial Dysfunctions: A Red Thread across Neurodegenerative Diseases. Int. J. Mol. Sci. 2020;21:3719. - PMC - PubMed
    1. Watts M.E., Pocock R., Claudianos C. Brain Energy and Oxygen Metabolism: Emerging Role in Normal Function and Disease. Front. Mol. Neurosci. 2018;11:216. - PMC - PubMed
    1. Gascón S., Murenu E., Masserdotti G., Ortega F., Russo G.L., Petrik D., Deshpande A., Heinrich C., Karow M., Robertson S.P., et al. Identification and Successful Negotiation of a Metabolic Checkpoint in Direct Neuronal Reprogramming. Cell Stem Cell. 2016;18:396–409. - PubMed
    1. Russo G.L., Sonsalla G., Natarajan P., Breunig C.T., Bulli G., Merl-Pham J., Schmitt S., Giehrl-Schwab J., Giesert F., Jastroch M., et al. CRISPR-Mediated Induction of Neuron-Enriched Mitochondrial Proteins Boosts Direct Glia-to-Neuron Conversion. Cell Stem Cell. 2021;28:524–534.e7. - PMC - PubMed

MeSH terms

Substances