. 2024 Apr 18;31(4):669-682.e7.
doi: 10.1016/j.chembiol.2023.12.020. Epub 2024 Jan 23.

Beyond antibiotic resistance: The whiB7 transcription factor coordinates an adaptive response to alanine starvation in mycobacteria

Affiliations

Beyond antibiotic resistance: The whiB7 transcription factor coordinates an adaptive response to alanine starvation in mycobacteria

Nicholas C Poulton et al. Cell Chem Biol. .

Abstract

Pathogenic mycobacteria are a significant cause of morbidity and mortality worldwide. The conserved whiB7 stress response reduces the effectiveness of antibiotic therapy by activating several intrinsic antibiotic resistance mechanisms. Despite our comprehensive biochemical understanding of WhiB7, the complex set of signals that induce whiB7 expression remain less clear. We employed a reporter-based, genome-wide CRISPRi epistasis screen to identify a diverse set of 150 mycobacterial genes whose inhibition results in constitutive whiB7 expression. We show that whiB7 expression is determined by the amino acid composition of the 5' regulatory uORF, thereby allowing whiB7 to sense amino acid starvation. Although deprivation of many amino acids can induce whiB7, whiB7 specifically coordinates an adaptive response to alanine starvation by engaging in a feedback loop with the alanine biosynthetic enzyme, aspC. These findings describe a metabolic function for whiB7 and help explain its evolutionary conservation across mycobacterial species occupying diverse ecological niches.

Keywords: CRISPRi; WhiB7; amino acids; antibiotics; mycobacteria; stress response; translation; tuberculosis.


Conflict of interest statement

Declaration of interests The authors declare no competing interests.

Figures
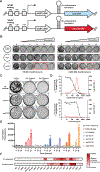
Figure 1.
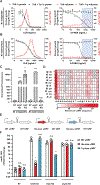
Figure 1.. Development and validation of whiB7 reporters.
(A) Genetic architecture of PwhiB7 reporter constructs. Both reporters were cloned into single-copy, integrating plasmids. (B) Zeocin resistance profiles of M. smegmatis strains (~1,000 colony forming units (CFU)/well) harboring the zeocin resistance gene driven by the indicated promoters. EM7 is a strong, constitutive promoter derived from the T7 promoter. Plates contain either no drug (left) or 100 ng/ml = 0.25X minimum inhibitory concentration (MIC) of the known whiB7 inducing drug, clarithromycin (right). The red rectangle marks clarithromycin-dependent growth of the M. smegmatis PwhiB7:zeoR strain in the presence of 10–20 μg/ml zeocin. (C) Growth of the indicated M. smegmatis CRISPRi strains on agar plates containing zeocin at 0, 10, or 20 ug/mL. NT = non-targeting; KD = knockdown. (D) Dose response curves (mean ± s.e.m., n = 3 replicates) of the PwhiB7:mScarlet reporter M. smegmatis strain for clarithromycin (top graph) and isoniazid (bottom graph). Drug dose-response curves (percent growth) are shown in black and mScarlet fluorescence (RFU) are shown in red. (E) Normalized fluorescence values of the indicated M. smegmatis CRISPRi strains at 0, 12, and 24 hours after addition of ATc to activate CRISPRi (mean ± s.e.m., n = 3 replicates). Both ettA and argD are targeted with two different sgRNAs each, denoted #1 and #2. P300 is a strong, constitutive promoter. EV = empty vector. (F) Normalized fluorescence values for the PwhiB7:mScarlet reporter strain (top row: M. smegmatis, bottom row: M. tuberculosis) in response to the listed panel of drugs. Fluorescence values are indicative of the highest value obtained at a sub-MIC concentration of each drug. Normalized RFU: M. smegmatis = −18.2 to 2,000; M. tuberculosis = 13.2 to ≥6,000. RIF = rifampicin; LVX = levofloxacin; EMB = ethambutol; INH = isoniazid; BDQ = bedaquiline; STR = streptomycin; AMK = amikacin; CAP = capreomycin; CAM = chloramphenicol; LZD = linezolid; TGC = tigecycline; FUS = fusidic acid; CLR = clarithromycin; AZT = azithromycin; LNC = lincomycin; CND = clindamycin; SPT = spectinomycin; BRT = bortezomib; ECU = ecumicin.
Figure 2.
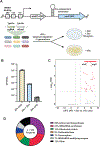
Figure 2.. Genome-scale identification of whiB7-inducing CRISPRi strains in M. smegmatis.
(A) M. smegmatis whiB7 induction screen workflow. (B) CFU quantification from the M. smegmatis screen described in panel A. (C) Volcano plot showing log2 fold-change (L2FC) values and false discovery rates (FDR) for each gene in the M. smegmatis whiB7 induction screen. The expected hit genes ettA and argD are annotated. Hit genes (n=150) were defined as having a L2FC > 2 and FDR < 0.01. (D) Functional categories of hit genes from the M. smegmatis whiB7 induction screen.
Figure 3:
Figure 3:. Modulation of the uORF coding sequence alters the response to amino acid deprivation.
(A-B) Dose response curves (mean ± s.e.m., n = 3 replicates) of the PwhiB7:mScarlet reporter strain for clarithromycin (translation inhibitor) and 6-FABA (tryptophan biosynthesis inhibitor), grown in the presence or absence of 1 mM tryptophan. (A) Top row = M. smegmatis; (B) bottom row = M. tuberculosis. Drug dose-response curves (percent growth) are shown in black and mScarlet fluorescence (RFU) are shown in red. The blue shaded region highlights the differential whiB7 induction of M. smegmatis and M. tuberculosis in response to tryptophan limitation by 6-FABA. (C) Normalized fluorescence of the indicated PwhiB7:mScarlet M. smegmatis and M. tuberculosis CRISPRi strains 24 hours and 8 days after addition of ATc, respectively (mean ± s.e.m., n = 3 replicates). Statistical significance with respect to each non-targeting CRISPRi strain was calculated using a Student’s t-test; **P< 0.01, ****P< 0.0001, n.s. = non-significant. (D) Amino acid composition (x-axis) of annotated or predicted whiB7 uORF sequences from the listed bacteria. A black X denotes lack of that amino acid within the indicated whiB7 uORF. M. tb = M. tuberculosis; M. ks = M. kansasii; M. av = M. avium; M. ul = M. ulcerans; M. mr = M. marinum; M. ft = M.fortuitum; M. ab = M. abscessus; M. sm = M. smegmatis; S. co = S. coelicolor; R. jo = R. jostii. (E) Genetic architecture of the engineered M. smegmatis whiB7 uORF variants, transformed into the ΔwhiB7 M. smegmatis strain. (F) whiB7 ORF mRNA fold-change of the indicated M. smegmatis CRISPRi strains 18 hours after addition of ATc (mean ± s.e.m., n = 3 biological replicates). The M. smegmatis CRISPRi strains harbor the whiB7 uORF variants as depicted in panel (E). whiB7 ORF mRNA fold change is relative to sigA and normalized to the respective non-targeting CRISPRi strain for each uORF variant. Statistical significance with respect to the WT whiB7 uORF strain was calculated for each knockdown mutant using a Student’s t-test; *P< 0.05, **P< 0.01, n.s. = non-significant. WT = wild-type.
Figure 4:
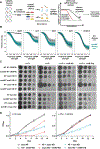
Figure 4:. Identification of differential vulnerabilities in ΔwhiB7
(A) Differential vulnerability screen in ΔwhiB7 M. smegmatis. This screen identifies genes that become more or less sensitive to CRISPRi inhibition between wild-type and ΔwhiB7 M. smegmatis. Please see the Materials and Methods section and Bosch et al. for further details on screen analysis. (B) Expression-fitness relationships for the five indicated M. smegmatis genes. The fitness cost (beta_E) is plotted as a function of predicted sgRNA strength (an estimate of the magnitude of target knockdown). Both aspC, asd, and hisC are more vulnerable in ΔwhiB7 M. smegmatis (tourquise). (C) Growth of the indicated M. smegmatis CRISPRi strains monitored by spotting serial dilutions of each strain on the indicated media. Supplemental alanine and aspartate were added at 1 mM. Note that hypomorphic sgRNAs that are predicted to lead to intermediate levels of knockdown are shown for trpC and mmpL3, as strong sgRNAs leading to high-level knockdown would block growth of both wild-type and ΔwhiB7 M. smegmatis and not be relevant controls for differential vulnerability. (D) Growth of the indicated M. tuberculosis dual-gene knockdown CRISPRi strains in 7H9 + ATc, with or without supplemental alanine (1 mM). Dual NT represents a CRISPRi plasmid encoding two non-targeting sgRNAs; NT + whiB7 KD represents a CRISPRi plasmid encoding a single non-targeting sgRNA and a whiB7 targeting sgRNA; aspC KD + whiB7 KD represents a CRISPRi plasmid encoding one sgRNA targeting aspC and a separate sgRNA targeting whiB7.
Figure 5:
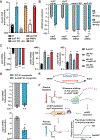
Figure 5:. whiB7 coordinates a feedback loop with aspC.
(A) ChIP RT-qPCR of the aspC promoter in the indicated M. smegmatis WhiB7 N-terminal 3X-FLAG strains. Fold-enrichment of aspC promoter qPCR signal relative to the control trpC promoter (WhiB7-independent) is indicated. whiB7 was induced either by CRISPRi knockdown of ettA or aspC (18 hours +ATc), or treatment with clarithromycin for 12 hours. Statistical significance with respect to the non-targeting CRISPRi strain or DMSO control was calculated using a Student’s t-test, **P< 0.01, ***P<0.001 n.s. = non-significant. (B) Relative mRNA levels of the indicated genes in the indicated M. smegmatis CRISPRi strains 15 hours after addition of ATc (mean ± s.e.m., n = 3 biological replicates). mRNA fold-change for the indicated gene at the bottom of each pair of bar graphs was calculated relative to sigA and normalized to the respective non-targeting CRISPRi strain for WT M. smegmatis or the ΔwhiB7 strain. Grey = WT, blue = ΔwhiB7. Statistical significance between the WT and ΔwhiB7 strain was calculated using a Student’s t-test, **P< 0.01, ***P<0.001. (C) Relative mRNA levels of the indicated genes in the indicated M. tuberculosis CRISPRi strains 5 days after addition of ATc (mean ± s.e.m., n = 3 biological replicates). ettA dual CRISPRi knockdown strains are shown for whiB7 and the downstream whiB7 regulon gene, tap, which serves as a negative control. mRNA fold-change for the gene indicated on the y-axis was calculated relative to sigA and normalized to the respective non-targeting CRISPRi dual non-targeting CRISPRi strain. Statistical significance for each strain was calculated with respect to the dual non-targeting (NT) strain for each of the indicated genes using a Student’s t-test, *P<0.05, **P< 0.01, ***P<0.001, ****P<0.0001. (D) Relative mRNA levels of the indicated genes in ettA knockdown CRISPRi strains (M. smegmatis) 18 hours after addition of ATc (mean ± s.e.m., n = 3 biological replicates). mRNA fold-change for the gene indicated on the y-axis was calculated relative to sigA and normalized to the respective non-targeting CRISPRi strain for WT M. smegmatis or the ΔwhiB7 strain. Grey = WT, blue = ΔwhiB7. Statistical significance between the WT and ΔwhiB7 strain was calculated using a Student’s t-test, **P< 0.01. (E,F) Proposed model (E) and mechanism (F) for the whiB7-aspC feedback loop.

Update of

References

    1. Hambridge T, Nanjan Chandran SL, Geluk A, Saunderson P, and Richardus JH (2021). Mycobacterium leprae transmission characteristics during the declining stages of leprosy incidence: A systematic review. PLoS neglected tropical diseases 15, e0009436. 10.1371/journal.pntd.0009436. - DOI - PMC - PubMed
    1. World Health Organisation (2021). WHO Global Tuberculosis Report 2021.
    1. To K, Cao R, Yegiazaryan A, Owens J, and Venketaraman V. (2020). General Overview of Nontuberculous Mycobacteria Opportunistic Pathogens: Mycobacterium avium and Mycobacterium abscessus. Journal of clinical medicine 9. 10.3390/jcm9082541. - DOI - PMC - PubMed
    1. Lenaerts A, Barry CE, and Dartois V. (2015). Heterogeneity in tuberculosis pathology, microenvironments and therapeutic responses. Immunological reviews 264, 288–307. 10.1111/imr.12252. - DOI - PMC - PubMed
    1. Dick T, and Dartois V. (2018). TB drug susceptibility is more than MIC. Nature Microbiology 3, 971–972. 10.1038/s41564-018-0226-3. - DOI - PubMed

MeSH terms

LinkOut - more resources