. 2024 May;166(5):826-841.e19.
doi: 10.1053/j.gastro.2024.01.026. Epub 2024 Jan 23.

Interleukin 21 Drives a Hypermetabolic State and CD4+ T-Cell-Associated Pathogenicity in Chronic Intestinal Inflammation

Affiliations

Interleukin 21 Drives a Hypermetabolic State and CD4+ T-Cell-Associated Pathogenicity in Chronic Intestinal Inflammation

Adebowale O Bamidele et al. Gastroenterology. 2024 May.

Abstract

Background & aims: Incapacitated regulatory T cells (Tregs) contribute to immune-mediated diseases. Inflammatory Tregs are evident during human inflammatory bowel disease; however, mechanisms driving the development of these cells and their function are not well understood. Therefore, we investigated the role of cellular metabolism in Tregs relevant to gut homeostasis.

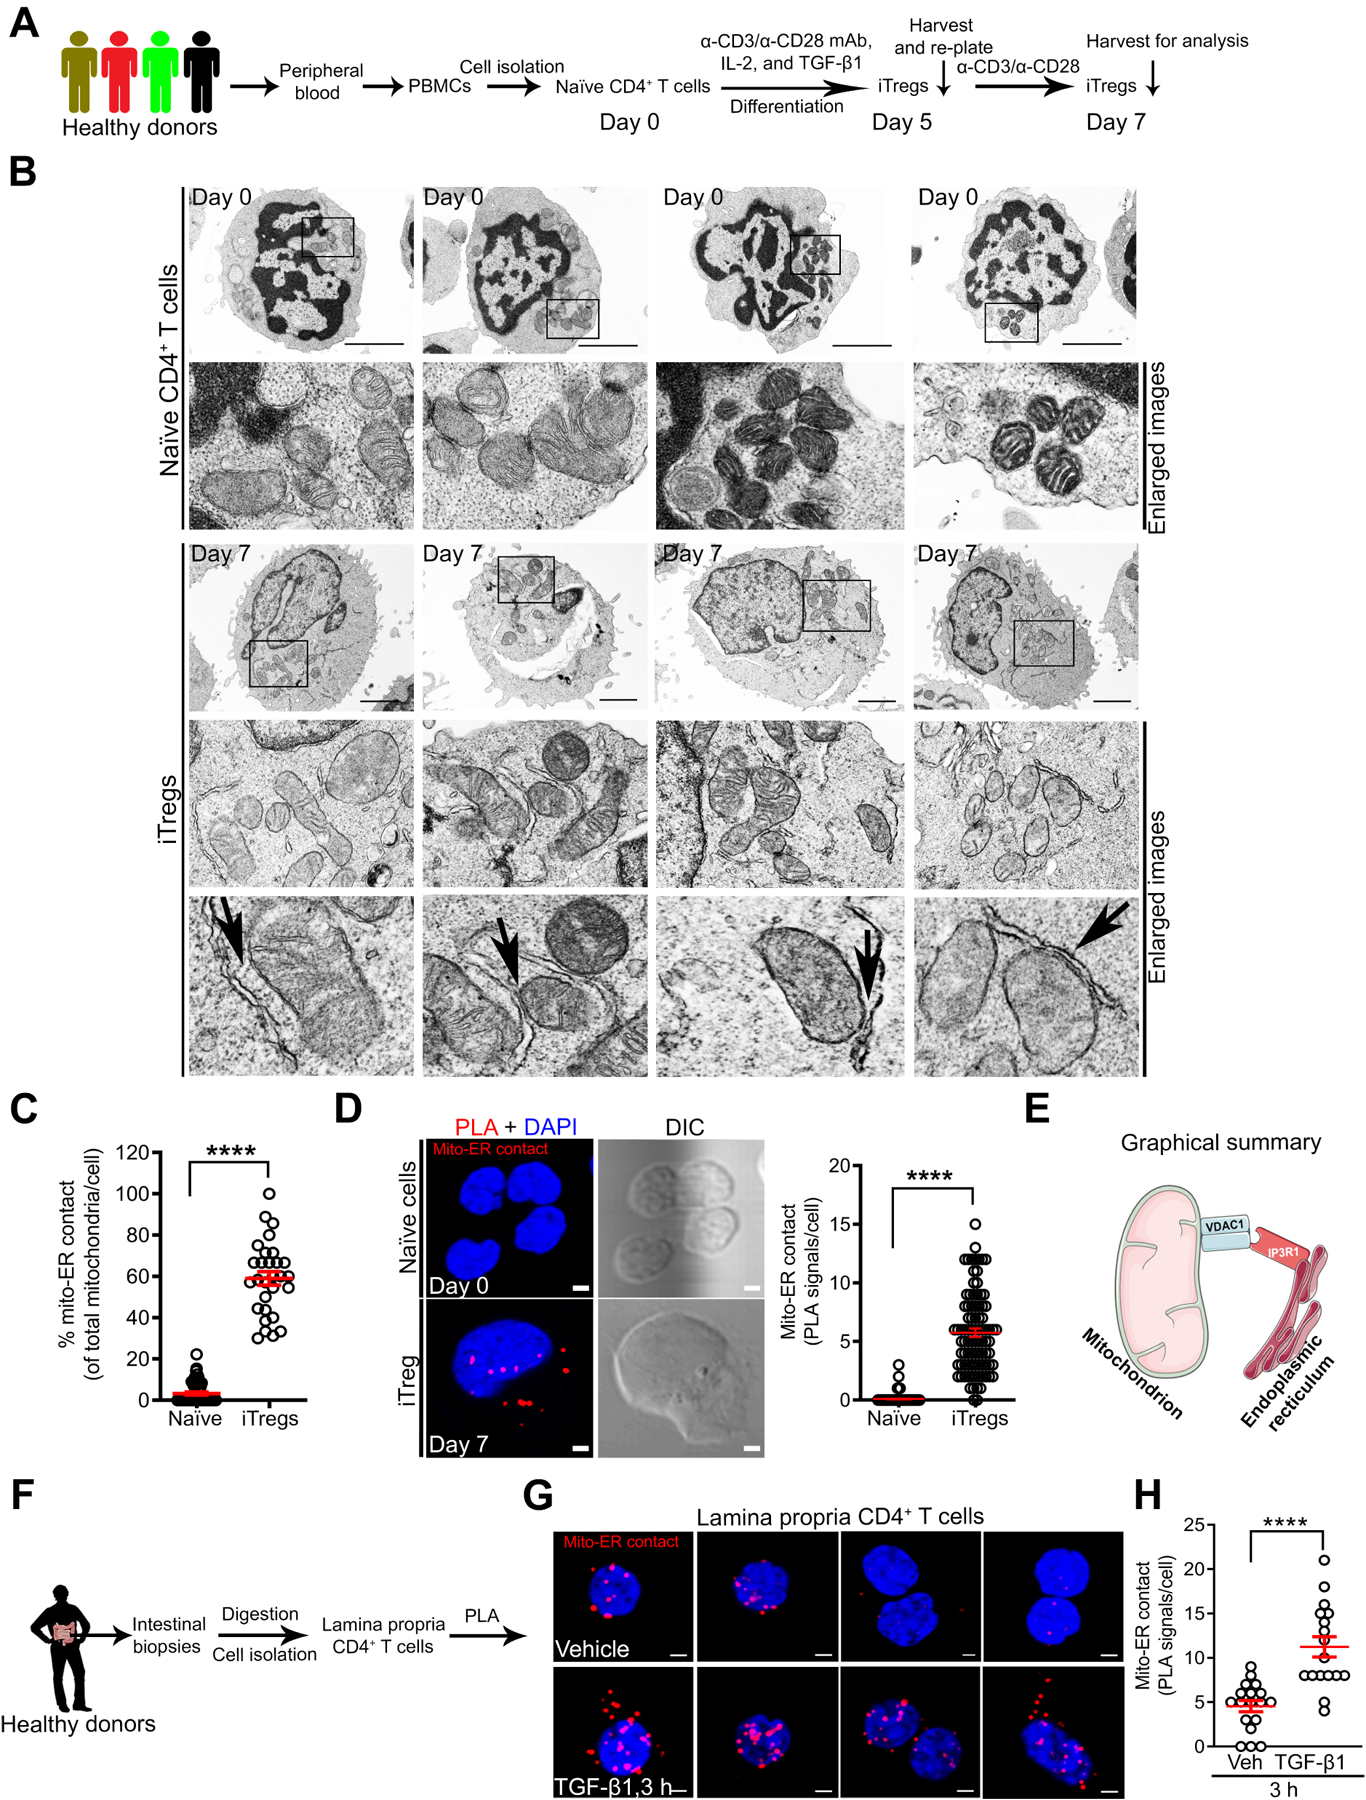
Methods: Using human Tregs, we performed mitochondrial ultrastructural studies via electron microscopy and confocal imaging, biochemical and protein analyses using proximity ligation assay, immunoblotting, mass cytometry and fluorescence-activated cell sorting, metabolomics, gene expression analysis, and real-time metabolic profiling utilizing the Seahorse XF analyzer. We used a Crohn's disease single-cell RNA sequencing dataset to infer the therapeutic relevance of targeting metabolic pathways in inflammatory Tregs. We examined the superior functionality of genetically modified Tregs in CD4+ T-cell-induced murine colitis models.

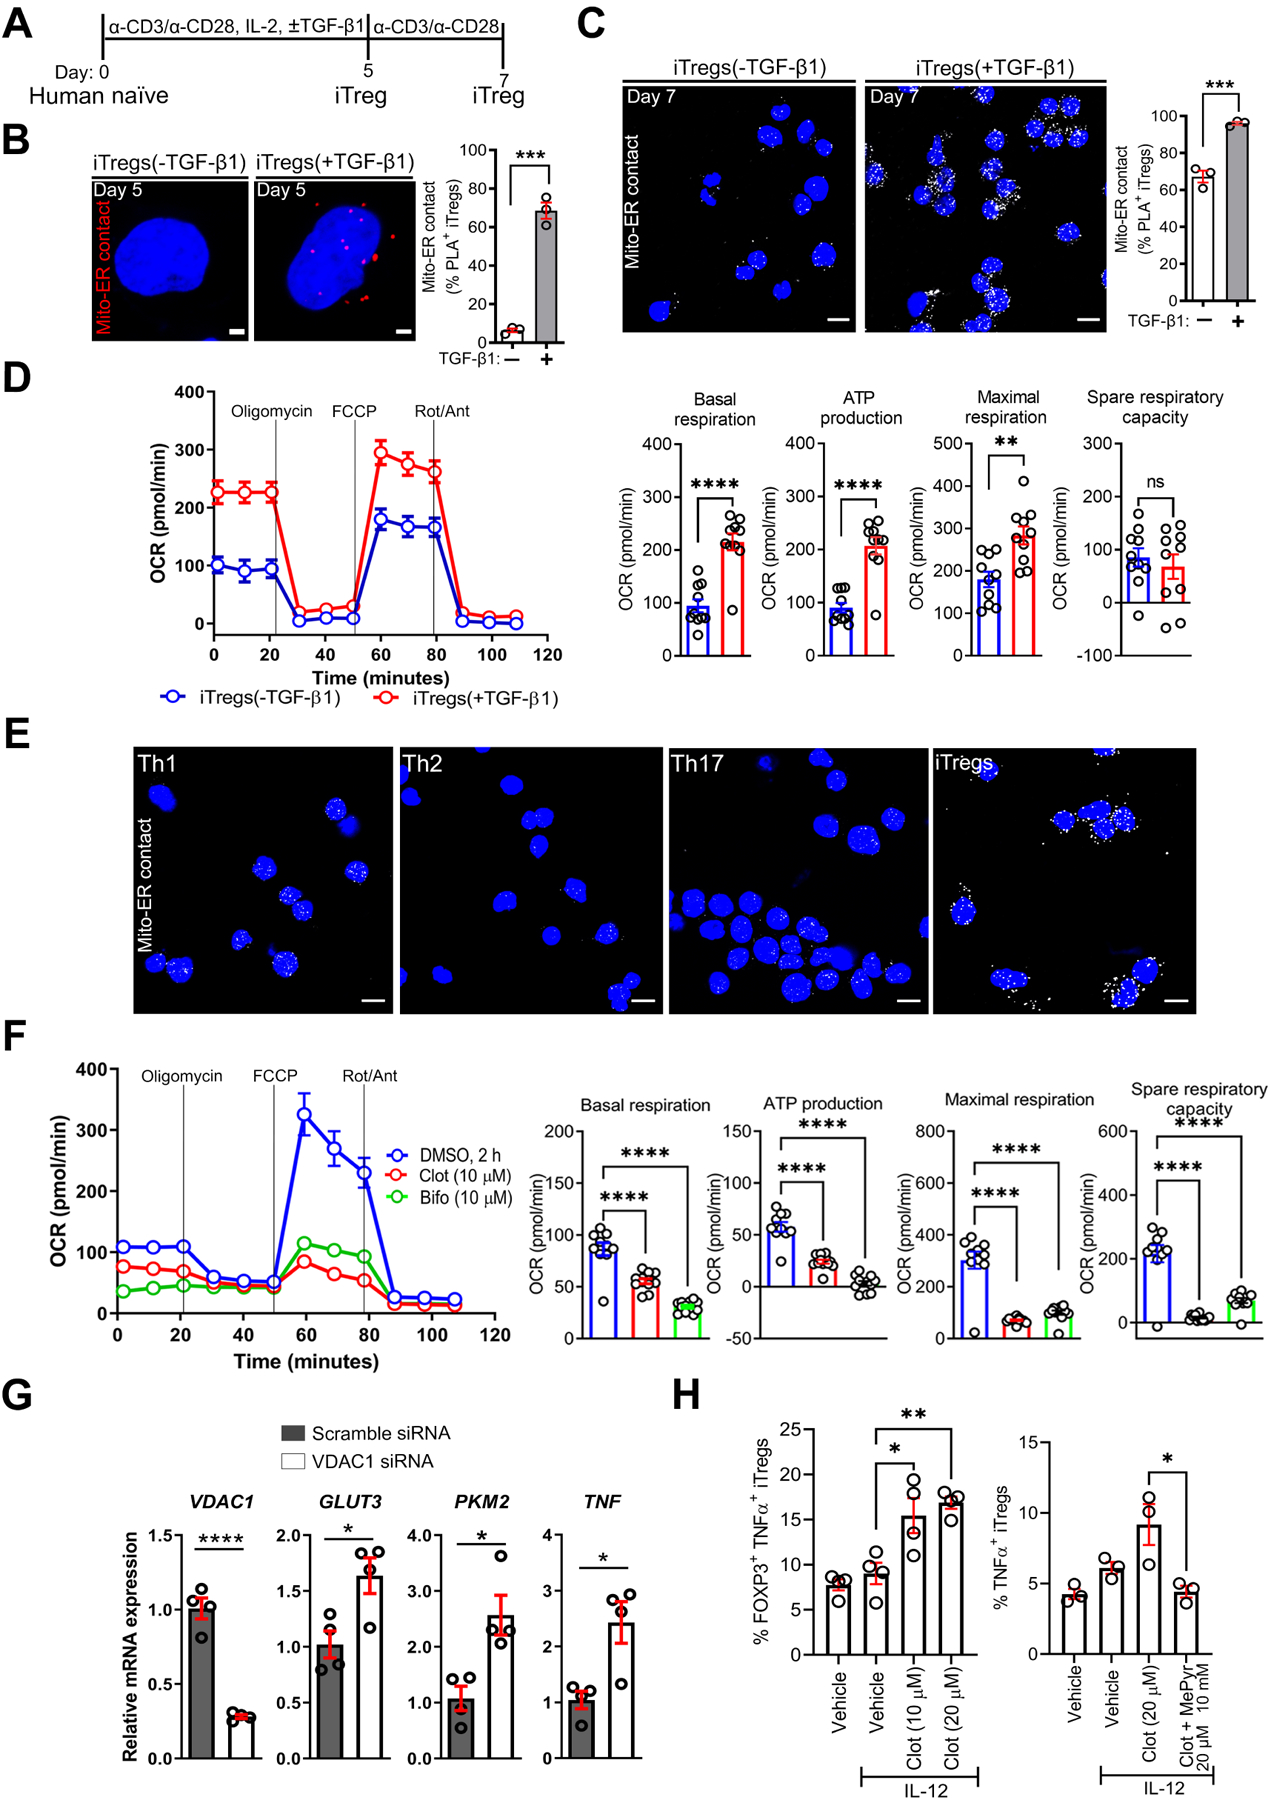
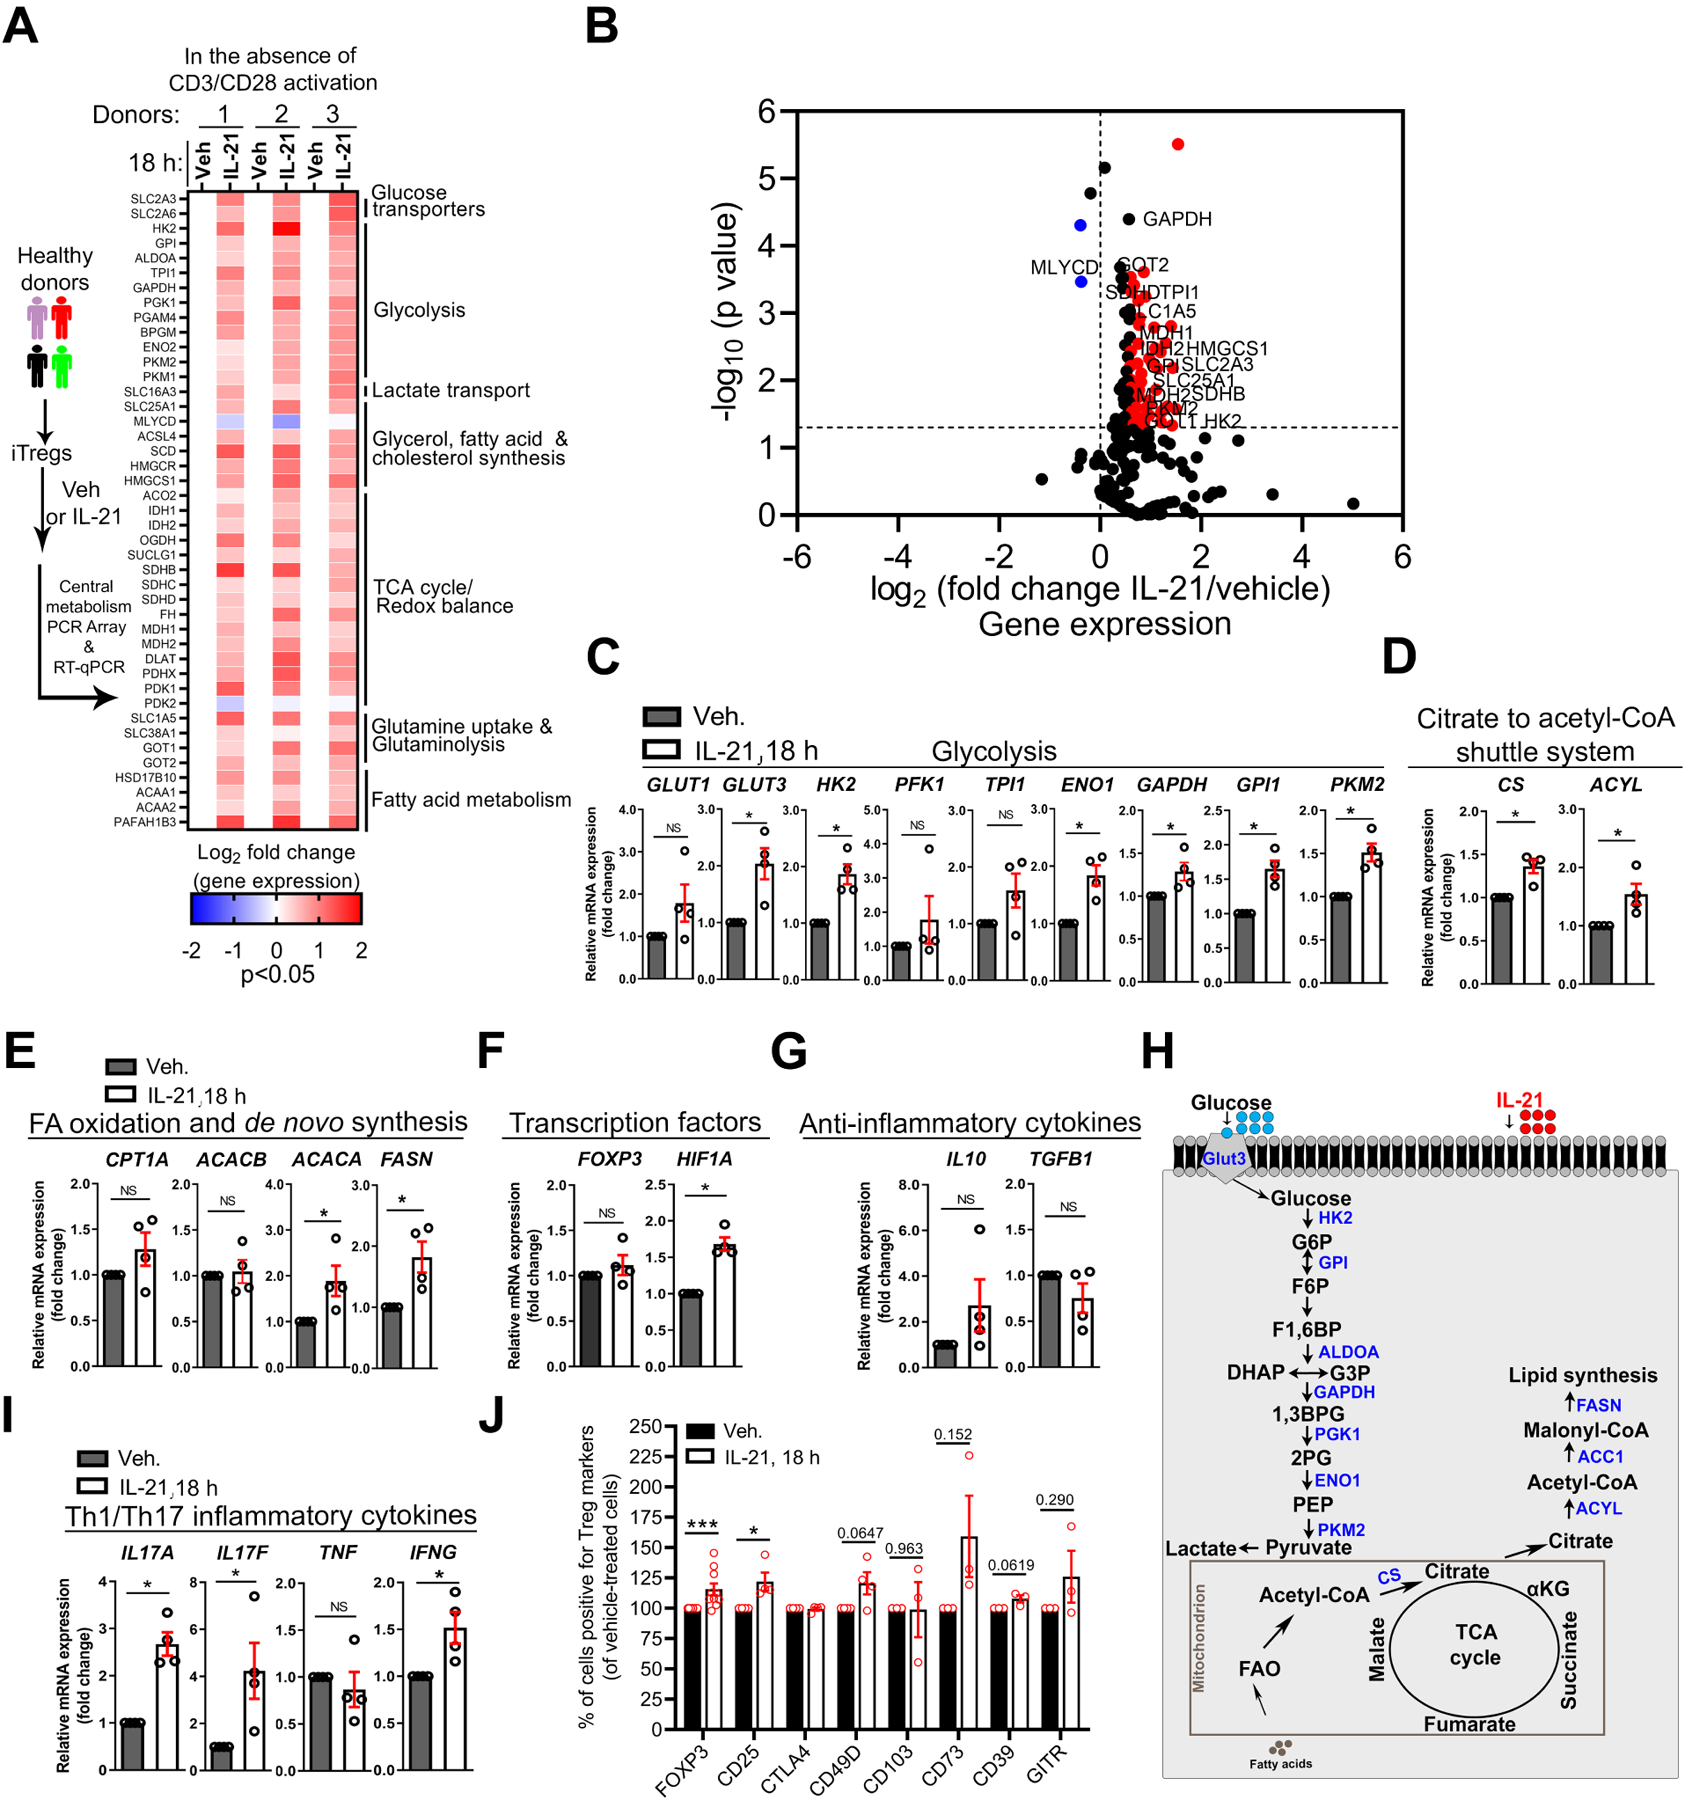
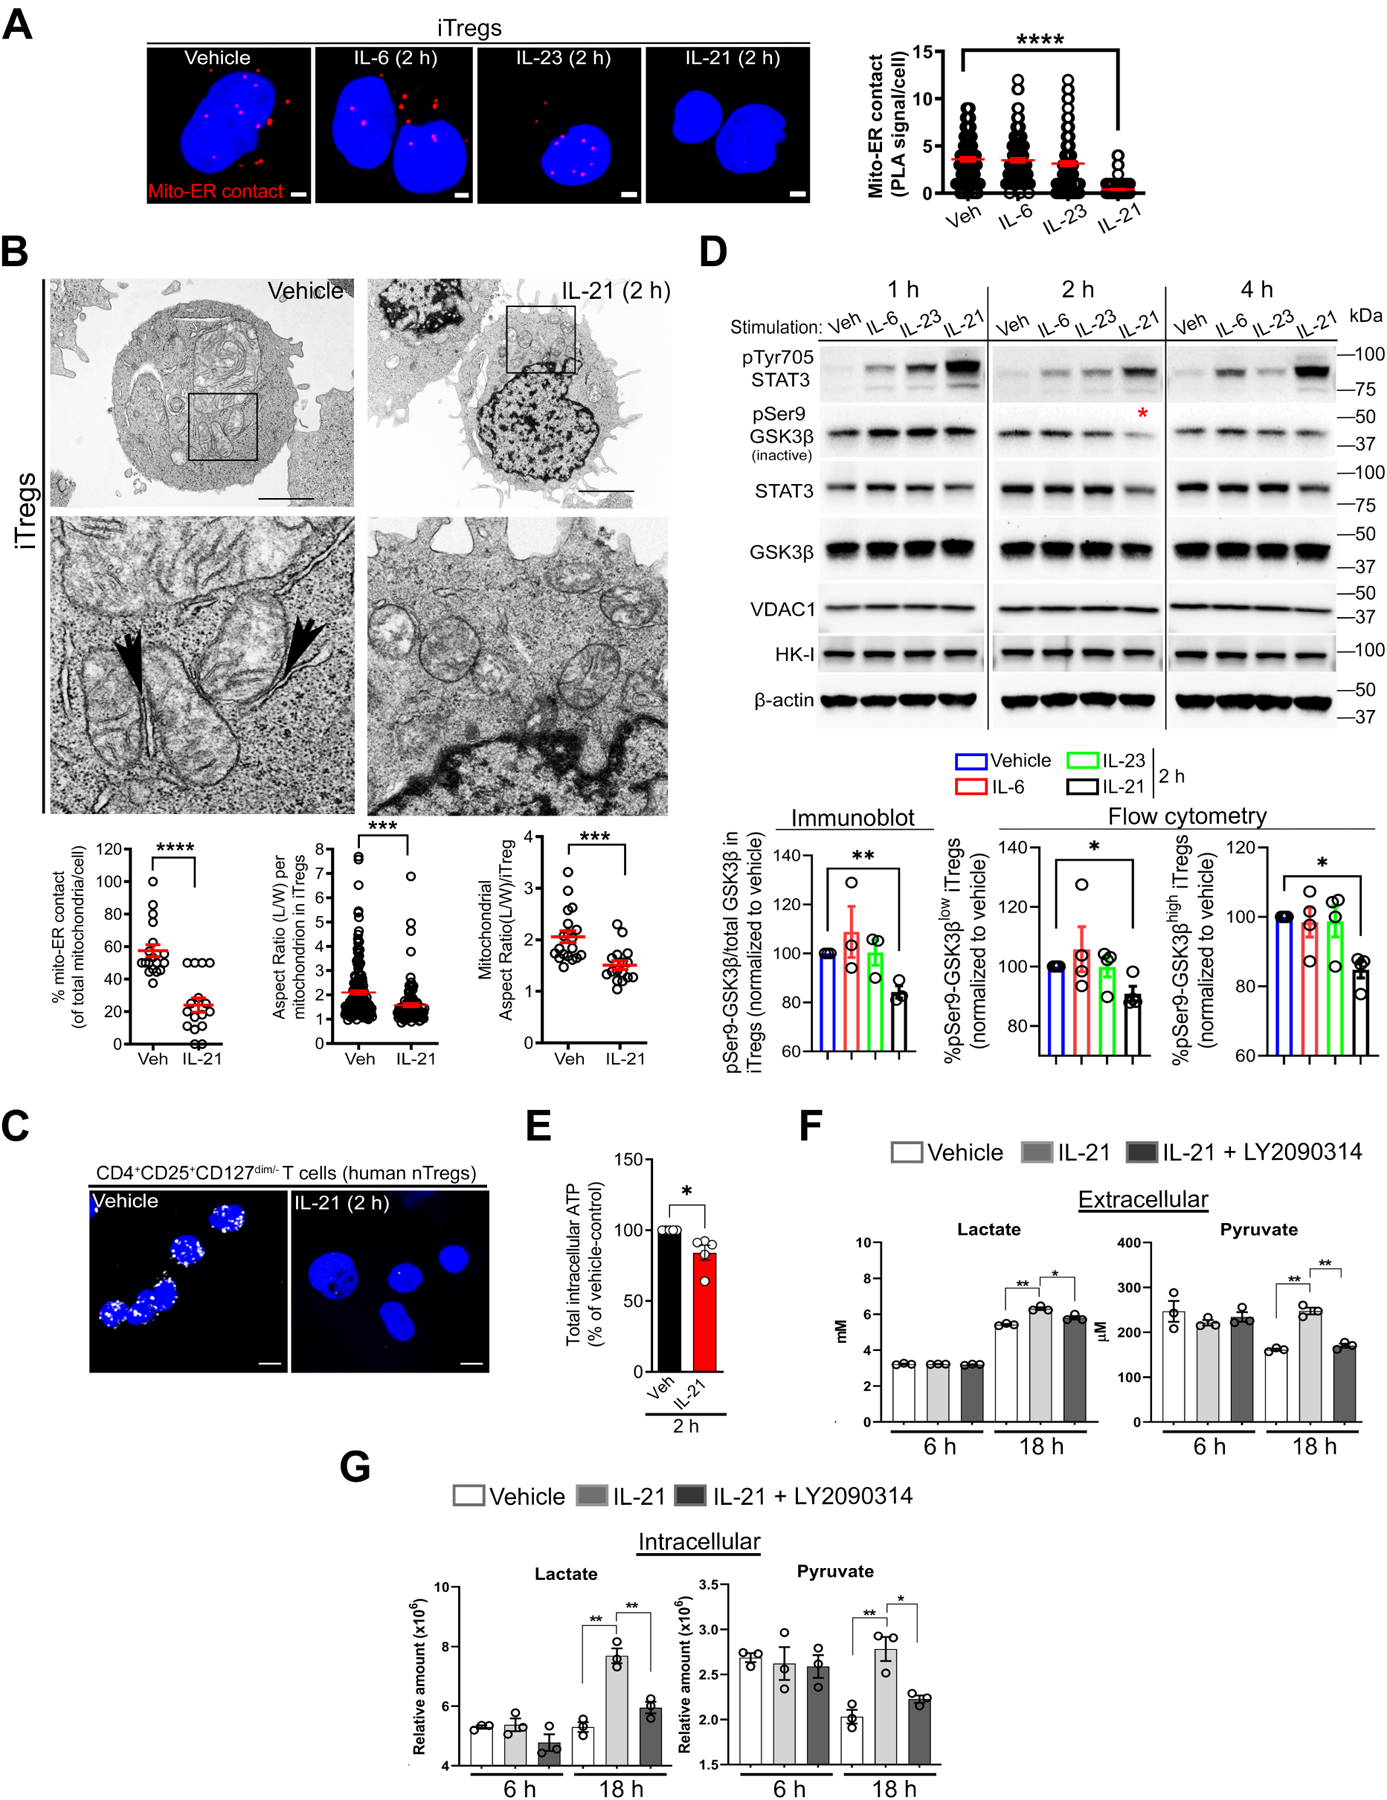
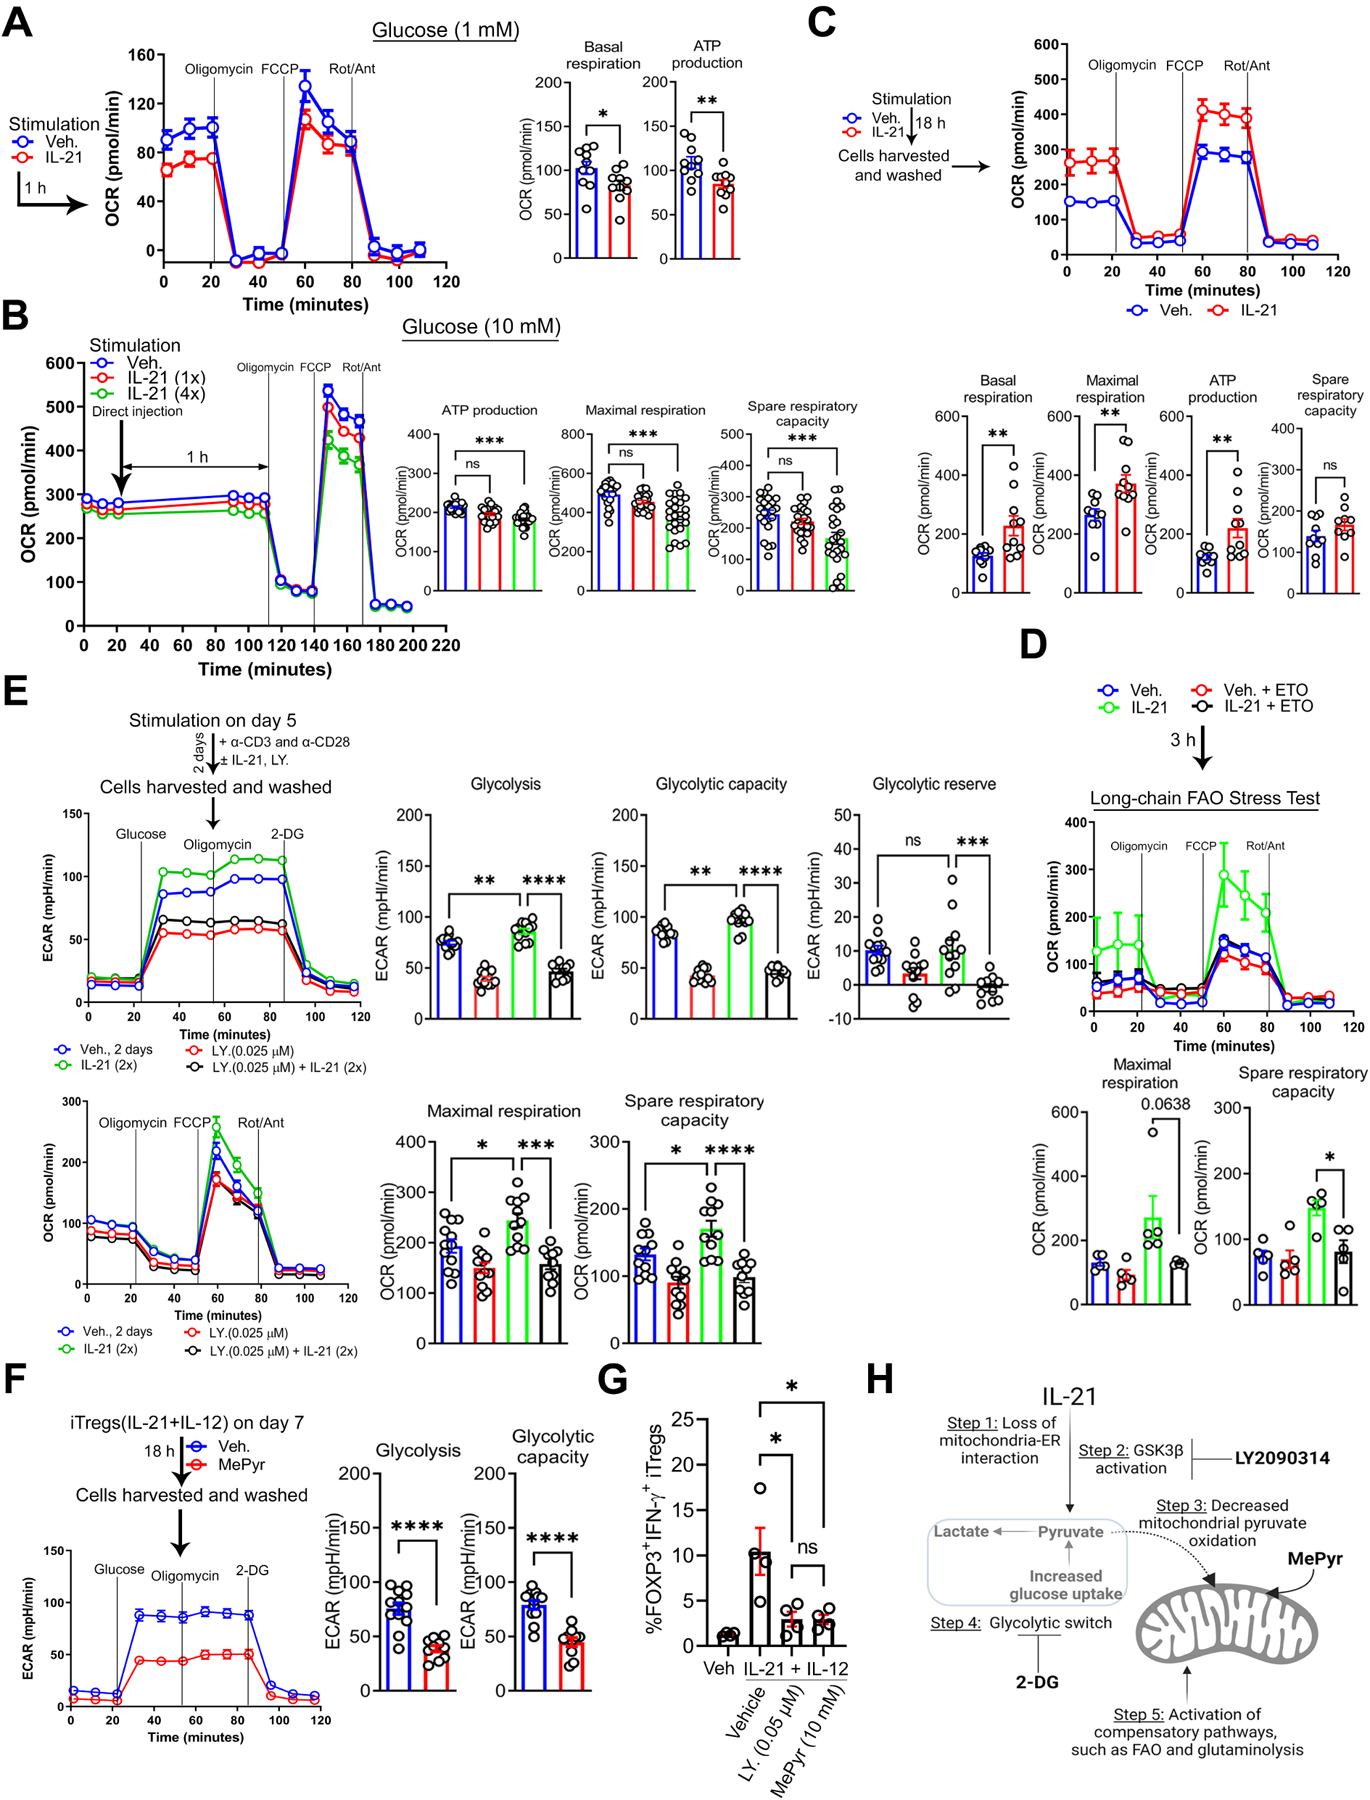
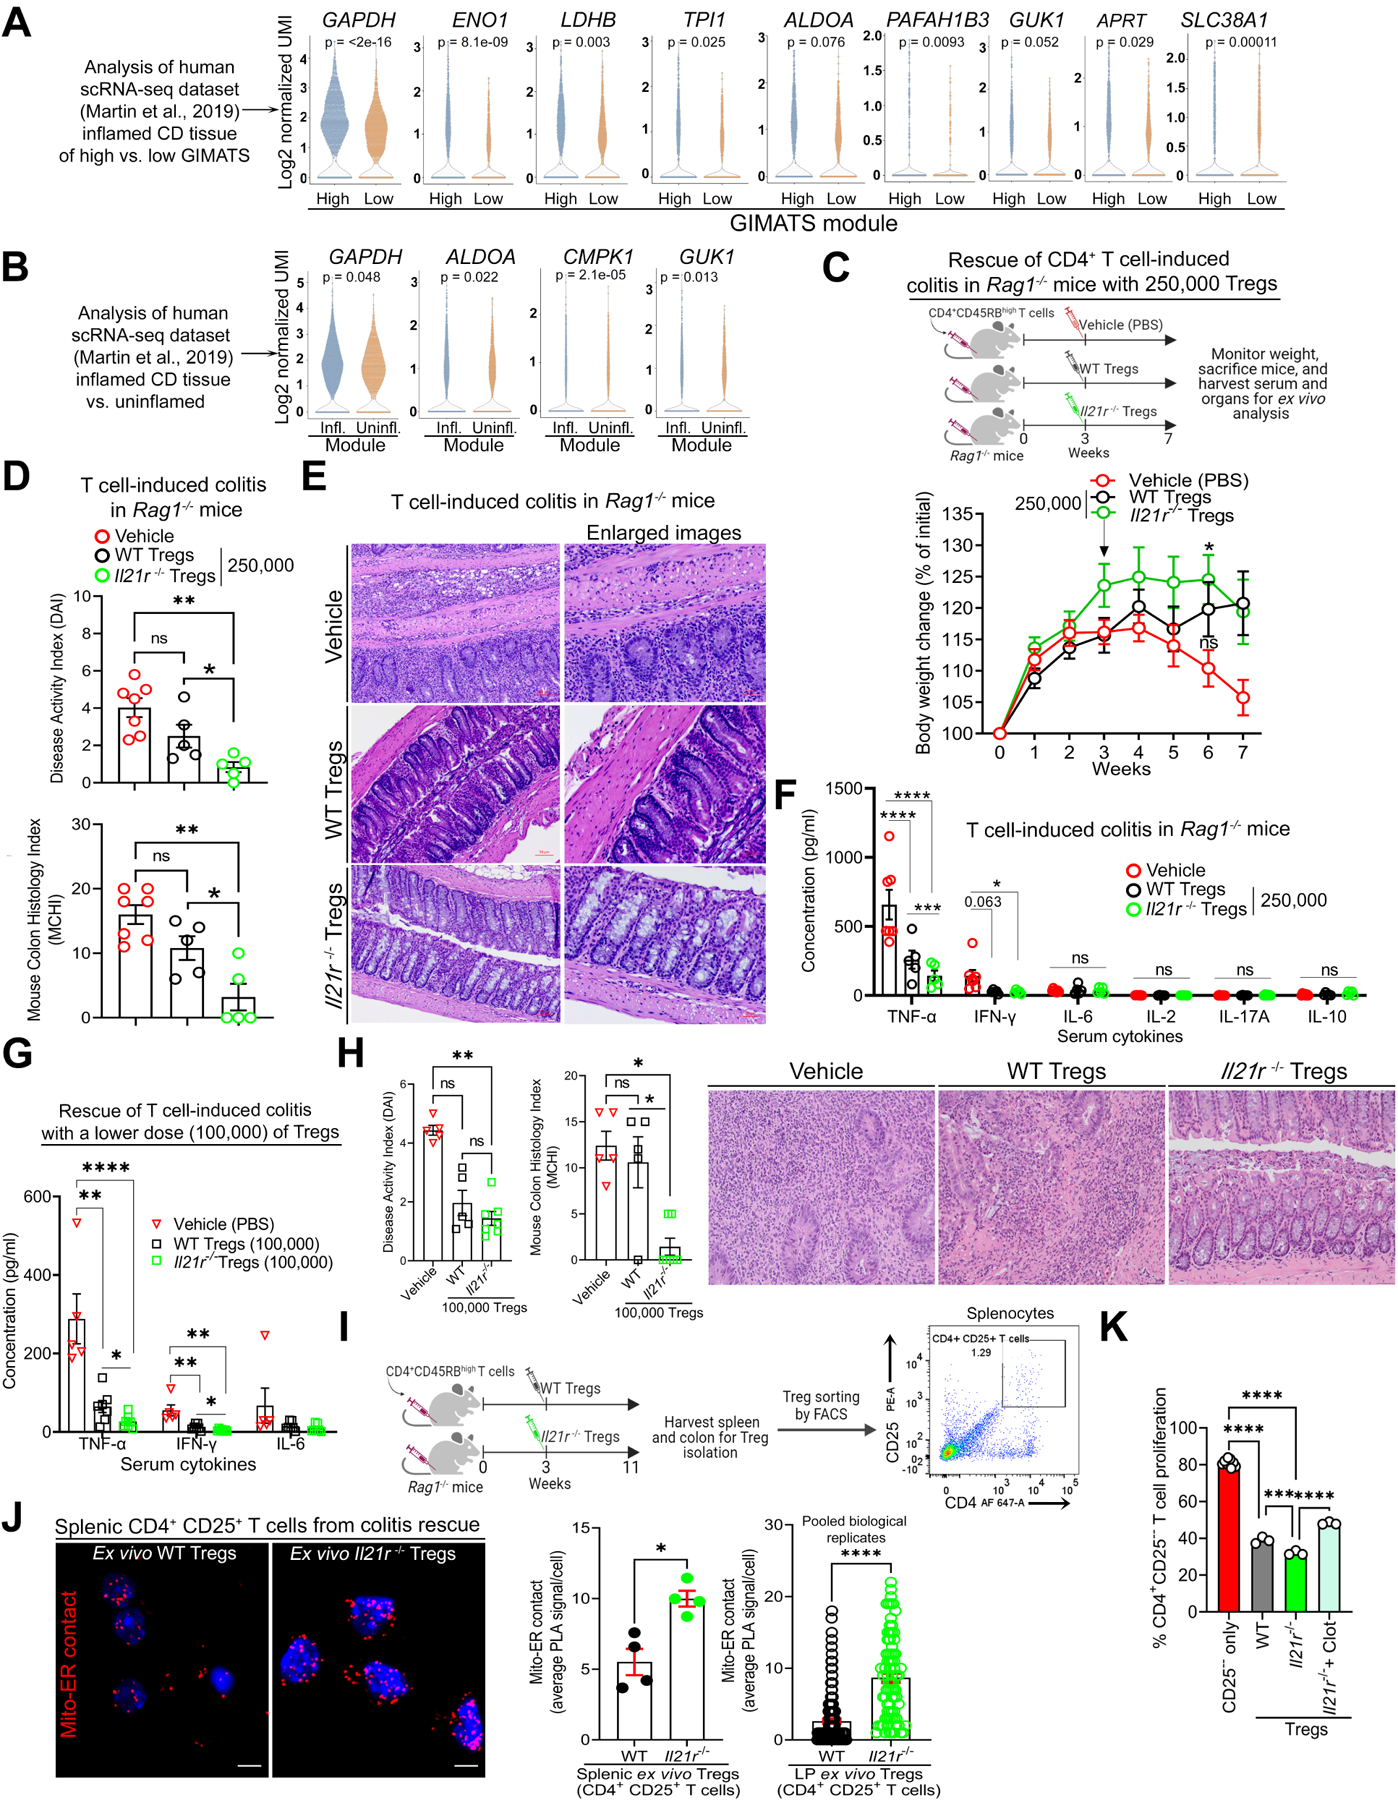
Results: Mitochondria-endoplasmic reticulum appositions, known to mediate pyruvate entry into mitochondria via voltage-dependent anion channel 1 (VDAC1), are abundant in Tregs. VDAC1 inhibition perturbed pyruvate metabolism, eliciting sensitization to other inflammatory signals reversible by membrane-permeable methyl pyruvate supplementation. Notably, interleukin (IL) 21 diminished mitochondria-endoplasmic reticulum appositions, resulting in enhanced enzymatic function of glycogen synthase kinase 3 β, a putative negative regulator of VDAC1, and a hypermetabolic state that amplified Treg inflammatory response. Methyl pyruvate and glycogen synthase kinase 3 β pharmacologic inhibitor (LY2090314) reversed IL21-induced metabolic rewiring and inflammatory state. Moreover, IL21-induced metabolic genes in Tregs in vitro were enriched in human Crohn's disease intestinal Tregs. Adoptively transferred Il21r-/- Tregs efficiently rescued murine colitis in contrast to wild-type Tregs.

Conclusions: IL21 triggers metabolic dysfunction associated with Treg inflammatory response. Inhibiting IL21-induced metabolism in Tregs may mitigate CD4+ T-cell-driven chronic intestinal inflammation.

Keywords: Inflammatory Bowel Disease; Interleukins; Mitochondria-ER Appositions; Pyruvate; Regulatory T Cells.


Conflict of interest statement

Disclosures

The authors declare no conflicts of interest.

Figures

Figure 1.
Figure 1.. Mitochondria-ER Appositions are Present in Human Tregs.
(A) Experimental workflow for naïve CD4+ T cell isolation from PBMCs and differentiation into iTregs. (B and C) Transmission electron microscopy (TEM) images of naïve cells (top panels) vs. iTregs (bottom panels) with enlarged images of mitochondria (mito)-ER contact. Black arrows indicate electron-dense regions; scale bars, 2 μm (B). Graph shows mitochondria in contact with ER per cell in TEM images; naïve cells (n = 51) and iTregs (n = 29) (C). (D) Representative images show mito-ER contact in red after PLA, cell structure in differential interference contrast (DIC), and nucleus stained with 4’,6’-diamidino-2-phenylinode (DAPI) (DNA, blue); scale bar, 2 μm. Graph shows the number of PLA signals (mito-ER contact) per cell (n = 239 iTregs, n = 90 naïve cells). (E) Graphical summary of mitochondria-ER interaction detected via VDAC1-IP3R1 binding in human Tregs. (F) Experimental workflow for lamina propria (LP) CD4+ T cell isolation and PLA. (G) Representative images show mito-ER contact in red, DAPI in LP CD4+ T cells in the presence (bottom panels) or absence (top panels) of (±) TGF-β1 (25 ng/ml) stimulation; scale bar, 2 μm. (H) Graph shows quantitation of mito-ER contact (PLA signals) per LP CD4+ T cell; vehicle-stimulated cells (n = 17) and TGF-β1-stimulated cells (n = 18). Data represents mean ± SEM from 2–3 independent experiments or biological replicates. **** p < 0.0001, using two-tailed Student’s t-test.
Figure 2.
Figure 2.. VDAC1 Inhibition Alters iTreg Metabolic State and Sensitizes to IL-12-induced Inflammatory Response.
(A) Experimental workflow for the generation of human iTregs in the absence or presence of TGF-β1. (B and C) Representative PLA images of iTregs ± TGF-β1 show mito-ER contacts in red on day 5 (B) or in white on day 7 (C); scale bars, 2 μm and 10 μm. Graphs show PLA+ cells on day 5 (n = 257 vs. n = 200) (B) and on day 7 (n = 129 vs. n = 119) (C). (D) Representative oxygen consumption rate (OCR) profile of iTreg cell types before and after mitochondrial perturbation (n = 3). Bar graphs show calculated basal respiration, ATP production, maximal respiration, and spare respiratory capacity; mean ± SEM from 10–12 technical replicates. (E) Representative PLA images show mito-ER contact in iTregs vs. effector T helper cells (n = 3 biological donors); scale bar, 10 μm. (F) Representative OCR profile of iTregs ± clotrimazole (clot), bifonazole (bifo) or UK5099 (n = 3). Bar graphs show calculated basal respiration, ATP production, maximal respiration, and spare respiratory capacity; mean ± SEM from 12 technical replicates. (G) Relative mRNA expression in transfected iTregs via RT-qPCR (n = 3). (H) Percentage of TNF-α+ in iTregs, as determined by flow cytometry (n = 3–4). Data represents mean ± SEM. * p < 0.05, ** p < 0.01, *** p < 0.001, and **** p < 0.0001, using two-tailed Student’s t-test or one-way ANOVA followed by Bonferroni test for multiple comparisons.
Figure 3.
Figure 3.. IL-21 Stimulation of Human iTregs Promotes a Hypermetabolic State.
(A–I) Transcriptional profiling of human iTregs ± IL-21 (100 ng/ml) in serum-free media in the absence of TCR and CD28 activation. (A) Left, experimental workflow for the metabolic transcriptional profiling of iTregs. Right, heatmap of 43 metabolic transcripts (IL-21/vehicle, p < 0.05) and the associated metabolic processes (n = 3). (B) Volcano plot illustrates all detected 211 metabolic genes (IL-21/vehicle, n = 3). Red dots denote genes with >1.5-fold change and p-value of <0.05 while blue dots denote <−1.0-fold change and p-value of <0.05. (C–G) Relative mRNA expression via RT-qPCR in iTregs ± IL-21 (n = 4). Expression of metabolic genes (C–E), transcription factors (F), and anti-inflammatory cytokines (G); Mann-Whitney U test. (H) Schematic illustrates metabolic genes (shown in blue) upregulated in IL-21-stimulated iTregs. (I) Relative mRNA of inflammatory genes in iTregs via RT-qPCR ± IL-21 (n = 4); Mann-Whitney U test. (J) Percentage of iTregs positive for FOXP3 and surface markers, as determined by FACS (n = 3–9). Data represents mean ± SEM. * p < 0.05 and *** p < 0.001, using a two-tailed Student’s t-test. NS (not significant).
Figure 4.
Figure 4.. IL-21 Dissociates Mitochondria from ER, Resulting in Pyruvate Imbalance and Sensitization to IL-12-induced Inflammatory Response.
(A) Representative PLA images of mito-ER contact in iTregs ± 50 ng/ml of IL-6 (n = 113 cells), IL-23 (n = 131 cells), or IL-21 (n = 221 cells) vs. vehicle (n = 115 cells); scale bar, 2 μm. Graph shows mito-ER contact (red PLA signals) per cell (n = 2 independent experiments). (B) Representative TEM images of iTregs ± IL-21, with black arrows indicating electron-dense regions; scale bar, 2 μm. Graphs show quantitation of mito-ER contact (n = 19 vs. n = 16 cells) (left), aspect ratio per mitochondrion (n = 167 vs. n = 101 mitochondria) (middle), and mitochondrial aspect ratio per cell (n = 19 vs. n = 16 cells) (right). (C) Representative PLA images show mito-ER contact in human nTregs treated with vehicle or IL-21 after activation and TGF-β1 stimulation for 24 h; scale bar, 5 μm (n = 2 independent experiments). (D) Representative immunoblots from iTregs ± cytokines (100 ng/ml). The red asterisk shows a reduction in GSK3β inactive form (top) (n = 3). Bar graphs show pSer9-GSK3β levels by immunoblot (n = 3) and the percentage of pSer9-GSK3β-expressing cells by FACS (n = 4). (E) Intracellular ATP levels in iTregs ± IL-21 (50 ng/ml) (n = 5); Mann-Whitney U test. (F and G) Extra- and intra-cellular lactate and pyruvate abundance in iTregs cultured in normal conditions ± IL-21 (100 ng/ml), LY2090314 GSK3 inhibitor (0.025 μM), or both (n = 3). Data represents mean ± SEM. * p < 0.05, ** p < 0.01, *** p < 0.001, and **** p < 0.0001, using two-tailed Student’s t-test or one-way ANOVA followed by Bonferroni test for multiple comparisons.
Figure 5.
Figure 5.. Methyl Pyruvate Supplementation Mirrors LY2090314 Treatment and Suppresses the Metabolic Basis of Inflammatory iTregs.
(A) Representative OCR profile of iTregs in 1 mM glucose ± IL-21 (100 ng/ml) (n = 3). Bar graphs show calculated basal respiration and ATP production; mean ± SEM from 10 technical replicates. (B) Representative OCR profile of iTregs in 10 mM glucose ± IL-21 (100–400 ng/ml) (n = 3). Bar graphs show calculated basal respiration, ATP production, maximal respiration, and spare respiratory capacity; mean ± SEM from 10–24 technical replicates. (C) Representative OCR profile of iTregs ± IL-21 (100 ng/ml) in the presence of TCR and CD28 activation (n = 3). Bar graphs show calculated basal respiration, maximal respiration, ATP production, and spare respiratory capacity; mean ± SEM from 10 technical replicates. (D) Representative OCR profile of iTregs ± IL-21 (100 ng/ml), etomoxir (ETO, 50 μM), or both (n = 3). Bar graphs show calculated basal respiration, maximal respiration, ATP production, and spare respiratory capacity; mean ± SEM from 5 technical replicates. (E) Representative ECAR (top) and OCR (bottom) profiles of iTregs ± IL-21, LY2090314, or both (n = 3). Bar graphs show calculated glycolysis, glycolytic capacity, and glycolytic reserve (top) and maximal respiration and spare respiratory capacity (bottom); mean ± SEM from 10–12 technical replicates. (F) Representative ECAR profile of IL-21 and IL-12-stimulated iTregs ± methyl pyruvate (MePyr, 10 mM) (n = 3). Graphs show calculated glycolysis and glycolytic capacity; mean ± SEM from 10–12 technical replicates. (G) Graph shows percentage of IL-21 and IL-12-induced FOXP3+ IFN-γ+ iTregs ± LY2090314 or MePyr (n = 4). (H) The schematic diagram illustrates IL-21-mediated metabolite imbalance in iTregs. Diagram was created with biorender.com Data represents mean ± SEM. * p < 0.05., *** p < 0.001 and **** p < 0.0001, using two-tailed Student’s t-test or one-way ANOVA followed by Bonferroni test for multiple comparisons.
Figure 6.
Figure 6.. IL-21-induced Metabolic Genes are Enriched in Refractory Human IBD, and IL-21R-deficient Tregs Effectively Lessen CD4+ T Cell-induced Colitis in Mice.
(A) Violin plots show the log2 normalized UMI of metabolic genes in human Treg clusters from Crohn’s disease (CD) inflamed tissues of GIMATS (IgG plasma cells, inflammatory MNP, and activated T and stromal cells) module (Wilcoxon test; P); n = 5 for GIMATShigh patients and n = 4 for GIMATSlow patients. (B) Violin plots show the log2 normalized UMI of metabolic genes in human Treg clusters from CD inflamed vs. adjacent non-inflamed tissues from the same patients (n = 9 patients) (Wilcoxon test; P). (C) The schematic diagram illustrates colitis induction with pathogenic T cells and rescue approach with adoptive Treg transfer. Change in body weight of mice during CD4+ T cell-induced colitis rescue (n = 5–7 mice per group). (D) DAI and MCHI of colitis mice on week 7. MCHI was assessed by a blinded pathologist. (E) Hematoxylin and eosin (H&E) staining of colon sections of colitis mice on week 7; scale bar, 50 μm. (F) Serum cytokine levels in colitis mice on week 7. (G) Serum cytokine levels in colitis mice on week 11. (H) DAI and MCHI of colitis mice as well as H&E staining of colon sections on week 11. (I) Experimental workflow and dot plot of sorted splenic CD4+ CD25+ T cells (Tregs) from colitis mice. (J) Representative images of mito-ER contact in splenic ex vivo Tregs; scale bar, 2 μm. Graph shows the average number of mito-ER contact per mouse or cell. (K) Suppression of CD4+ CD25−− T cell proliferation in vitro by Tregs. Data represents mean ± SEM. * p < 0.05, ** p < 0.01, and **** p < 0.0001, using two-way ANOVA followed by Tukey for multiple comparisons (C), non-parametric Kruskal-Wallis test followed by Dunn’s multiple comparisons (vehicle vs. Tregs) and two-tailed Student’s t-test (WT vs. il21r−/− Tregs) (D, H), multiple unpaired t tests (F, G), two-tailed Student’s t-test (J), using one-way ANOVA followed by Tukey for multiple comparisons (K)

Update of

Similar articles

Cited by

References

    1. Friedrich M, Pohin M, Powrie F. Cytokine Networks in the Pathophysiology of Inflammatory Bowel Disease. Immunity 2019;50:992–1006. - PubMed
    1. Ng SC, Shi HY, Hamidi N, et al. Worldwide incidence and prevalence of inflammatory bowel disease in the 21st century: a systematic review of population-based studies. Lancet 2018;390:2769–2778. - PubMed
    1. Hirten RP, Iacucci M, Shah S, et al. Combining Biologics in Inflammatory Bowel Disease and Other Immune Mediated Inflammatory Disorders. Clin Gastroenterol Hepatol 2018;16:1374–1384. - PubMed
    1. O’Neill LA, Kishton RJ, Rathmell J. A guide to immunometabolism for immunologists. Nat Rev Immunol 2016;16:553–65. - PMC - PubMed
    1. Josefowicz SZ, Lu LF, Rudensky AY. Regulatory T cells: mechanisms of differentiation and function. Annual review of immunology 2012;30:531–64. - PMC - PubMed

Publication types

MeSH terms

Substances