

Overexpression and nonsynonymous mutations of UDP-glycosyltransferases are potentially associated with pyrethroid resistance in Anopheles funestus
- PMID: 38266739
- PMCID: PMC10963899
- DOI: 10.1016/j.ygeno.2024.110798
Overexpression and nonsynonymous mutations of UDP-glycosyltransferases are potentially associated with pyrethroid resistance in Anopheles funestus
Abstract
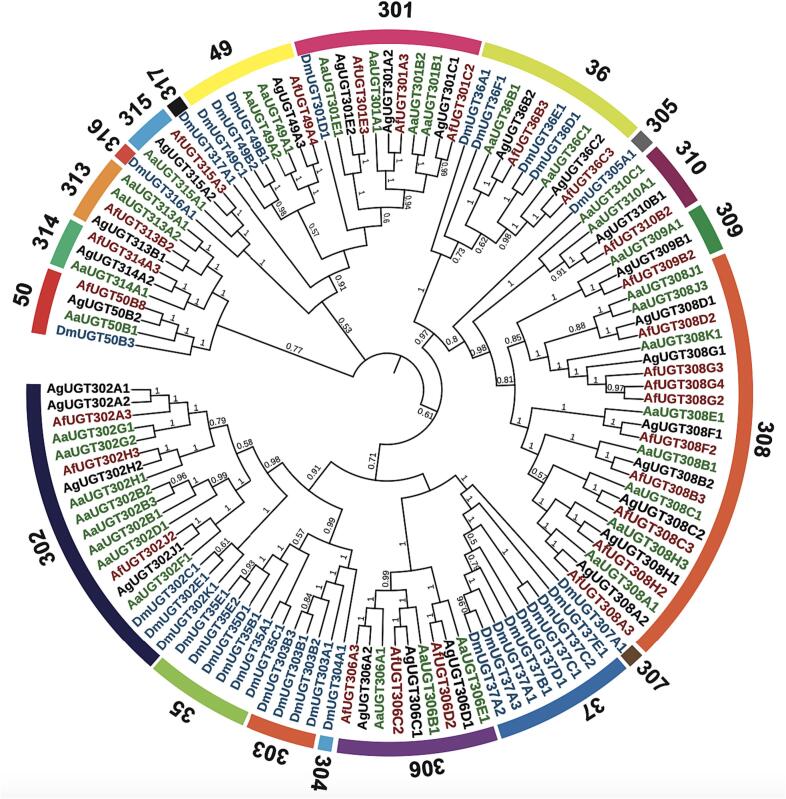
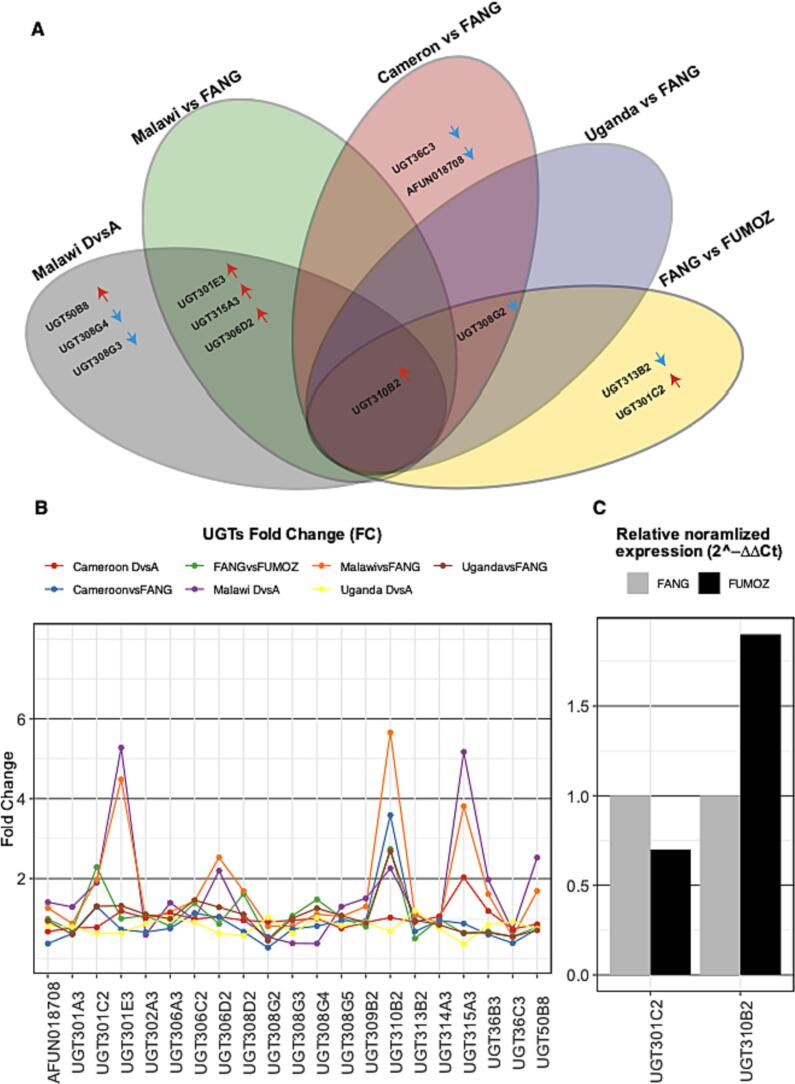
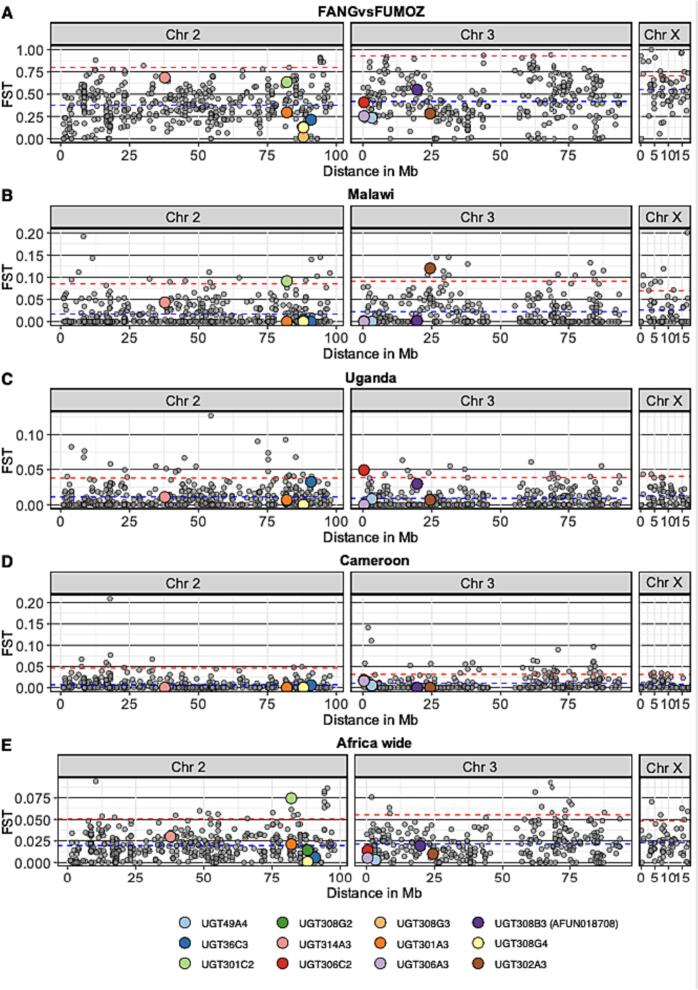
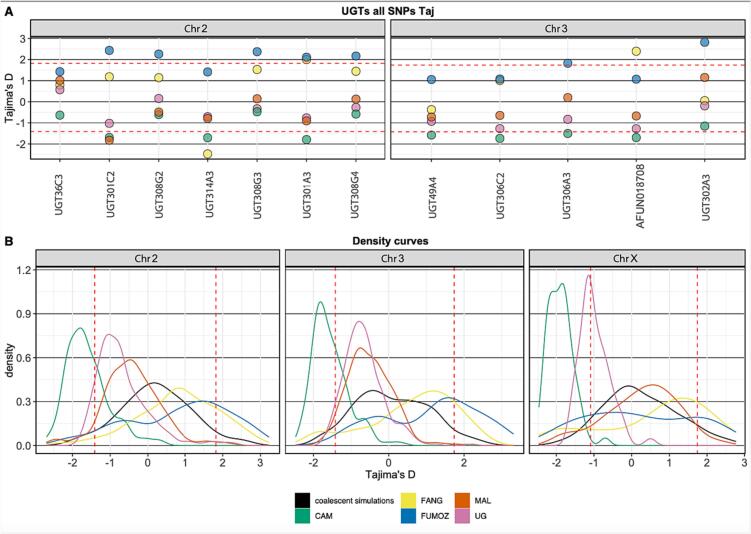
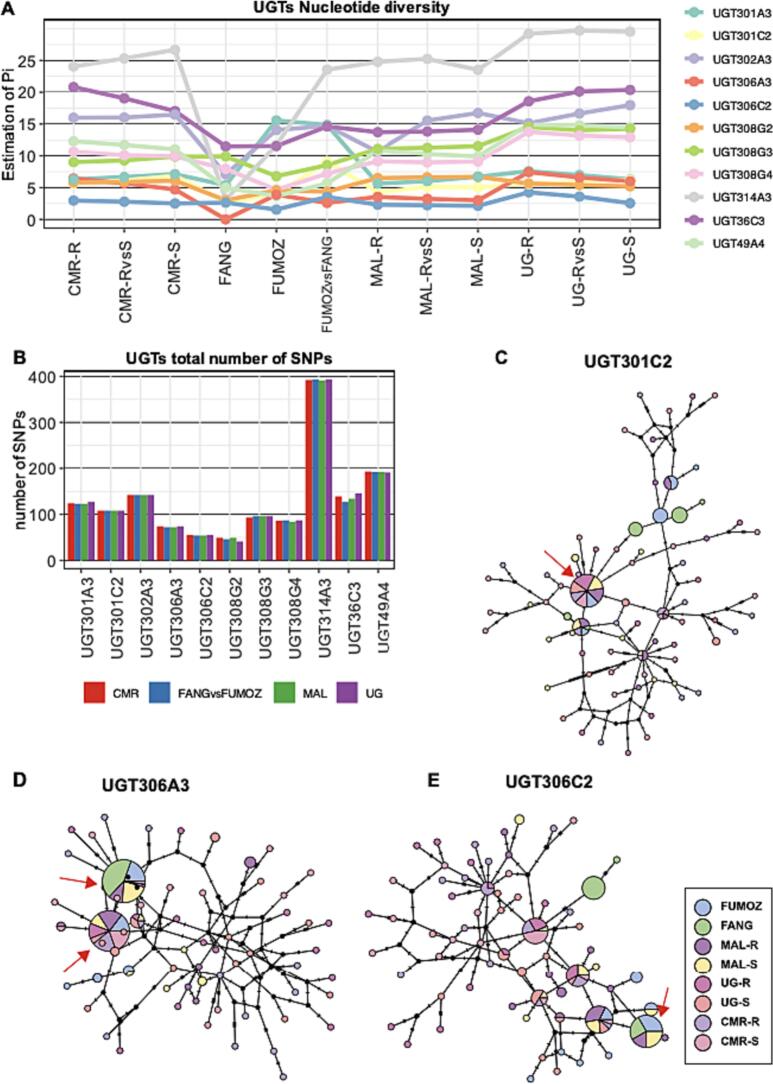
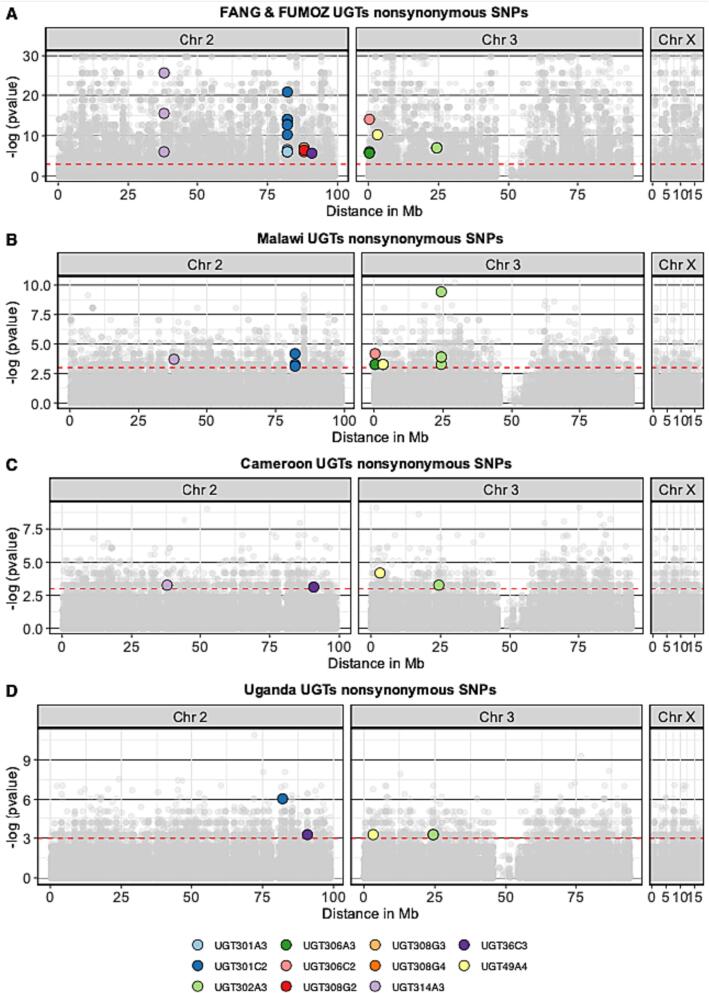
UDP-glycosyltransferases (UGTs) enzymes are pivotal in insecticide resistance by transforming hydrophobic substrates into more hydrophilic forms for efficient cell elimination. This study provides the first comprehensive investigation of Anopheles funestus UGT genes, their evolution, and their association with pyrethroid resistance. We employed a genome-wide association study using pooled sequencing (GWAS-PoolSeq) and transcriptomics on pyrethroid-resistant An. funestus, along with deep-targeted sequencing of UGTs in 80 mosquitoes Africa-wide. UGT310B2 was consistently overexpressed Africa-wide and significant gene-wise Fst differentiation was observed between resistant and susceptible populations: UGT301C2 and UGT302A3 in Malawi, and UGT306C2 in Uganda. Additionally, nonsynonymous mutations in UGT genes were identified. Gene-wise Tajima's D density curves provide insights into population structures within populations across these countries, supporting previous observations. These findings have important implications for current An. funestus control strategies facilitating the prediction of cross-resistance to other UGT-metabolised polar insecticides, thereby guiding more effective and targeted insecticide resistance management efforts.
Keywords: Genomics; Insecticide resistance; Target sequencing; Transcriptomics; UDP-glycosyltransferases; Vector control.
Copyright © 2024 The Authors. Published by Elsevier Inc. All rights reserved.
Conflict of interest statement
Declaration of competing interest The authors declare that there are no conflicts of interest.
Figures
Similar articles
-
UDP-glycosyltransferase genes and their association and mutations associated with pyrethroid resistance in Anopheles sinensis (Diptera: Culicidae).Malar J. 2019 Mar 7;18(1):62. doi: 10.1186/s12936-019-2705-2. Malar J. 2019. PMID: 30845961 Free PMC article.
-
Genome-Wide Transcription and Functional Analyses Reveal Heterogeneous Molecular Mechanisms Driving Pyrethroids Resistance in the Major Malaria Vector Anopheles funestus Across Africa.G3 (Bethesda). 2017 Jun 7;7(6):1819-1832. doi: 10.1534/g3.117.040147. G3 (Bethesda). 2017. PMID: 28428243 Free PMC article.
-
Genome-wide association studies unveil major genetic loci driving insecticide resistance in Anopheles funestus in four eco-geographical settings across Cameroon.BMC Genomics. 2024 Dec 18;25(1):1202. doi: 10.1186/s12864-024-11148-7. BMC Genomics. 2024. PMID: 39695386 Free PMC article.
-
Distribution and insecticide resistance profile of the major malaria vector Anopheles funestus group across the African continent.Med Vet Entomol. 2024 Jun;38(2):119-137. doi: 10.1111/mve.12706. Epub 2024 Feb 2. Med Vet Entomol. 2024. PMID: 38303659 Review.
-
Mutations in the voltage-gated sodium channel gene of anophelines and their association with resistance to pyrethroids - a review.Parasit Vectors. 2014 Oct 7;7:450. doi: 10.1186/1756-3305-7-450. Parasit Vectors. 2014. PMID: 25292318 Free PMC article. Review.
Cited by
-
Key gene modules and hub genes associated with pyrethroid and organophosphate resistance in Anopheles mosquitoes: a systems biology approach.BMC Genomics. 2024 Jul 3;25(1):665. doi: 10.1186/s12864-024-10572-z. BMC Genomics. 2024. PMID: 38961324 Free PMC article.
-
Proteomic Analysis of Midgut of Silkworm Reared on Artificial Diet and Mulberry Leaves and Functional Study of Three UGT Genes.Int J Mol Sci. 2025 Feb 4;26(3):1309. doi: 10.3390/ijms26031309. Int J Mol Sci. 2025. PMID: 39941077 Free PMC article.
-
Metabolic resistance to pyrethroids with possible involvement of non-coding ribonucleic acids in Anopheles funestus, the major malaria vector in western Kenya.BMC Genomics. 2025 Jan 23;26(1):64. doi: 10.1186/s12864-025-11260-2. BMC Genomics. 2025. PMID: 39849377 Free PMC article.
-
Non-Coding RNAs Potentially Involved in Pyrethroid Resistance of Anopheles funestus Population in Western Kenya.Res Sq [Preprint]. 2024 Feb 29:rs.3.rs-3979432. doi: 10.21203/rs.3.rs-3979432/v1. Res Sq. 2024. Update in: BMC Genomics. 2025 Jan 23;26(1):64. doi: 10.1186/s12864-025-11260-2. PMID: 38464038 Free PMC article. Updated. Preprint.
-
Uridine diphosphate (UDP)-glycosyltransferases (UGTs) are associated with insecticide resistance in the major malaria vectors Anopheles gambiae s.l. and Anopheles funestus.Sci Rep. 2024 Aug 27;14(1):19821. doi: 10.1038/s41598-024-70713-y. Sci Rep. 2024. PMID: 39191827 Free PMC article.
References
-
- Organization, W.H . World Health Organization; 2022. World Malaria Report 2022.
-
- Hemingway J. The way forward for vector control. Science. 2017;358(6366):998–999. - PubMed
Publication types
MeSH terms
Substances
Grants and funding
LinkOut - more resources
Full Text Sources
Miscellaneous
