Serotonin Transporter-dependent Histone Serotonylation in Placenta Contributes to the Neurodevelopmental Transcriptome
- PMID: 38266980
- PMCID: PMC10957302
- DOI: 10.1016/j.jmb.2024.168454
Serotonin Transporter-dependent Histone Serotonylation in Placenta Contributes to the Neurodevelopmental Transcriptome
Abstract
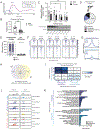
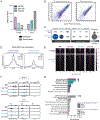
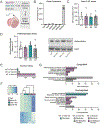
Brain development requires appropriate regulation of serotonin (5-HT) signaling from distinct tissue sources across embryogenesis. At the maternal-fetal interface, the placenta is thought to be an important contributor of offspring brain 5-HT and is critical to overall fetal health. Yet, how placental 5-HT is acquired, and the mechanisms through which 5-HT influences placental functions, are not well understood. Recently, our group identified a novel epigenetic role for 5-HT, in which 5-HT can be added to histone proteins to regulate transcription, a process called H3 serotonylation. Here, we show that H3 serotonylation undergoes dynamic regulation during placental development, corresponding to gene expression changes that are known to influence key metabolic processes. Using transgenic mice, we demonstrate that placental H3 serotonylation is dependent on 5-HT uptake by the serotonin transporter (SERT/SLC6A4). SERT deletion robustly reduces enrichment of H3 serotonylation across the placental genome, and disrupts neurodevelopmental gene networks in early embryonic brain tissues. Thus, these findings suggest a novel role for H3 serotonylation in coordinating placental transcription at the intersection of maternal physiology and offspring brain development.
Keywords: 5 total: epigenetics; H3 serotonylation; development; placenta; serotonin transporter.
Copyright © 2024 The Author(s). Published by Elsevier Ltd.. All rights reserved.
Conflict of interest statement
Declaration of competing interest The authors declare that they have no known competing financial interests or personal relationships that could have appeared to influence the work reported in this paper.
Figures


Update of
-
Serotonin transporter-dependent histone serotonylation in placenta contributes to the neurodevelopmental transcriptome.bioRxiv [Preprint]. 2023 Nov 14:2023.11.14.567020. doi: 10.1101/2023.11.14.567020. bioRxiv. 2023. Update in: J Mol Biol. 2024 Apr 1;436(7):168454. doi: 10.1016/j.jmb.2024.168454. PMID: 38014301 Free PMC article. Updated. Preprint.
Similar articles
-
Serotonin transporter-dependent histone serotonylation in placenta contributes to the neurodevelopmental transcriptome.bioRxiv [Preprint]. 2023 Nov 14:2023.11.14.567020. doi: 10.1101/2023.11.14.567020. bioRxiv. 2023. Update in: J Mol Biol. 2024 Apr 1;436(7):168454. doi: 10.1016/j.jmb.2024.168454. PMID: 38014301 Free PMC article. Updated. Preprint.
-
Maternal Inflammation Disrupts Fetal Neurodevelopment via Increased Placental Output of Serotonin to the Fetal Brain.J Neurosci. 2016 Jun 1;36(22):6041-9. doi: 10.1523/JNEUROSCI.2534-15.2016. J Neurosci. 2016. PMID: 27251625 Free PMC article.
-
Impact of Maternal Serotonin Transporter Genotype on Placental Serotonin, Fetal Forebrain Serotonin, and Neurodevelopment.Neuropsychopharmacology. 2017 Jan;42(2):427-436. doi: 10.1038/npp.2016.166. Epub 2016 Aug 23. Neuropsychopharmacology. 2017. PMID: 27550733 Free PMC article.
-
Fetal, maternal, and placental sources of serotonin and new implications for developmental programming of the brain.Neuroscience. 2011 Dec 1;197:1-7. doi: 10.1016/j.neuroscience.2011.10.005. Epub 2011 Oct 8. Neuroscience. 2011. PMID: 22001683 Free PMC article. Review.
-
Placental serotonin signaling, pregnancy outcomes, and regulation of fetal brain development†.Biol Reprod. 2020 Mar 13;102(3):532-538. doi: 10.1093/biolre/ioz204. Biol Reprod. 2020. PMID: 31711155 Free PMC article. Review.
Cited by
-
Epigenetic modulation of RIPK3 by transglutaminase 2-dependent serotonylation of H3K4me3 affects necroptosis.Cell Mol Life Sci. 2025 Apr 10;82(1):154. doi: 10.1007/s00018-025-05640-w. Cell Mol Life Sci. 2025. PMID: 40208325 Free PMC article.
-
Epigenetic Reprogramming of Cell Identity in the Rat Primary Neuron-Glia Cultures Involves Histone Serotonylation.Cells. 2025 Jun 15;14(12):905. doi: 10.3390/cells14120905. Cells. 2025. PMID: 40558532 Free PMC article.
-
Molecular determinants for recognition of serotonylated chromatin.Nucleic Acids Res. 2025 Jul 8;53(13):gkaf612. doi: 10.1093/nar/gkaf612. Nucleic Acids Res. 2025. PMID: 40637225 Free PMC article.
-
Elucidating neuroepigenetic mechanisms to inform targeted therapeutics for brain disorders.iScience. 2025 Feb 22;28(3):112092. doi: 10.1016/j.isci.2025.112092. eCollection 2025 Mar 21. iScience. 2025. PMID: 40160416 Free PMC article. Review.
-
Persistent dopamine-dependent remodeling of the neural transcriptome in response to pregnancy and postpartum.bioRxiv [Preprint]. 2025 Jun 2:2025.02.20.639313. doi: 10.1101/2025.02.20.639313. bioRxiv. 2025. PMID: 40060435 Free PMC article. Preprint.
References
-
- Sodhi MS & Elaine S-B Serotonin and brain development. Int. Rev. Neurobiol 59, 111–174 (2004). - PubMed
-
- Lidov HG & Molliver ME Immunohistochemical study of the development of serotonergic neurons in the rat CNS. Brain Res Bull 9, 559–604 (1982). - PubMed
-
- Wallace JA & Lauder JM Development of the serotonergic system in the rat embryo: An immunocytochemical study. Brain Research Bulletin 10, 459–479 (1983). - PubMed
Publication types
MeSH terms
Substances
Grants and funding
LinkOut - more resources
Full Text Sources
Molecular Biology Databases

