. 2024 Apr 1;79(4):glae022.
doi: 10.1093/gerona/glae022.

Murine Myoblasts Exposed to SYUIQ-5 Acquire Senescence Phenotype and Differentiate into Sarcopenic-Like Myotubes, an In Vitro Study

Affiliations

Murine Myoblasts Exposed to SYUIQ-5 Acquire Senescence Phenotype and Differentiate into Sarcopenic-Like Myotubes, an In Vitro Study

Laura Gerosa et al. J Gerontol A Biol Sci Med Sci. .

Abstract

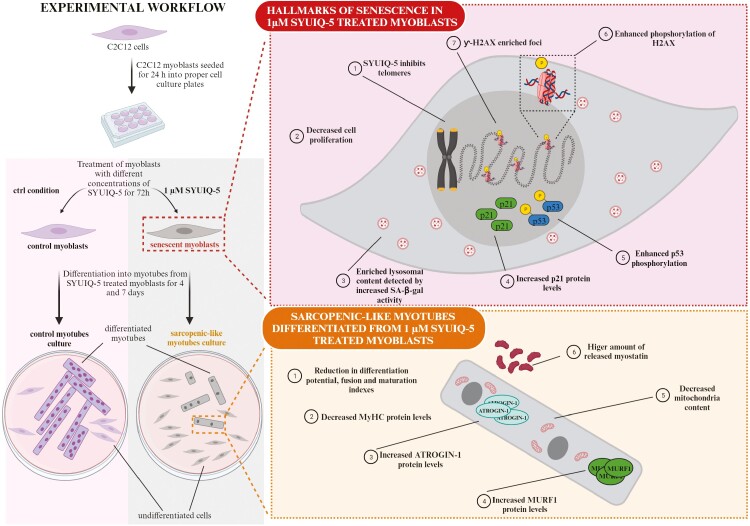
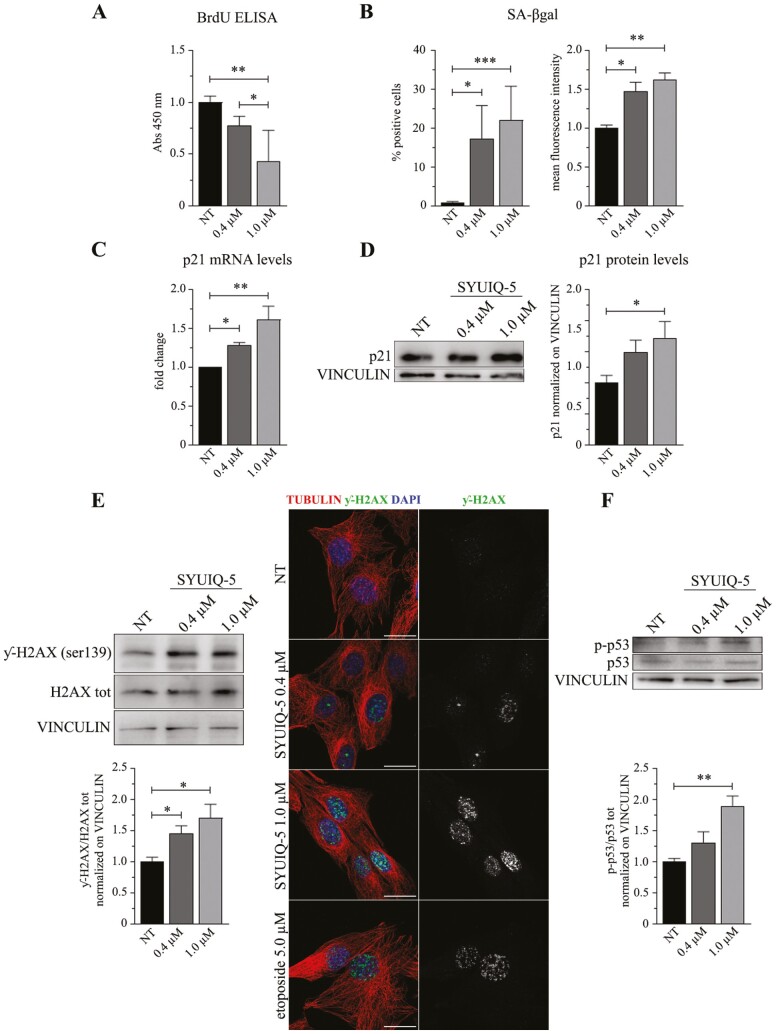
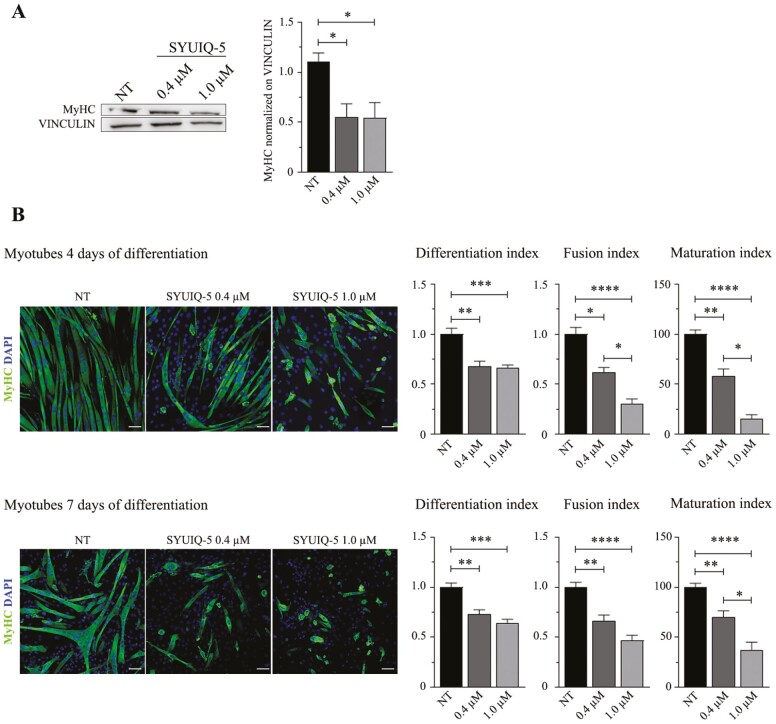
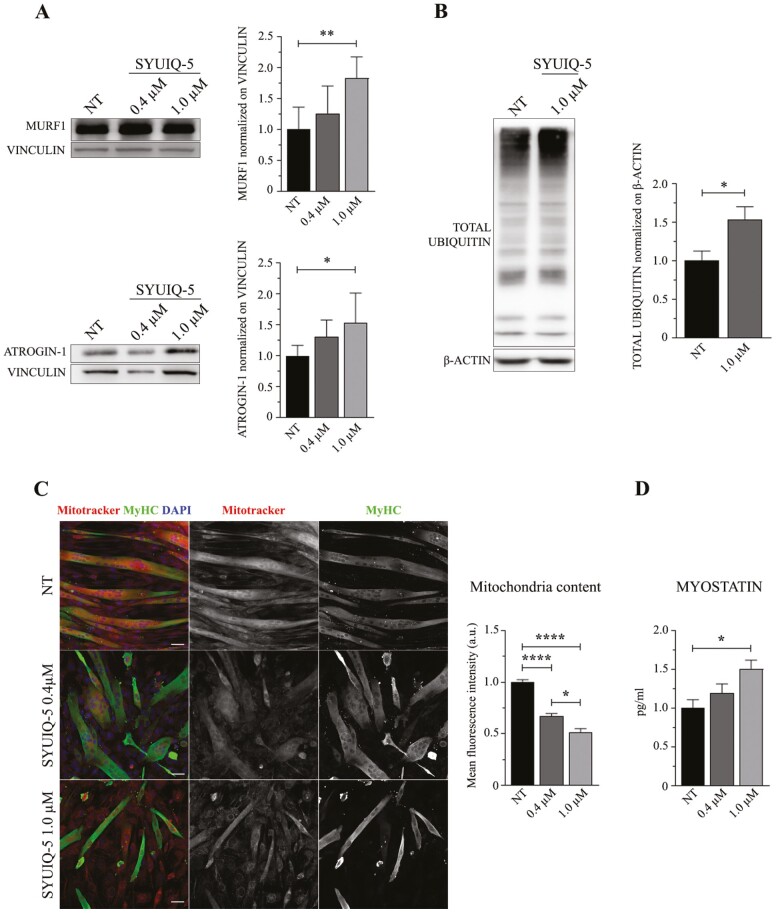
The musculoskeletal system is one of the most affected organs by aging that correlates well with an accumulation of senescent cells as for other multiple age-related pathologies. The molecular mechanisms underpinning muscle impairment because of senescent cells are still elusive. The availability of in vitro model of skeletal muscle senescence is limited and restricted to a small panel of phenotypic features of these senescent cells in vivo. Here, we developed a new in vitro model of senescent C2C12 mouse myoblasts that, when subjected to differentiation, the resulting myotubes showed sarcopenic features. To induce senescence, we used SYUIQ-5, a quindoline derivative molecule inhibitor of telomerase activity, leading to the expression of several senescent hallmarks in treated myoblasts. They had increased levels of p21 protein accordingly with the observed cell cycle arrest. Furthermore, they had enhanced SA-βgalactosidase enzyme activity and phosphorylation of p53 and histone H2AX. SYUIQ-5 senescent myoblasts had impaired differentiation potential and the resulting myotubes showed increased levels of ATROGIN-1 and MURF1, ubiquitin ligases components responsible for protein degradation, and decreased mitochondria content, typical features of sarcopenic muscles. Myotubes differentiated from senescent myoblasts cultures release increased levels of MYOSTATIN that could affect skeletal muscle cell growth. Overall, our data suggest that a greater burden of senescent muscle cells could contribute to sarcopenia. This study presents a well-defined in vitro model of muscle cell senescence useful for deeper investigation in the aging research field to discover new putative therapeutic targets and senescence biomarkers associated with the aged musculoskeletal system.

Keywords: In vitro model; SYUIQ-5; Sarcopenic myotubes; Senescence; Senescent myoblasts.


Conflict of interest statement

None.

Figures

Graphical Abstract
Graphical Abstract
Figure 1.
Figure 1.
Cytotoxic effects and murine myoblasts viability analysis after SYUIQ-5 treatments. (A) Histograms relative to LDH enzyme detection in C2C12 cells untreated (NT) or treated (0.4 μM, 0.7 μM, 1.0 μM, and 2 μM) with SYUIQ-5 for 72 h: LDH released in the supernatant (left panel) (n = 8 ns, Kruskal–Wallis test, Dunn’s multiple comparison test); LDH in cell lysates (middle panel; n = 8, NT vs 2 μM ***p = .0003, Kruskal–Wallis test, Dunn’s multiple comparison test); LDH released in supernatant normalized on LDH present in cellular lysates (right panel; n = 8, NT vs 2 μM **p = .0032, 0.4 μM vs 2 μM ** p = .0056, 0.7 μM vs 2 μM *p = .0163, Kruskal–Wallis test, Dunn’s multiple comparison test). (B) Histograms relative to Alamar Blue assay (left panel) (acute treatment: n = 4 ns, one-way ANOVA Dunnett’s multiple comparison test; chronic treatment: n = 4 ns, 1-way ANOVA Dunnett’s multiple comparison test). Histograms relative to Alamar Blue detection signal normalized on protein content (middle panel; acute treatment: n = 4 ns, 1-way ANOVA Dunnett’s multiple comparison test; chronic treatment: n = 4 ns, 1-way ANOVA Dunnett’s multiple comparison test). Histograms relative to protein content (right panel) (acute treatment: n = 4 ns, 1-way ANOVA Dunnett’s multiple comparison test; chronic treatment: n = 4 ns, 1-way ANOVA Dunnett’s multiple comparison test). Cells have been untreated (NT) or treated with SYUIQ-5 (0.4 μM, 0.7 μM, 1.0 μM, and 2.0 μM) for 2 h (acute treatment) or for 72 h (chronic treatment).
Figure 2.
Figure 2.
Hallmarks of senescence induced by SYUIQ-5 in murine myoblasts. C2C12 cells have been untreated (NT) or treated with SYUIQ-5 (0.4 μM and 1.0 μM) for 72 h and then analyzed for several senescent markers as shown in the following results: (A) histogram relative to BrdU ELISA (n = 5, NT vs 1.0 μM ***p = .0010, 0.4 μM vs 1.0 μM *p = .0282, 1-way ANOVA Tukey’s multiple comparison test). (B) FACS analysis results performed on SYUIQ-5 untreated (NT) or treated (0.4 μM and 1.0 μM) myoblasts pre-incubated with DDAOG as a fluorimetric substrate for SA-βgal enzyme and detected at 660 nm. Percentage of cells expressing SA-βgal (n = 8, NT vs 0.4 μM *p = .0174, NT vs 1.0 μM ***p = .0002, Kruskal–Wallis Dunn’s multiple comparison test); mean intensity fluorescence signal of DDAO converted from DDAOG substrate by SA-βgal enzyme (n = 8, NT vs 0.4 μM *p = .0267, NT vs 1.0 μM **p = .0012, Kruskal–Wallis Dunn’s multiple comparison test). (C) Relative mRNA levels of p21 transcript shown as fold change (n = 6, NT vs 0.4 μM *p = .0396, NT vs 1.0 μM **p = .0016, Kruskal–Wallis Dunn’s multiple comparison test). (D) Western blot analysis of cellular lysates of SYUIQ-5 treated myoblasts and quantification of p21 protein levels normalized on VINCULIN protein (n = 9, NT vs 1.0 μM *p = .0409, Kruskal–Wallis Dunn’s multiple comparison test). (E) Western blot analysis (left panel) of cellular lysates of SYUIQ-5 treated myoblasts and quantification of phosphorylated histone H2AX (ƴ-H2AX) compared to total histone H2AX and normalized on VINCULIN (n = 5, NT vs 0.4 μM *p = .0467, NT vs 1.0 μM *p = .0173, Kruskal–Wallis Dunn’s multiple comparison test). Representative confocal images of ƴ-H2AX foci enrichment in nucleus of myoblasts treated with SYUIQ-5 or with etoposide as positive control. Objective oil immersion 100×. Scale bar 10 μm. (F) Western blot analysis of cellular lysates of SYUIQ-5 treated myoblasts and quantification of phosphorylated p53 (p-p53) compared to total p53 and normalized on VINCULIN (n = 5, NT vs 1.0 μM **p = .0056, Kruskal–Wallis Dunn’s multiple comparison test).
Figure 3.
Figure 3.
SYUIQ-5 did not activate autophagy nor apoptotic pathways in C2C12 cells. C2C12 cells have been untreated (NT) or treated with SYUIQ-5 (0.4 μM and 1.0 μM) for 72 h and lysates for the following western blot analysis: (A) representative western blot images of LC3A/B signals (LC3A/B I upper band and LC3A/B II down band) and quantification of LC3A/B II cleaved fragment compared to LC3A/B I normalized on VINCULIN (n = 3 ns, Kruskal–Wallis Dunn’s multiple comparison test); (B) representative western blot images of CASPASE-7 signal (CASPASE full-length FL, 35 KDa, CASPASE-7 cleaved fragment 25 KDa indicated by arrow). Histograms relative to: quantification of cleaved CASPASE-7 compared to FL form and normalized on VINCULIN (left panel, n = 7 ns, Kruskal–Wallis Dunn’s multiple comparison test); quantification of CASPASE-7 FL normalized on VINCULIN (middle panel, n = 7 ns, Kruskal–Wallis Dunn’s multiple comparison test); quantification of cleaved CASPASE-7 fragment normalized on CASPASE-7 FL (right panel, n = 7 ns, Kruskal–Wallis Dunn’s multiple comparison test). Representative western blot images of CASPASE-3 signal and quantification of CASPASE-3 normalized on VINCULIN (n = 8 ns, Kruskal–Wallis Dunn’s multiple comparison test). (C) Fluorescence intensity detection of caspase 3/7 enzymatic activity on myoblasts untreated (NT) or treated with SYUIQ-5 (0.4 μM and 1.0 μM) or with etoposide as the positive control (n = 6–9, NT vs 1.0 μM ****p < .0001, Kruskal–Wallis Dunn’s multiple comparison test).
Figure 4.
Figure 4.
Impairment of SYUIQ-5 treated myoblasts differentiation into myotubes. (A) Representative western blot images of MyHC protein expressed in myotubes lysates differentiated for 7 d from SYUIQ-5 untreated (NT) or treated (0.4 μM and 1.0 μM) myoblasts. Histograms relative to quantification of MyHC protein levels normalized on VINCULIN (n = 6, NT vs 0.4 μM *p = .030, NT vs 1 μM *p = .0452, Kruskal–Wallis Dunn’s multiple comparison test). (B) Representative confocal images of myotubes differentiated for 4 d (top panel) or for 7 d (bottom panel) from SYUIQ-5 untreated (NT) or treated (0.4 μM and 1.0 μM) myoblasts. Cells have been immunolabeled with anti-MyHC (green channel) to count differentiated cells and nuclei have been stained with DAPI (blue channel) to count the number of nuclei. Objective 20×, scale bar, 20 μM. Histograms indicate differentiation index (DI); fusion index (FI); maturation index (MI). Histograms relative to 4 d myotubes: DI (n = 14, NT vs 0.4 μM **p = .0025, NT vs 1.0 μM ***p = .0001); FI (n = 14, NT vs 0.4 μM *p = .159, NT vs 1.0 μM ****p < .0001, 0.4 μM vs 1.0 μM *p = .0317); MI (n = 14, NT vs 0.4 μM **p = .0086, NT vs 1.0 μM ****p < .0001, 0.4 μM vs 1.0 μM *p = .0291). Histograms relative to 7 d myotubes: DI (n = 17–23, NT vs 0.4 μM **p = .0011, NT vs 1.0 μM ****p < .0001); FI (n = 17–23, NT vs 0.4 μM **p = .0019, NT vs 1.0 μM ****p < .0001); MI (n = 17–23, NT vs 0.4 μM **p = .0059, NT vs 1.0 μM ****p < .0001, 0.4 μM vs 1.0 μM *p = .0404). Statistical analysis: Kruskal–Wallis Dunn’s multiple comparison test.
Figure 5.
Figure 5.
Sarcopenic features of myotubes differentiated from senescent SYUIQ-5 treated myoblasts. (A) Representative western blot images of MURF1 and ATROGIN-1 proteins expressed in myotubes lysates differentiated for 7 d from SYUIQ-5 untreated (NT) or treated (0.4 μM and 1.0 μM) myoblasts and relative histograms of protein levels quantification normalized on VINCULIN (MURF1 histogram: n = 5–7, NT vs 1.0 μM **p = .059, 1-way ANOVA Tukey’s multiple comparison test; ATROGIN-1 histogram: n = 6, NT vs 1.0 μM *p = .0370, 1-way ANOVA Tukey’s multiple comparison test). (B) Representative western blot images of TOTAL UBIQUITIN protein expressed in myotubes differentiated for 7 d from SYUIQ-5 untreated (NT) or treated (1.0 μM) myoblasts and relative histogram of protein levels quantification normalized on β-ACTIN (n = 3, NT vs 1.0 μM *p = .0395, unpaired t test). (C) Representative confocal images of myotubes differentiated for 7 d from SYUIQ-5 untreated (NT) or treated (0.4 μM and 1.0 μM) myoblasts and incubated with MitoTracker (red channel) before being fixed. Cells have been immunolabeled with anti-MyHC (green channel) to select differentiated myoblasts and nuclei have been stained with DAPI (blue channel). Objective 20×, scale bar 20 μM. Histogram referred to mitochondria content measured as mean fluorescence intensity signal of MitoTracker (n = 47–128, NT vs 0.4 μM ****p < .0001, NT vs 1.0 μM ****p < .0001, 0.4 μM vs 1.0 μM *p = .0423, Kruskal–Wallis Dunn’s multiple comparison test). (D) Histogram of MYOSTATIN quantification in supernatant of myotubes differentiated from nontreated myoblasts (NT) and from myoblasts treated with 0.4 μM and 1.0 μM of SYUIQ-5. MYOSTATIN levels are expressed as pg/ml and detected by ELISA assay (n = 5, NT vs 1.0 μM *p = .0226, 1-way ANOVA Tukey’s multiple comparison test).

Similar articles

Cited by

References

    1. von Haehling S, Morley JE, Anker SD. An overview of sarcopenia: Facts and numbers on prevalence and clinical impact. J Cachexia Sarcopenia Muscle. 2010;1:129–133. 10.1007/s13539-010-0014-2 - DOI - PMC - PubMed
    1. Fielding RA, Vellas B, Evans WJ, et al. . Sarcopenia: an undiagnosed condition in older adults. Current consensus definition: Prevalence, etiology, and consequences. International working group on sarcopenia. J Am Med Dir Assoc. 2011;12:249–256. 10.1016/j.jamda.2011.01.003 - DOI - PMC - PubMed
    1. Gerosa L, Malvandi AM, Malavolta M, Provinciali M, Lombardi G. Exploring cellular senescence in the musculoskeletal system: Any insights for biomarkers discovery? Ageing Res Rev. 2023;88:101943. 10.1016/j.arr.2023.101943 - DOI - PubMed
    1. Baker DJ, Wijshake T, Tchkonia T, et al. . Clearance of p16Ink4a-positive senescent cells delays ageing-associated disorders. Nature. 2011;479:232–236. 10.1038/nature10600 - DOI - PMC - PubMed
    1. Hayflick L, Moorhead PS. The serial cultivation of human diploid cell strains. Exp Cell Res. 1961;25:585–621. 10.1016/0014-4827(61)90192-6 - DOI - PubMed

Publication types

Substances