. 2024 Jan 24;15(1):683.
doi: 10.1038/s41467-024-44789-z.

Rapid functional impairment of natural killer cells following tumor entry limits anti-tumor immunity

Affiliations

Rapid functional impairment of natural killer cells following tumor entry limits anti-tumor immunity

Isaac Dean et al. Nat Commun. .

Abstract

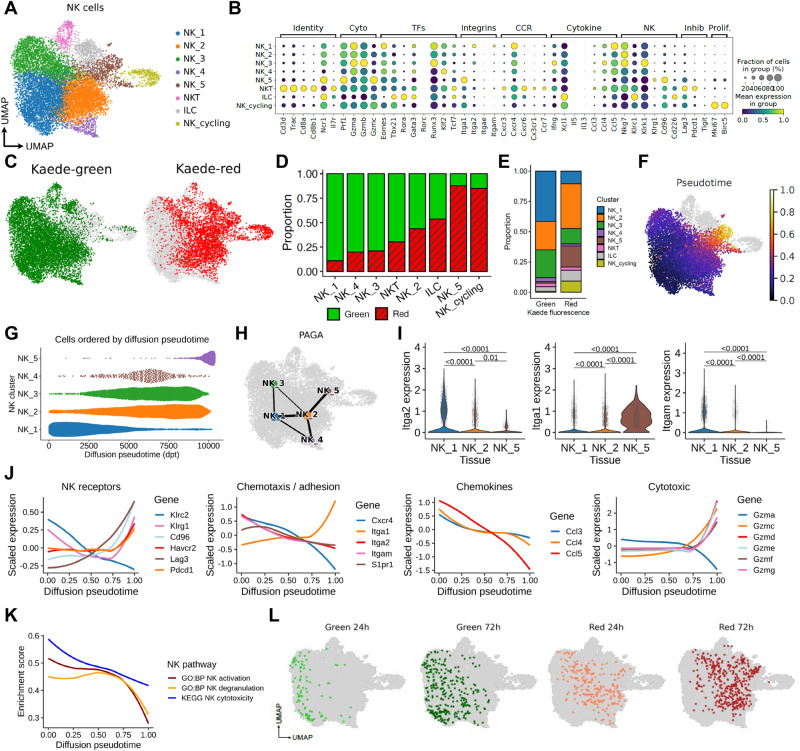
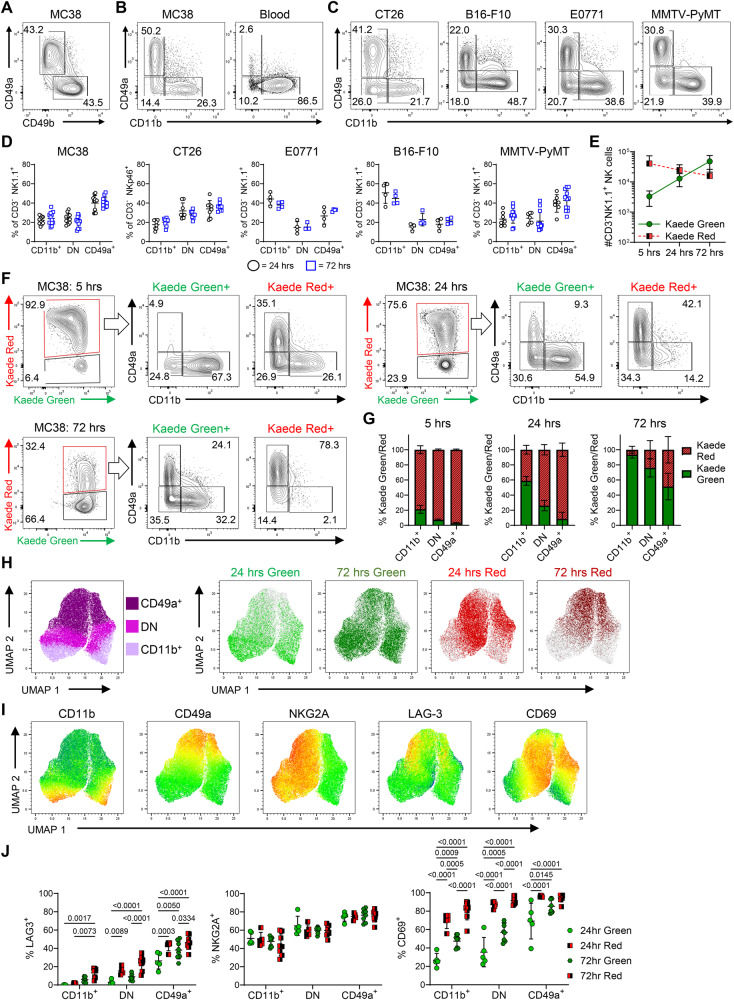
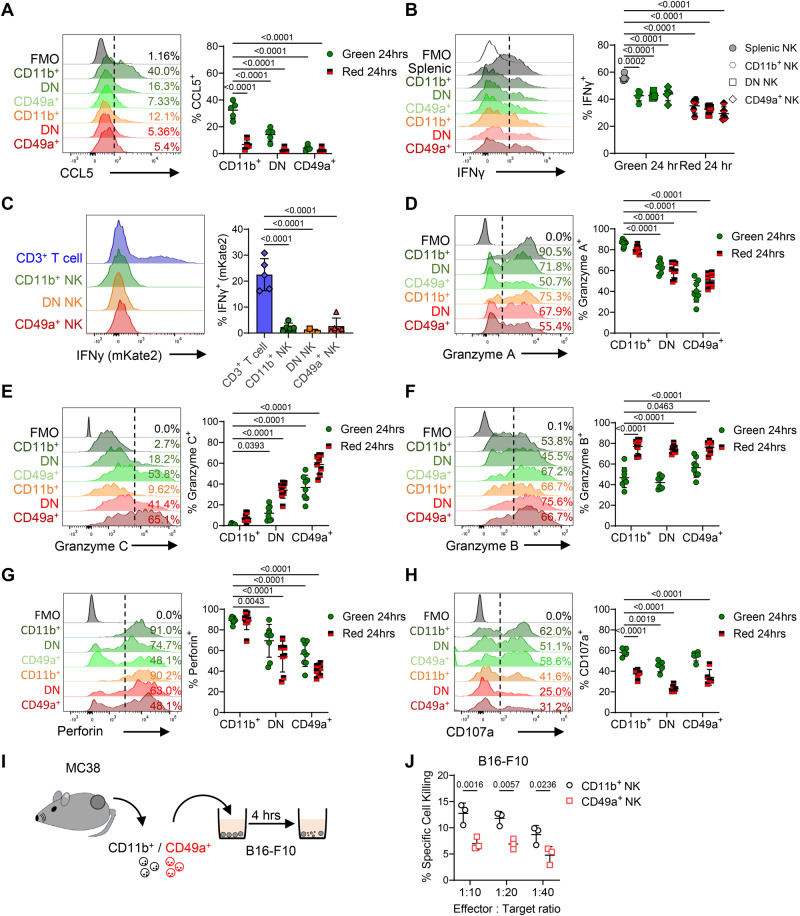
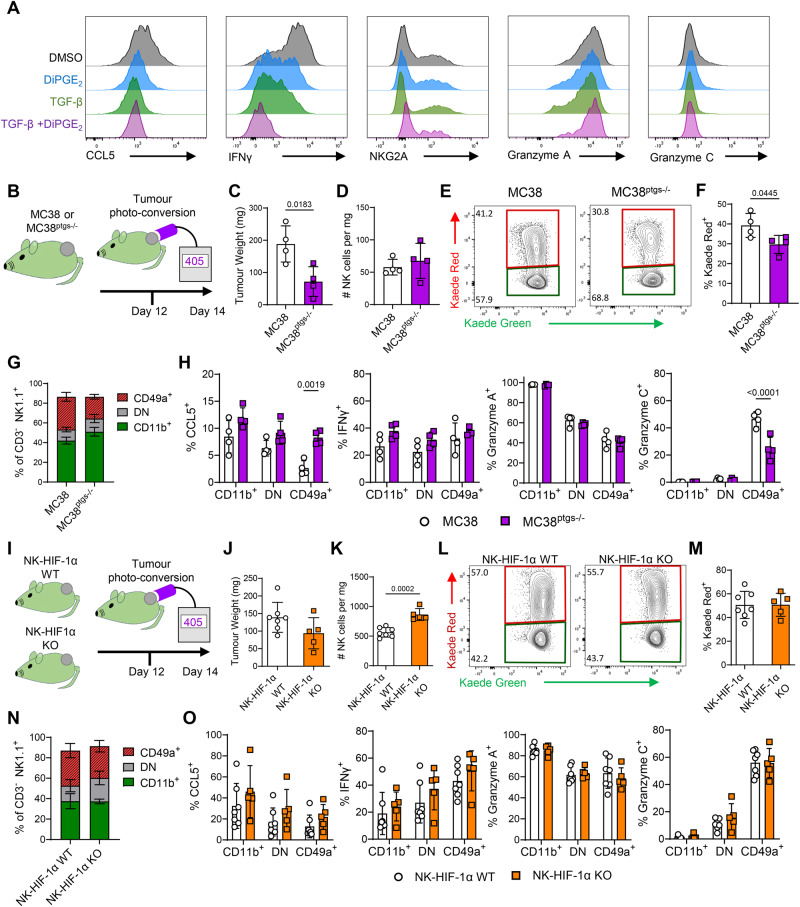
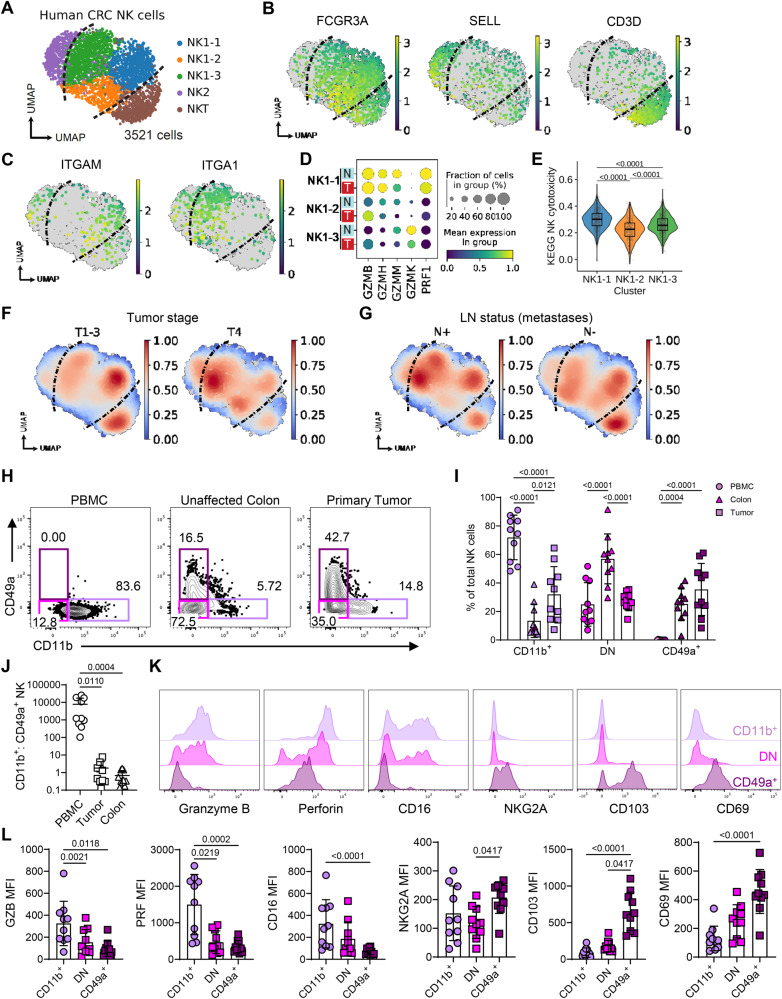
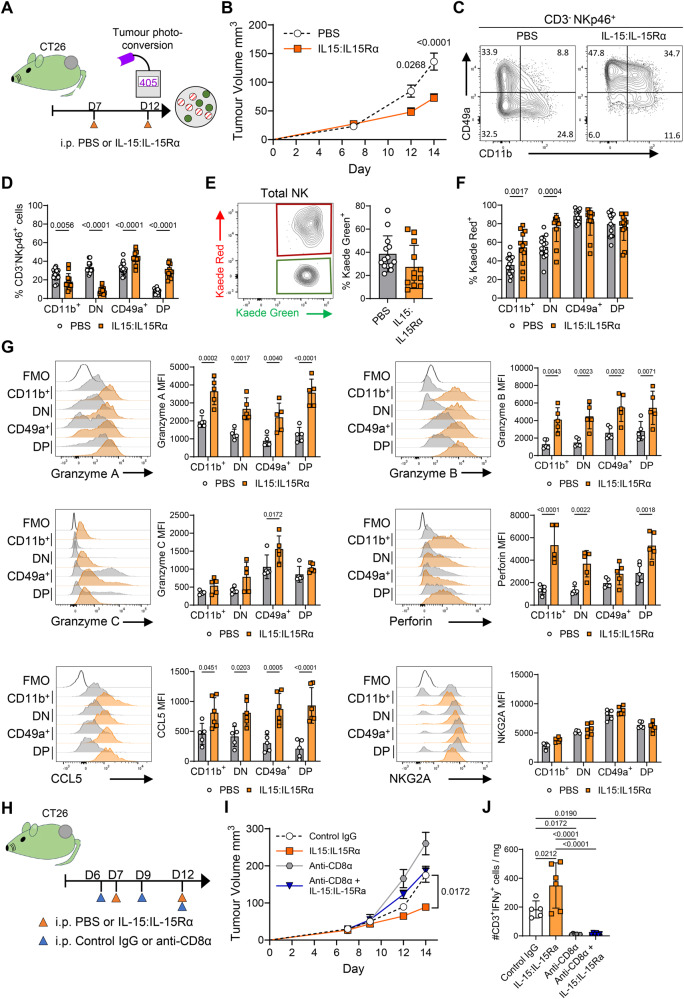
Immune cell dysfunction within the tumor microenvironment (TME) undermines the control of cancer progression. Established tumors contain phenotypically distinct, tumor-specific natural killer (NK) cells; however, the temporal dynamics, mechanistic underpinning and functional significance of the NK cell compartment remains incompletely understood. Here, we use photo-labeling, combined with longitudinal transcriptomic and cellular analyses, to interrogate the fate of intratumoral NK cells. We reveal that NK cells rapidly lose effector functions and adopt a distinct phenotypic state with features associated with tissue residency. NK cell depletion from established tumors did not alter tumor growth, indicating that intratumoral NK cells cease to actively contribute to anti-tumor responses. IL-15 administration prevented loss of function and improved tumor control, generating intratumoral NK cells with both tissue-residency characteristics and enhanced effector function. Collectively, our data reveals the fate of NK cells after recruitment into tumors and provides insight into how their function may be revived.


Conflict of interest statement

The authors declare the following competing interests: G.C., S.A.H., S.J.D. are full-time employees of AstraZeneca and own or have owned AstraZeneca stock. The remaining author declare no competing interests.

Figures

Fig. 1
Fig. 1. Rapid changes to the NK cell transcriptome after entry into the TME.
MC38 tumors, grafted subcutaneously on the flank, were photoconverted and analyzed 48 h later using droplet-based scRNA-sequencing. A UMAP showing 11,808 NK cells defined by expression of Ncr1, Prf1, Klrb1c, Fcgr3, resolved into 8 clusters comprised of NK_1 to NK_5, alongside 1 cycling cluster and two further clusters that describe ILC and NKT cells. B Dot plots showing expression of selected genes used to further characterize the clusters. C UMAP showing the distribution of Kaede Green+ and Kaede Red+ cells across the NK clusters. D The proportion of Kaede Green+ and Kaede Red+ cells within each cluster. E Proportion of each cluster within the Kaede Green+ and Kaede Red+ cells. F UMAP showing diffusion pseudotime trajectory rooted in NK_1. G Bee swarm plot of the 5 NK clusters (NK_1 to NK_5) over pseudotime. H PAGA illustrating gene expression relationship between NK clusters. I Violin plots showing expression of Iga1, Itga2, Itgam across NK_1, NK_2 and NK_5. J Differentially expressed genes over pseudotime grouped by function. K Pathway analyses characterizing changes in NK activation, degranulation, and cytotoxicity over pseudotime. L UMAPs showing integration of NK cell data after 24 and 72 h post-photoconversion with the original data derived from 48 h post-labeling. Statistical significance determined by two-sided Wilcoxon rank-sum test with Benjamini-Hochberg multiple-testing correction. Data are shown as box (median; box, 25th percentile and 75th percentile; whiskers, 1.5*inter-quartile range) and violin plots. In (J, K) data are shown as local regression (loess) fit to scaled expression values.
Fig. 2
Fig. 2. Differential expression of CD11b and CD49a capture temporal changes in NK cell phenotype.
A Expression of CD49a vs CD49b by NK cells (CD3- NK1.1+ ) isolated from MC38 tumors grafted subcutaneously on the flank. B Expression of CD49a vs CD11b by NK cells isolated from MC38 tumors, alongside blood. C Expression of CD49a vs CD11b by NK cells across multiple tumor models. NK cells identified as CD3- NK1.1+ in C57BL/6 mice, CD3- NKp46+ in BALB/c mice. D Proportion of NK cells within the CD11b+ CD49a-, CD11b- CD49a- (double negative, DN) and CD11b- CD49a+ gates across the different tumor models. Data collected from B16-F10-OVA and EO771 tumors was from 1 independent repeat, and MC38, CT26, and MMTV-PyMT tumors pooled from 2 independent repeats, where MC38 (24 h n = 12, 72 h n = 12), CT26 (24 h n = 8, 72 h n = 8), EO771 (24 h n = 4, 72 h n = 4), B16-F10-OVA (24 h n = 4, 72 h n = 4), and MMTV-PyMT (24 h n = 7, 72 h n = 12). E Number of Kaede Green+ and Kaede Red+ NK cells at 5, 24 and 72 h post photoconversion of MC38 tumors. F Expression of CD49a versus CD11b by Kaede Green+ and Kaede Red+ NK cells at 5, 24 and 72 h post photoconversion. G The proportion of Kaede Green/Red for each NK cell subset at each time point post photoconversion. Data at 5 (n = 5) h is representative of 1 independent repeat, whereas 24 (n = 8) and 72 (n = 11) h pooled from 2 independent repeats. H UMAPs showing protein expression of CD11b and CD49a alongside Kaede Green/Red expression by NK cells isolated from MC38 tumors at 24 and 72 h post photoconversion. I UMAPS showing expression of CD11b, CD49a, NKG2A, LAG-3 and CD69. J Enumeration of the proportion of cells expressing NKG2A, LAG-3 and CD69 across the NK cell subsets. Data in UMAPs 24 h (n = 5), and 72 h (n = 8) are representative of two independent repeats. Statistical significance was determined by two-way ANOVA with Šidák’s multiple comparisons test (J). Data are presented showing all individual data points as well as the mean value +/- SD. In all experiments, ‘n’ defines a single tumor on an individual mouse, i.e., n = 3 refers to 3 mice each with a single tumor.
Fig. 3
Fig. 3. NK cells rapidly change chemokine, cytokine and granzyme production within 24 h of entering the TME.
Flow cytometry was used to validate changes to the function of NK cells isolated from MC38 tumors at 24 h post photoconversion. A Proportion of NK cells producing CCL5 after ex vivo stimulation, with representative histograms alongside enumeration (n = 5). B Proportion of NK cells producing IFNγ after ex vivo stimulation, with representative histograms alongside enumeration (n = 5). C Reporting of mKate2 in using Ifnγcre/mKate2 reporter mice, with T cells versus NK cells isolated from MC38 tumors assessed. Representative histograms and the proportion of mKate2+ cells shown. Representative histograms showing proportion of NK cells producing (D) granzyme A, (E) granzyme C, (F) granzyme B, (G) CD107a, (H) Perforin in MC38 tumors that were photoconverted and analyzed 24 h later. Data pooled from 2 independent experiments (n = 8) for all analyses except CD107a expression where n = 5 from 1 independent experiment. I Cartoon showing experimental setup whereby CD11b+ and CD49a+ NK cells from MC38 tumors were FACS-isolated and co-cultured with B16-F10 melanoma cells pre-treated with cell trace violet that were then stained for cell viability. J NK-mediated target cell killing comparing cytotoxicity between FACS sorted CD11b+ and CD49a+ NK cells (n = 3). Significance was determined by two-way ANOVA with Šidák’s multiple comparison test (A, B, and DH) comparing means to Kaede Green+ CD11b+ cells, or between groups (J), and a Kruskal–Wallis test with Dunn’s multiple comparison test (C). Data are presented showing all individual data points as well as the mean value +/- SD. In all experiments ‘n’ defines a single tumor on an individual mouse, i.e., n = 3 refers to 3 mice each with a single tumor.
Fig. 4
Fig. 4. Multiple mechanisms in the TME drive the conversion of cNK cells to a tumor-retained CD49a+ state.
The role of TGFβ, PGE2 and HIF-1α were investigated in vitro and in vivo as mechanisms promoting NK cell differentiation to the tumor retained state characterized by CD49a expression and disrupted core functions. A Bar chart showing proportion of CD11b+ and CD49a+ NK cells after 48 h in culture in RPMI with IL-2/IL-15 further supplemented with TGF-β and/or DiPGE2. B Cartoon summarizing experimental design for impeding tumor produced PGE2. Kaede mice were grafted with either MC38 (n = 4) or MC38ptgs1-/- ptgs2-/- (MC38ptgs-/-, n = 4) cells, photoconverted on D12 and analyzed 48 h later. C Tumor weight. D Enumeration of NK cells per mg tumor. E Flow cytometry plots showing Kaede Green versus Kaede Red expression by NK cells. F Proportion of NK cells expressing Kaede Red label 48 h post photoconversion. G Proportion of NK cells in CD11b+ CD49a-, CD11b- CD49a- and CD11b- CD49a+ subsets. H Proportion of NK cells producing CCL5, IFNγ, granzyme A, granzyme C after ex vivo restimulation. I Cartoon summarizing experimental design for targeting Hif1a within NK cells, using Ncr1cre x Hif1af/f x Kaede mice (NK-HIF1α KO n = 5) versus cre-negative littermates (NK-HIF1α WT n = 7) grafted with MC38 tumors, photoconverted on D12 and analyzed 48 h later. J Tumor weight. K Enumeration of NK cells per mg tumor. L Flow cytometry plots showing Kaede Green versus Kaede Red expression by NK cells. M Proportion of NK cells expressing Kaede Red label 48 h post photoconversion. N Proportion of NK cells in CD11b+ CD49a-, CD11b- CD49a- and CD11b- CD49a+ subsets. O Proportion of NK cells producing CCL5, IFNγ, granzyme A, granzyme C after ex vivo restimulation. Statistical significance was determined by unpaired t tests (C, D, F, J, K, M) or two-way ANOVA with Šidák’s multiple comparison test comparing group means (H, O). Data are presented showing all individual data points as well as the mean value +/- SD.
Fig. 5
Fig. 5. NK cells in human CRC show loss of effector functions.
Evidence for dysfunctional NK cells within human CRC was sought through bioinformatics analysis of publicly available data sets alongside flowcytometric analysis of primary human CRC samples. A UMAP of 3521 NK cells from scRNA-seq of 62 human CRC samples, from GSE178341. B Expression of selected marker genes for clusters shown in ‘A’. C Expression of ITGAM and ITGA1 in NK1 subsets. D Granzyme and perforin gene expression in NK1 subsets, in tumor (T) versus normal adjacent (N) tissue. E Gene set enrichment for KEGG Natural killer cell-mediated cytotoxicity between NK1 clusters. F Gaussian kernel density embedding of cells in CRC tumors by tumor staging, and (G) lymph node (LN) metastases. H Representation flow plots depicting the frequency of CD49a+ and CD11b+ NK cells across PBMC, unaffected colon tissue and CRC primary tumor for the same donor. I Bar plot showing the frequency of CD11b+ CD49a-, CD11b- CD49a- and CD11b- CD49a+ NK cells across compartments. J Ratio of CD11b+ CD49a- to CD11b- CD49a+ NK cells across tissue compartments. K Representative histograms showing expression of selected markers on tumor infiltrating NK cell subsets. L Bar plots depicting geoMFI values for specific markers in tumor infiltrating NK cells. Statistical significance was determined by: (E) two-sided Wilcoxon rank-sum test, data are shown as box (median; box, 25th percentile and 75th percentile; whiskers, 1.5*inter-quartile range) and violin plots, (I) two-way ANOVA with Tukey’s multiple comparison test, and (J, L) Friedman test with Dunn’s multiple comparisons test. Data are presented showing all individual data points as well as the mean value +/- SD. HL describe data from 10 patients with colorectal cancer, where n = 10 and ‘n’ defines an individual patient.
Fig. 6
Fig. 6. Administration of IL15:IL15Rα complexes result in enhanced tumor control and the formation of CD49+ CD11b+ intratumoral NK cells with heightened functions.
To block loss of NK cell functions within the tumor, BALB/c Kaede mice bearing CT26 tumors were treated with IL-15:IL-15Ra complexes. A Cartoon showing experimental design. B Growth curves for CT26. C Representative flow cytometry plots expression of CD49a versus CD11b by NK cells (CD3- NKp46+ ). D Proportion of NK cells with CD11b+ CD49a-, CD11b- CD49a-, CD11b- CD49a+ , CD11b+ CD49a+ phenotype. E Representative flow cytometry plot showing Kaede Green versus Kaede Red expression by total NK cells alongside enumeration of % Kaede Green+ NK cells. F Proportion of Kaede Red+ cells within CD11b+ CD49a-, CD11b- CD49a-, CD11b- CD49a+ , CD11b+ CD49a+ subsets of NK cells. Data pooled from 3 independent experiments, (cumulative totals: PBS n = 14, IL15:IL-15Ra n = 12). G Representative histograms and enumeration of granzyme A, granzyme B, granzyme C, perforin, CCL5, and NKG2A (MFI) after ex vivo stimulation (data from 1 of 3 experiments shown, PBS n = 5 and IL-15:IL-15Rα n = 5). H Cartoon showing experimental design for CD8 T cell depletion in combination with IL-15:IL-15Ra complexes (PBS + IgG n = 5, PBS + anti-CD8α n = 6, IL-15:IL-15Rα + IgG n = 6, 15:IL-15Rα + anti-CD8α n = 6). I Tumor growth curve for experiment illustrated in (H). J Total number of NK cells per mg tumor. Statistical significance was determined by two-way ANOVA with Šidák’s multiple comparisons test (B, D, F, G and I), unpaired t test (E), or one-way ANOVA with Tukey’s multiple comparisons test (J). Data are presented showing all individual data points as well as the mean value +/- SD, except (B, I) where mean value +/- SEM are shown. In all experiments ‘n’ defines a single tumor on an individual mouse, i.e., n = 3 refers to 3 mice each with a single tumor.

References

    1. Galon J, et al. Type, density, and location of immune cells within human colorectal tumors predict clinical outcome. Science. 2006;313:1960–1964. doi: 10.1126/science.1129139. - DOI - PubMed
    1. Naito Y, et al. CD8+ T cells infiltrated within cancer cell nests as a prognostic factor in human colorectal cancer. Cancer Res. 1998;58:3491–3494. - PubMed
    1. Azimi F, et al. Tumor-infiltrating lymphocyte grade is an independent predictor of sentinel lymph node status and survival in patients with cutaneous melanoma. J. Clin. Oncol. 2012;30:2678–2683. doi: 10.1200/JCO.2011.37.8539. - DOI - PubMed
    1. Herbst RS, et al. Predictive correlates of response to the anti-PD-L1 antibody MPDL3280A in cancer patients. Nature. 2014;515:563–567. doi: 10.1038/nature14011. - DOI - PMC - PubMed
    1. Im SJ, et al. Defining CD8+ T cells that provide the proliferative burst after PD-1 therapy. Nature. 2016;537:417–421. doi: 10.1038/nature19330. - DOI - PMC - PubMed