

doi: 10.1038/s41467-023-43406-9.
Anti-correlated feature selection prevents false discovery of subpopulations in scRNAseq
Affiliations
- PMID: 38267438
- PMCID: PMC10808220
- DOI: 10.1038/s41467-023-43406-9
Item in Clipboard
Anti-correlated feature selection prevents false discovery of subpopulations in scRNAseq
Nat Commun.
.
Abstract
While sub-clustering cell-populations has become popular in single cell-omics, negative controls for this process are lacking. Popular feature-selection/clustering algorithms fail the null-dataset problem, allowing erroneous subdivisions of homogenous clusters until nearly each cell is called its own cluster. Using real and synthetic datasets, we find that anti-correlated gene selection reduces or eliminates erroneous subdivisions, increases marker-gene selection efficacy, and efficiently scales to millions of cells.
© 2024. The Author(s).
Conflict of interest statement
The authors declare no competing interests.
Figures
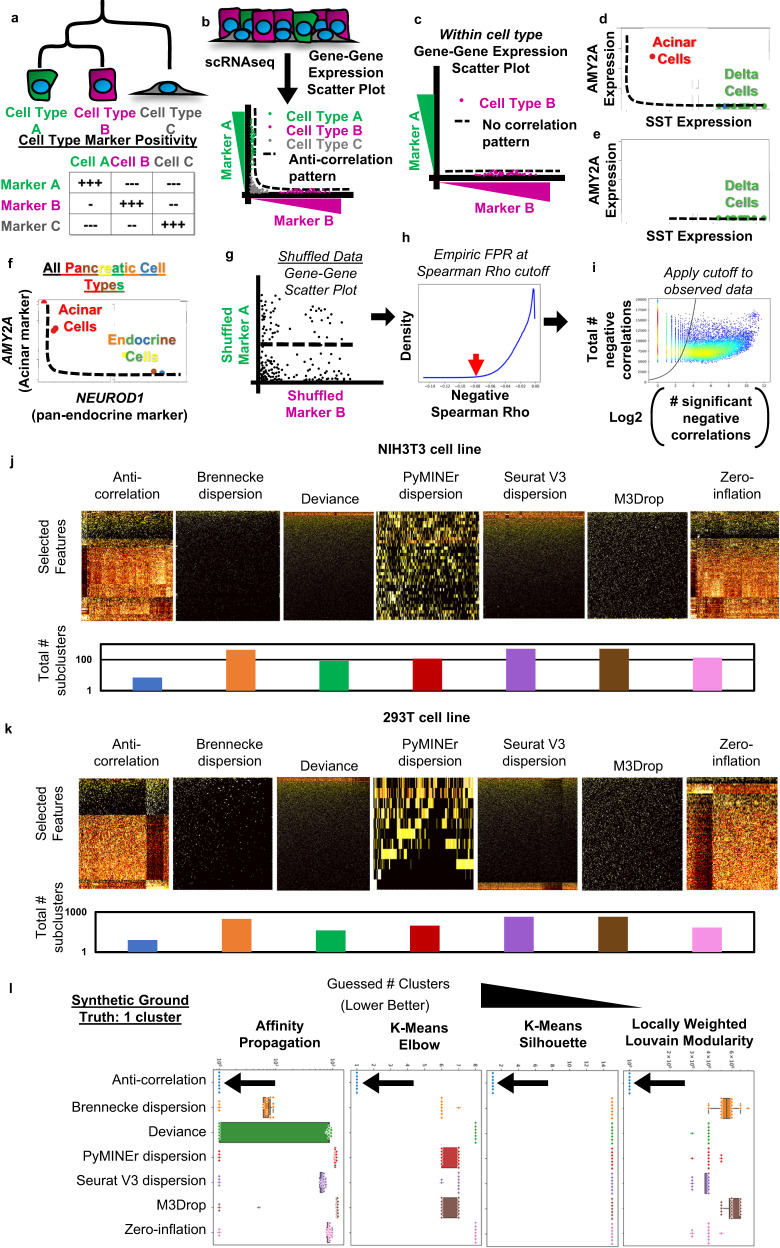
a The logical schematic behind anti-correlation-based feature selection. b As a scatter plot where expression of marker A is plotted against marker B, cells of type A and B will form an L-shaped anti-correlation pattern, while cell-type C would express low levels of both marker A and B. c This anti-correlation pattern would disappear when examining a single population of cells. d The anti-correlation pattern of marker-genes appears in an example dataset, where high expression of AMY2A in acinar cells forms an anti-correlation pattern with SST in delta cells of the pancreas. e The anti-correlation pattern between AMY2A and SST disappears when only subset for delta cells. f The anti-correlation pattern is also present in lineage-marking-genes as shown by the pattern of AMYA2 and NEUROD1, which labels all endocrine cells of the pancreas. g The anti-correlation-based feature selection algorithm first calculates a null background of Spearman correlations based on bootstrap shuffled gene-gene pairs to calculate a background. h Next the cutoff value closest matching the desired false positive rate (FPR) is determined. Displayed is a histogram of the bootstrap shuffled null-background of Spearman correlations less than zero. i Lastly genes which show more significant negative correlations (x-axis) than expected by chance (black line), given the gene’s number of total negative correlations (y-axis), are selected: i.e., those to the right of the cutoff line. These are then used to calculate the False Discovery Rate (FDR) for each gene (See Methods for details). Heatmaps of selected features, and the total number of subclusters for each method of feature selection paired with AP clustering, when algorithms were allowed to sub-divide iteratively for homeostatic cell line scRNAseq: (j) NIH3T3, (k) HEK293T. l Boxplots indicating the total number of clusters identified by each method of feature selection (box colors) and clustering (noted in panels). Boxplots show lines that extend to minimum and maximum, with the box bounds from 25th to 75th percentile, and center denoting the median (n = 20). Source data are provided as a Source Data file.

a A schematic of sub-clustering is shown in the form of UMAP projections of the original dataset (left panel), and a sub-clustering iteration of a population found in the first round of feature selection and clustering (right panel). b, c In real datasets of varying technologies, status quo algorithms fail the recursion-to-completion problem while the anti-correlation-based approach prevented recursion-to-completion. Recursive clustering plots where each point indicates a cluster at a given recursive clustering recursion-depth as denoted in successive rings and color. d Boxplots of the mean recursion depth for each of the final sub-clusters for each noted method (1-way ANOVA with 2-sided TukeyHSD poshoc). e Boxplots of the total number of groups obtained through iterative sub-clustering (1-way ANOVA with 2-sided TukeyHSD poshoc). Boxplots show lines that extend to minimum and maximum, with the box bounds from 25th to 75th percentile, and center denoting the median. (d, e: n = 4 datasets). Exact p-values for all pairwise comparisons are availabe in Source Data file. Source data are provided as a Source Data file.

a A heatmap of the top 5 marker genes per cluster are shown for the primary lineages from the full senescent Tabula Muris dataset, with the last cluster representing a mixture of cell-types from the endocrine pancreas. b When subclustered with anti-correlated feature selection, mixed-cell-type droplets (x) as well as classically described leukocyte, α, δ, β, and acinar populations were discovered. Subclustering β cells discovered mixed-lineage droplets with δ and leukocyte cells as well as the rare PP-cell population, but additional subclustering of PP-cells was prevented by anti-correlation-based feature selection. c Selected features for clustering 1-million PBMCs. d Subject-level reverse Percent Maximum Difference (rPMD), shows that Type-1-Diabetes (T1D) subjects are more similar to each other, while control PBMCs are more diverse by cluster composition. e A spring embedding of a subset of cells from each cluster, color-coded by donor, with sub-plots for T1D and control subjects, showing large-scale uniformity in T1D compared to the heterogeneous control samples. Note that this is for display purposes only, was not used in analysis, and does not represent cell-cell distances, but rather a display of the graph used for clustering. f A heatmap of PMD standardized residuals, which correspond to the significance of how different each subject’s relative abundance of all clusters differs from the null expectation of no-difference between subjects. A matching bar-chart shows the T-statistic of cluster level significance for each cluster’s differential over-under abundance shown in the heatmap, comparing T1D to controls. Bars are color-coded by significance (P < 0.05 after Benjamini-Hochberg). Exact p-values available in Source Data file. g The spring embedding of the kNN graph is color-coded by significance of differential abundance for each cluster, and additionally color-coded by T1D/control status, then again subset for only the significant clusters. Source data are provided as a Source Data file.
References
MeSH terms
Grants and funding
LinkOut - more resources
Full Text Sources
