. 2024 Jan 24;14(1):2123.
doi: 10.1038/s41598-024-51340-z.

Identification of genes with oscillatory expression in glioblastoma: the paradigm of SOX2

Affiliations

Identification of genes with oscillatory expression in glioblastoma: the paradigm of SOX2

Richard Zhiming Fu et al. Sci Rep. .

Abstract

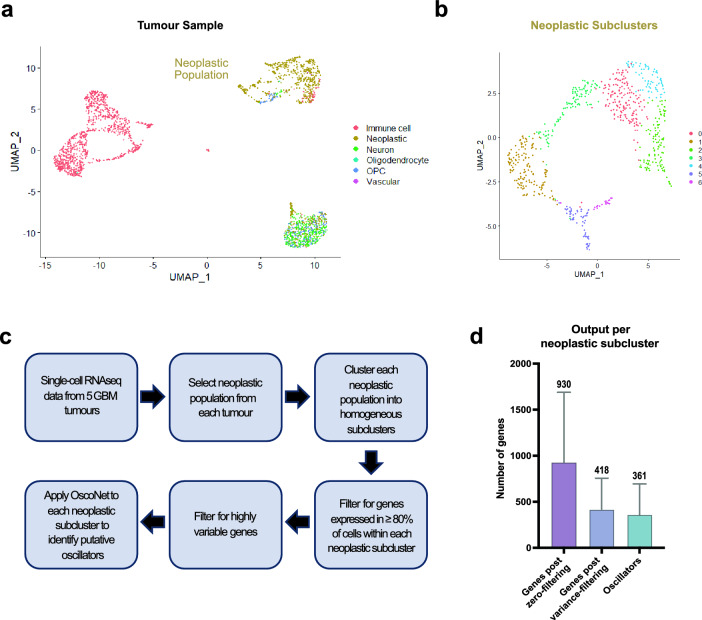
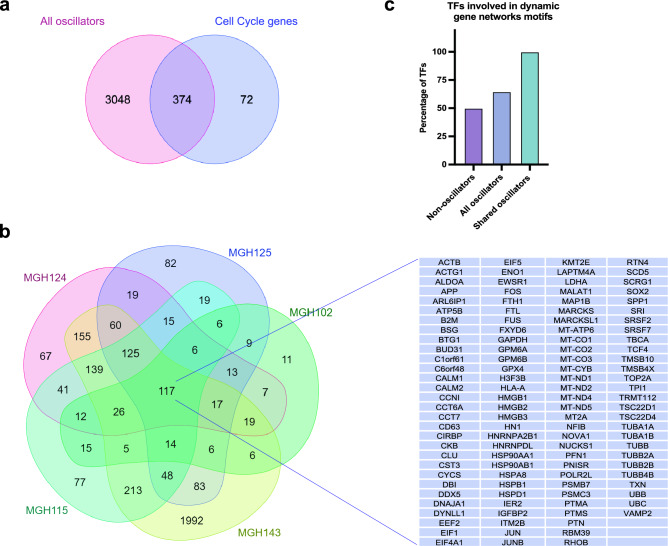
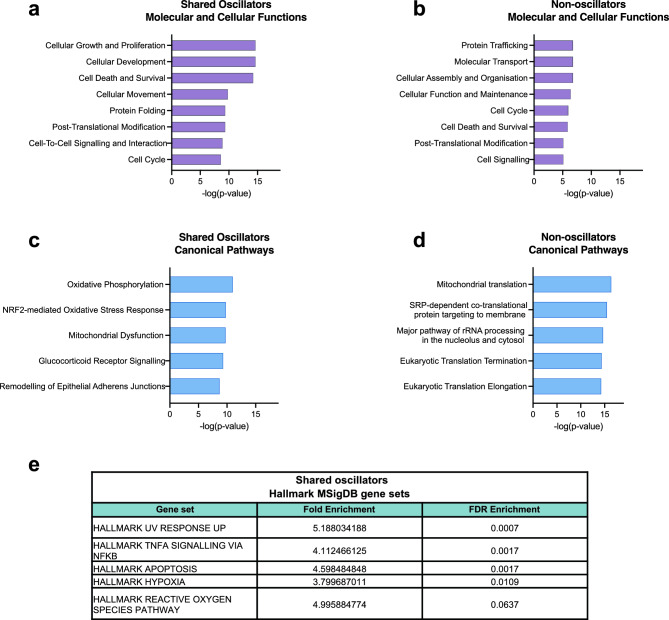
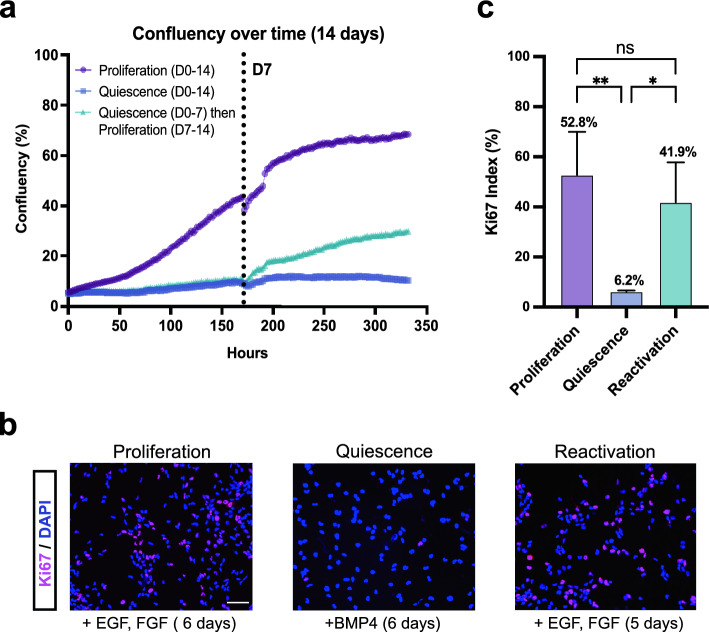
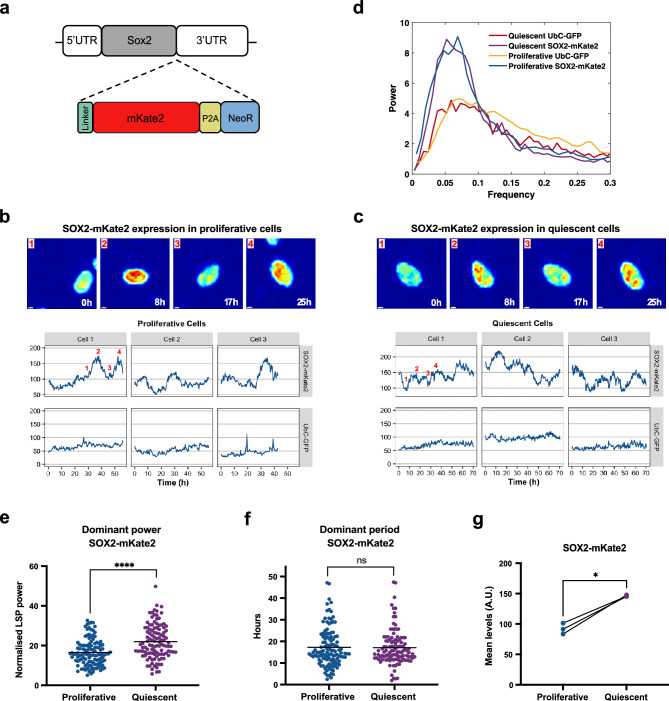
Quiescence, a reversible state of cell-cycle arrest, is an important state during both normal development and cancer progression. For example, in glioblastoma (GBM) quiescent glioblastoma stem cells (GSCs) play an important role in re-establishing the tumour, leading to relapse. While most studies have focused on identifying differentially expressed genes between proliferative and quiescent cells as potential drivers of this transition, recent studies have shown the importance of protein oscillations in controlling the exit from quiescence of neural stem cells. Here, we have undertaken a genome-wide bioinformatic inference approach to identify genes whose expression oscillates and which may be good candidates for controlling the transition to and from the quiescent cell state in GBM. Our analysis identified, among others, a list of important transcription regulators as potential oscillators, including the stemness gene SOX2, which we verified to oscillate in quiescent GSCs. These findings expand on the way we think about gene regulation and introduce new candidate genes as key regulators of quiescence.


Conflict of interest statement

The authors declare no competing interests.

Figures

Figure 1
Figure 1
Applying the OscoNet algorithm to identify oscillatory genes in GBM tumours. (A) Example UMAP (Uniform Manifold Approximation and Projection) plot representing all single cells in tumour MGH124. Cells belonging to different clusters (neoplastic and non-neoplastic) are identified by different colours (B) Example UMAP plot of the neoplastic population of tumour MGH124 showing the clustering of the cells into 7 neoplastic subclusters based on differential gene expression. Different clusters are identified by different colours. (C) Diagram showing the sequential steps followed to process the tumour scRNA-seq data prior to subjecting them to inference analysis for oscillatory gene expression using OscoNet. (D) Bar graph showing the average number of genes across all neoplastic subclusters across all tumours for each of the pre-processing steps prior to inference analysis for oscillatory gene expression and following inference analysis with OscoNet. Error bars represent standard deviation.
Figure 2
Figure 2
Inferred oscillators enrich for cell cycle genes and are involved in dynamic gene network motifs. (A) Venn diagram showing the overlap of “All oscillators” from all 5 tumours (3422 genes) with cell cycle regulators (expressed in at least one tumour) (446 genes). The hypergeometric probability was estimated to be 0.047. (B) Venn diagram showing the overlap of all predicted oscillators in each tumour and across all 5 tumours. Table shows the names of 117 oscillators identified to be shared across all tumours. (C) Bar graph showing the percentage of TFs in the “Non-oscillators”, “All oscillators” and “Shared oscillators” lists that are involved in a dynamic gene network motif.
Figure 3
Figure 3
Shared oscillators across the GBM tumours enrich for processes that contribute to cancer pathogenesis. (A,B) Bar graphs showing significantly enriched molecular and cellular functions in the lists of "Shared oscillators” (117 genes) (A) and “Non-oscillators” (643 genes) (B). (C,D) Bar graphs showing significantly enriched canonical pathways in the lists of “Shared oscillators” (C) and “Non-oscillators” (D). (E) Table showing the fold enrichment and FDR enrichment of “Shared oscillators” for MSigDB Hallmark gene sets. Fold enrichment refers to the percentage of genes in the “Shared oscillators” list that belong in each gene set, divided by the corresponding percentage in the background list. The FDR enrichment reports the hypergeometric test value.
Figure 4
Figure 4
Identification of oscillatory TFs in quiescent/low-cycling GBM tumour cells. (A) Venn diagram showing the overlap of “Shared oscillators” (117 genes) with the list of all human TFs (1639 genes) and with the Neural G0 Signature list (553 genes). 6 genes (shown in the table) where identified as common across all three lists. (B) Venn diagram showing the overlap of “Shared oscillators” in low-cycling neoplastic subclusters (99 genes) with the list of all human TFs (1639 genes). 6 genes (shown in the table) where identified as common between the two lists. (C) Venn diagram showing the overlap of the shared oscillatory TFs in Neural G0 signature with the shared oscillatory TFs in low-cycling neoplastic subclusters.
Figure 5
Figure 5
Inducing quiescence in GSCs. (A) Cell confluency analysis of GBM1 cells over a period of 14 days under 3 different conditions: Proliferation (cells cultured in proliferative media for 14 days), quiescence (cells cultured in quiescent media for 14 days) and reactivation (cells cultured in quiescent media for 7 days and then replaced by proliferative media for another 7 days). Vertical dotted line shows the time of media change for each condition with their respective media. (B) Immunofluorescence staining images of GBM1 cells for the proliferation marker Ki67 under 3 different conditions: proliferation (cells cultured in proliferative media for 6 days), quiescence (cells cultured in quiescent media for 6 days) and reactivation (cells were cultured in quiescent media for 6 days replaced by proliferative media for 5 days). Cells were also counterstained for DAPI (scale bar = 50 μm). (C) Bar graph showing the mean percentage of Ki67 positive cells under proliferative, quiescent and reactivated conditions (error bars represent standard deviation, n = 3 biological experiments, total number of cells counted per condition Proliferation = 5448 cells, Quiescence = 3038 cells, Reactivation = 5828 cells, One-way ANOVA with Tukey’s multiple comparison test, proliferation versus quiescence **p = 0.008, quiescence versus reactivation *p = 0.021, proliferation versus reactivation ns not significant).
Figure 6
Figure 6
SOX2 oscillates in proliferative and quiescent GSCs. (A) Schematic representation of the SOX2 locus following genome editing with CRISPR/Cas9. A DNA sequence encoding for a linker protein, the mKate2 fluorescence protein followed by a P2A sequence and the neomycin resistance gene, has been inserted downstream of the SOX2 exon and upstream of the 3’UTR. (B,C) Example snapshot images of SOX2-mKate2 expression in GBM1 cells in proliferative (B) and quiescent (C) conditions (top panels). Warm colours represent high expression and cold colours represent low expression (scale bar = 3 μm). Example cell traces showing SOX2-mKate2 and UbC-GFP expression over time in the same cell in GBM1 SOX2-mKate2 cells carrying a UbC-GFP reporter (A.U. = arbitrary units) (bottom panels). Numbers in Cell 1 in each condition indicate the timepoints that correspond to the images in the top panels. (D) Lomb-scargle periodogram (LSP) showing peaks in the power spectrum from SOX2-mKate2 and UbC-GFP expression in proliferative and quiescent conditions in GBM1 cells (averaged across all cell traces per protein expression per condition). SOX2-mKate2 expression shows a stronger peak in both proliferative and quiescent conditions compared to UbC-GFP (EG) Graphs showing the dominant power (E) and dominant period (F) (as determined by LSP), and the mean protein expression levels for SOX2-mKate2 in proliferative and quiescent conditions (in (E) and (F) black horizontal lines represent mean, Mann–Whitney test, two-tailed, ****p < 0.0001, ns = not significant, in (G) dots represent mean levels per experiment, paired t-test, two-tailed, *p = 0.012, n = 3 biological experiments, total number of cells tracked: Proliferative = 119, Quiescent = 112).

References

    1. Marescal O, Cheeseman IM. Cellular mechanisms and regulation of quiescence. Dev. Cell. 2020;55:259–271. doi: 10.1016/j.devcel.2020.09.029. - DOI - PMC - PubMed
    1. de Morree A, Rando TA. Regulation of adult stem cell quiescence and its functions in the maintenance of tissue integrity. Nat. Rev. Mol. Cell Biol. 2023;24:334–354. doi: 10.1038/s41580-022-00568-6. - DOI - PMC - PubMed
    1. Lee SH, Reed-Newman T, Anant S, Ramasamy TS. Regulatory role of quiescence in the biological function of cancer stem cells. Stem Cell Rev. Rep. 2020;16:1185–1207. doi: 10.1007/s12015-020-10031-8. - DOI - PubMed
    1. Bruschini S, Ciliberto G, Mancini R. The emerging role of cancer cell plasticity and cell-cycle quiescence in immune escape. Cell Death Dis. 2020;11:471. doi: 10.1038/s41419-020-2669-8. - DOI - PMC - PubMed
    1. Talukdar S, et al. Dormancy and cancer stem cells: An enigma for cancer therapeutic targeting. Adv. Cancer Res. 2019;141:43–84. doi: 10.1016/bs.acr.2018.12.002. - DOI - PubMed

Substances