

Identification and characterization of TOR in Macrobrachium rosenbergii and its role in muscle protein and lipid production
- PMID: 38267514
- PMCID: PMC10810085
- DOI: 10.1038/s41598-023-50300-3
Identification and characterization of TOR in Macrobrachium rosenbergii and its role in muscle protein and lipid production
Abstract
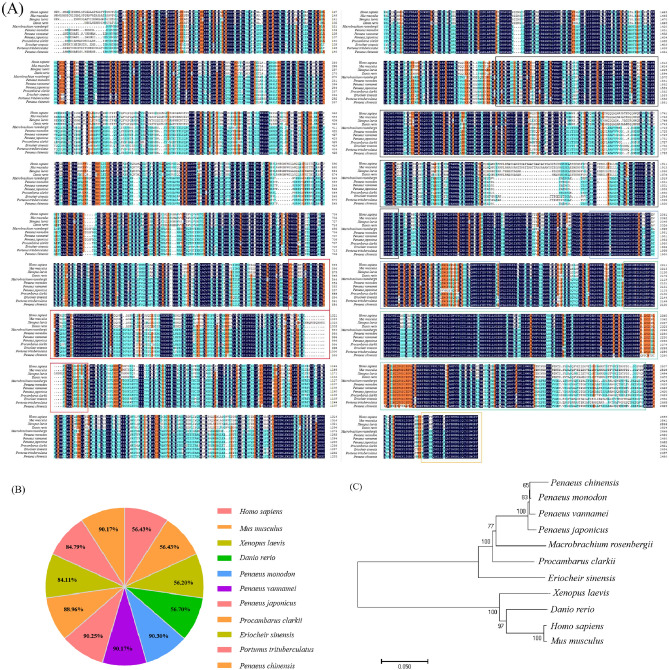
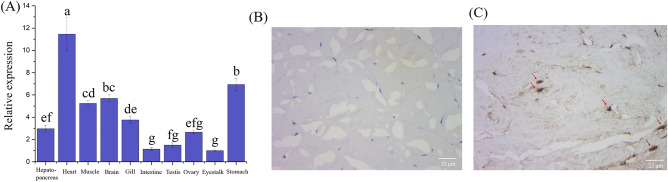
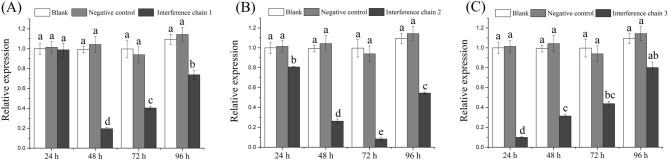
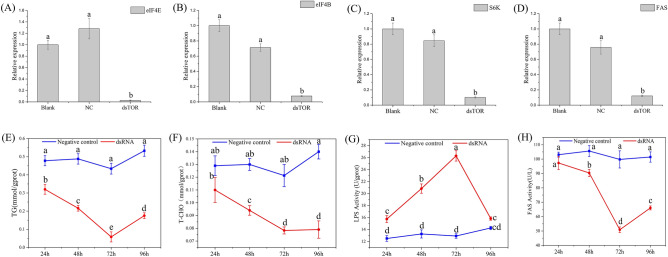
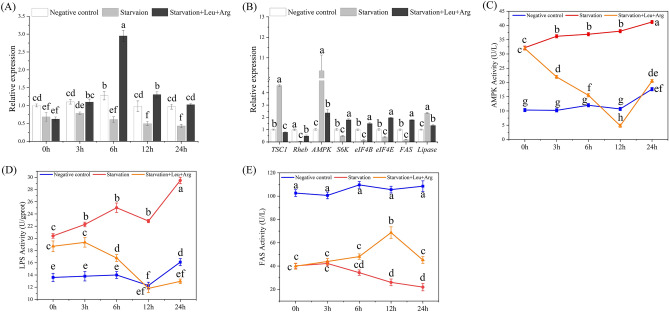
The recent scarcity of fishmeal and other resources means that studies on the intrinsic mechanisms of nutrients in the growth and development of aquatic animals at the molecular level have received widespread attention. The target of rapamycin (TOR) pathway has been reported to receive signals from nutrients and environmental stresses, and regulates cellular anabolism and catabolism to achieve precise regulation of cell growth and physiological activities. In this study, we cloned and characterized the full-length cDNA sequence of the TOR gene of Macrobrachium rosenbergii (MrTOR). MrTOR was expressed in all tissues, with higher expression in heart and muscle tissues. In situ hybridization also indicated that MrTOR was expressed in muscle, mainly around the nucleus. RNA interference decreased the expression levels of MrTOR and downstream protein synthesis-related genes (S6K, eIF4E, and eIF4B) (P < 0.05) and the expression and enzyme activity of the lipid synthesis-related enzyme, fatty acid synthase (FAS), and increased enzyme activity of the lipolysis-related enzyme, lipase (LPS). In addition, amino acid injection significantly increased the transcript levels of MrTOR and downstream related genes (S6K, eIF4E, eIF4B, and FAS), as well as triglyceride and total cholesterol tissue levels and FAS activity. Starvation significantly increased transcript levels and enzyme activities of adenylate-activated protein kinase and LPS and decreased transcript levels and enzyme activities of FAS, as well as transcript levels of MrTOR and its downstream genes (P < 0.05), whereas amino acid injection alleviated the starvation-induced decreases in transcript levels of these genes. These results suggested that arginine and leucine activated the TOR signaling pathway, promoted protein and lipid syntheses, and alleviated the pathway changes induced by starvation.
© 2024. The Author(s).
Conflict of interest statement
The authors declare no competing interests.
Figures


Similar articles
-
Acetate regulates milk fat synthesis through the mammalian target of rapamycin/eukaryotic initiation factor 4E signaling pathway in bovine mammary epithelial cells.J Dairy Sci. 2021 Jan;104(1):337-345. doi: 10.3168/jds.2020-18246. Epub 2020 Nov 12. J Dairy Sci. 2021. PMID: 33189285
-
Increased milk protein synthesis in response to exogenous growth hormone is associated with changes in mechanistic (mammalian) target of rapamycin (mTOR)C1-dependent and independent cell signaling.J Dairy Sci. 2013 Apr;96(4):2327-2338. doi: 10.3168/jds.2012-6267. Epub 2013 Feb 22. J Dairy Sci. 2013. PMID: 23462168
-
Effects of Starvation and Refeeding on Glucose Metabolism and Immune Responses in Macrobrachium rosenbergii.Mar Biotechnol (NY). 2023 Jun;25(3):447-462. doi: 10.1007/s10126-023-10218-3. Epub 2023 May 30. Mar Biotechnol (NY). 2023. PMID: 37249812
-
Regulation of muscle protein synthesis during sepsis and inflammation.Am J Physiol Endocrinol Metab. 2007 Aug;293(2):E453-9. doi: 10.1152/ajpendo.00204.2007. Epub 2007 May 15. Am J Physiol Endocrinol Metab. 2007. PMID: 17505052 Review.
-
Signaling by target of rapamycin proteins in cell growth control.Microbiol Mol Biol Rev. 2005 Mar;69(1):79-100. doi: 10.1128/MMBR.69.1.79-100.2005. Microbiol Mol Biol Rev. 2005. PMID: 15755954 Free PMC article. Review.
References
-
- Ai, C.X. Research progress in molecular nutriology of aquatic animal. Fujian J. Agricult. Sci. 10.19303/j.issn.1008-0384.2005.s1.013. (2005).
-
- Wang, J.Y. & Wang, X.H. The research development of molecular Nutriology. Mod. Chem. Res. 96–97. 10.3969/j.issn.1672-8114.2017.02.052. (2017).
-
- Sun, C.H. Development of nutrition science:retrospect and prospect. Chin. J. Prev. Med. 23–24. 10.3760/j:issn:0253-9624.2003.05.012. (2003).
-
- Xin, F. et al. Mechanistic target of rapamycin signaling in aquatic animals. Marine Sci.40, 147–154. 10.11759/hykx20150115001. (2016).
MeSH terms
Substances
Grants and funding
- G2021-02-08-00-12-F00748/Shanghai Agriculture Applied Technology Development Program
- G2021-02-08-00-12-F00748/Shanghai Agriculture Applied Technology Development Program
- G2021-02-08-00-12-F00748/Shanghai Agriculture Applied Technology Development Program
- G2021-02-08-00-12-F00748/Shanghai Agriculture Applied Technology Development Program
- G2021-02-08-00-12-F00748/Shanghai Agriculture Applied Technology Development Program
LinkOut - more resources
Full Text Sources
Research Materials
Miscellaneous
