. 2024 Mar;27(3):433-448.
doi: 10.1038/s41593-023-01558-3. Epub 2024 Jan 24.

Oligodendrocyte-axon metabolic coupling is mediated by extracellular K+ and maintains axonal health

Affiliations

Oligodendrocyte-axon metabolic coupling is mediated by extracellular K+ and maintains axonal health

Zoe J Looser et al. Nat Neurosci. 2024 Mar.

Abstract

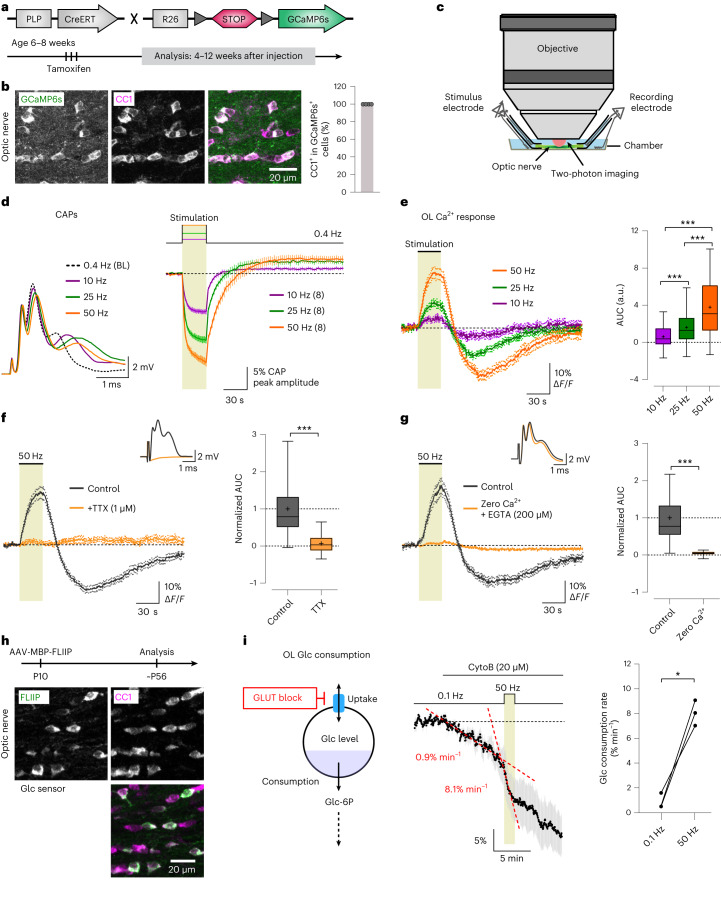
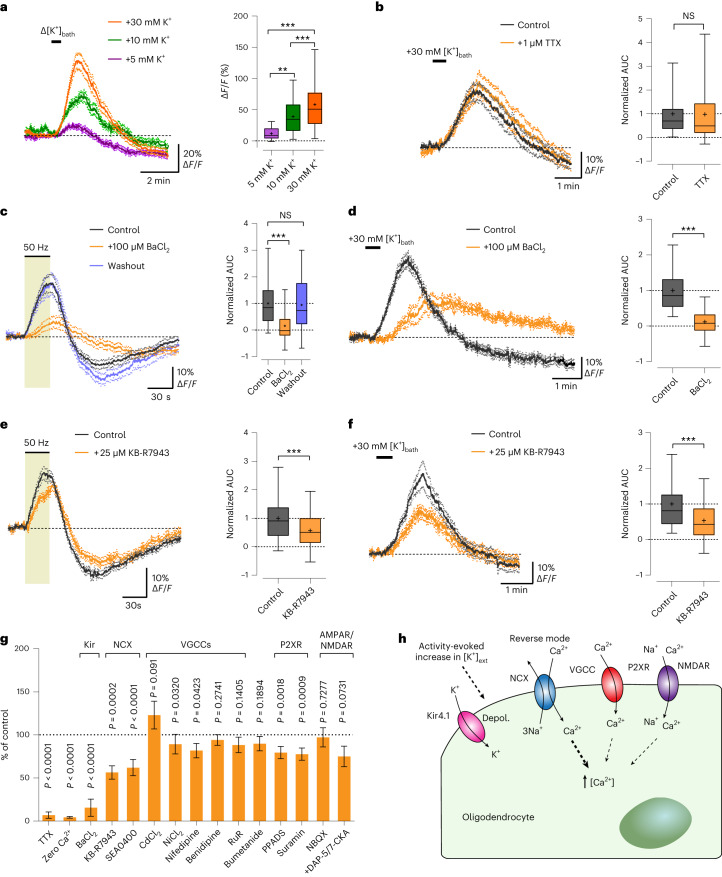
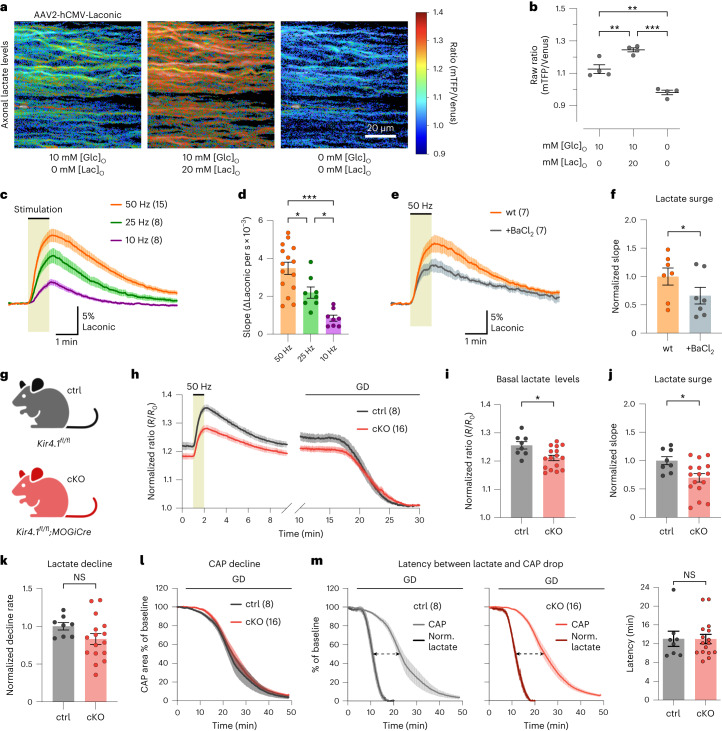
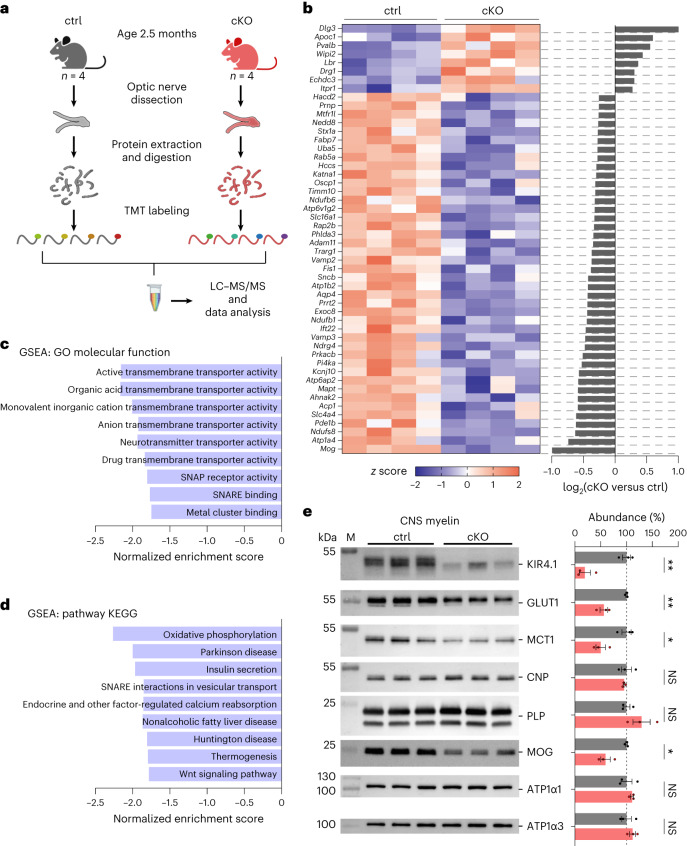
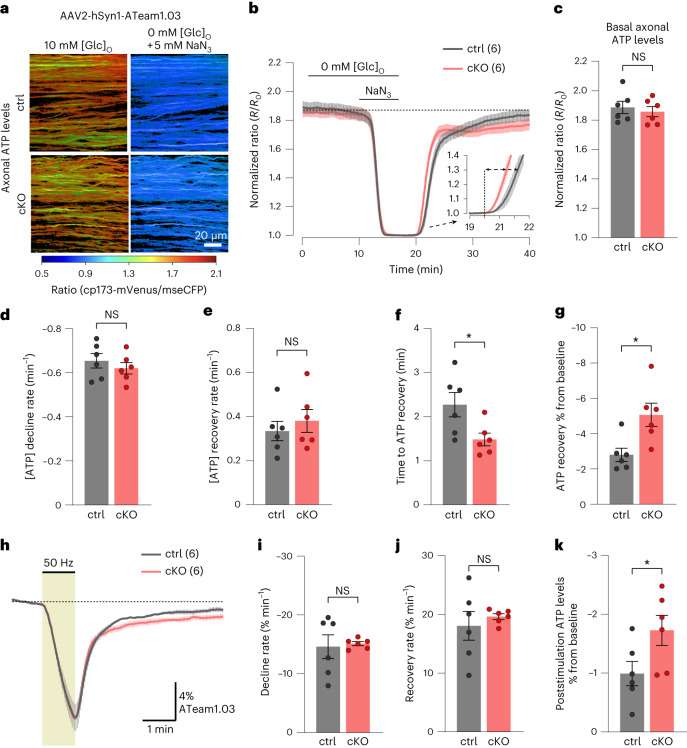
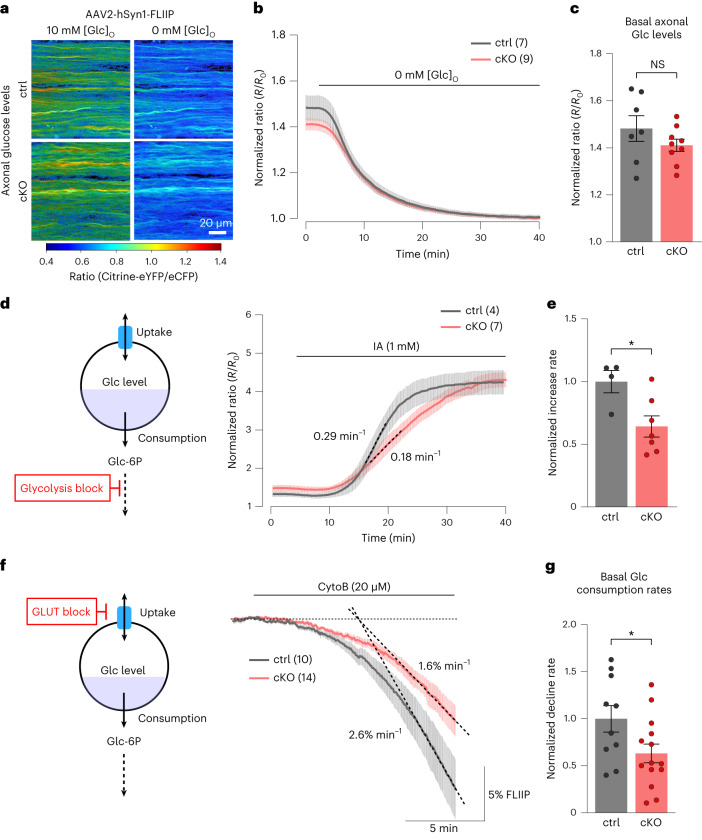
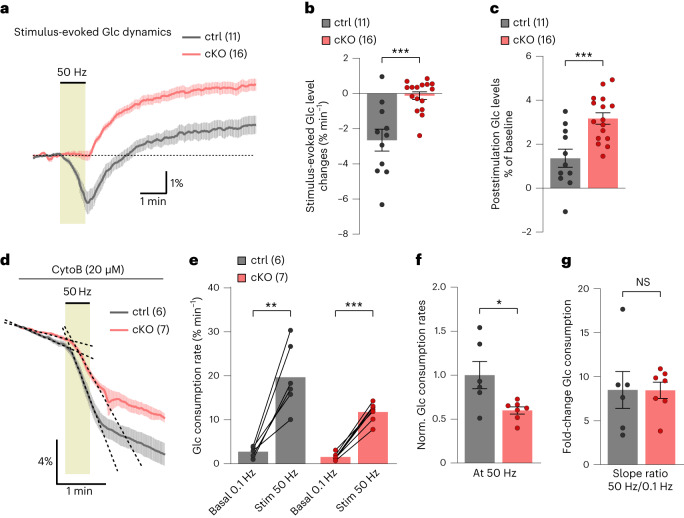
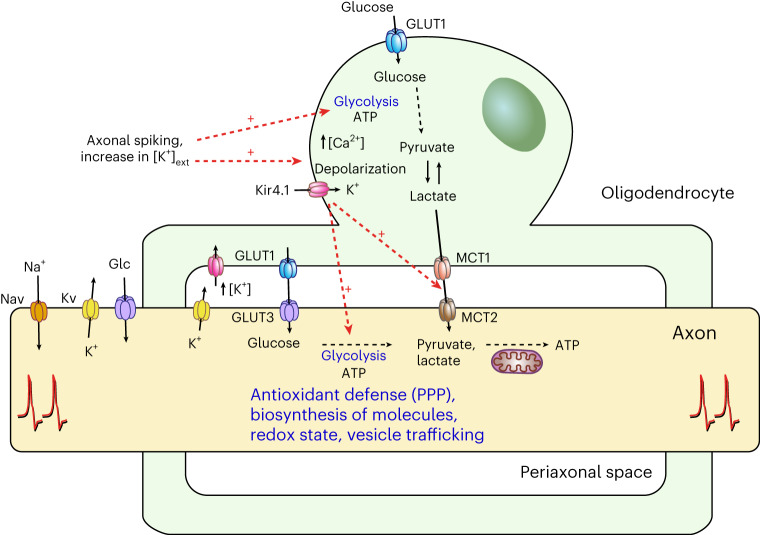
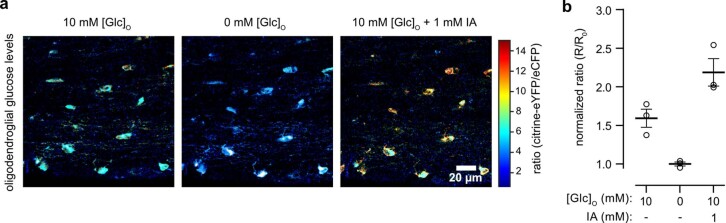
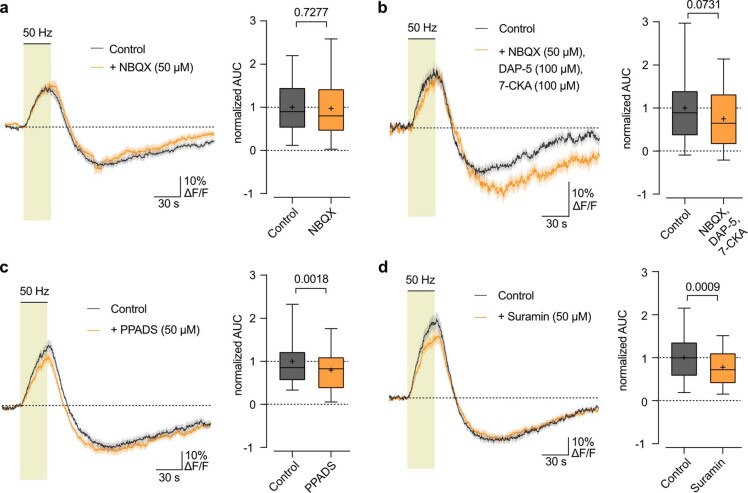
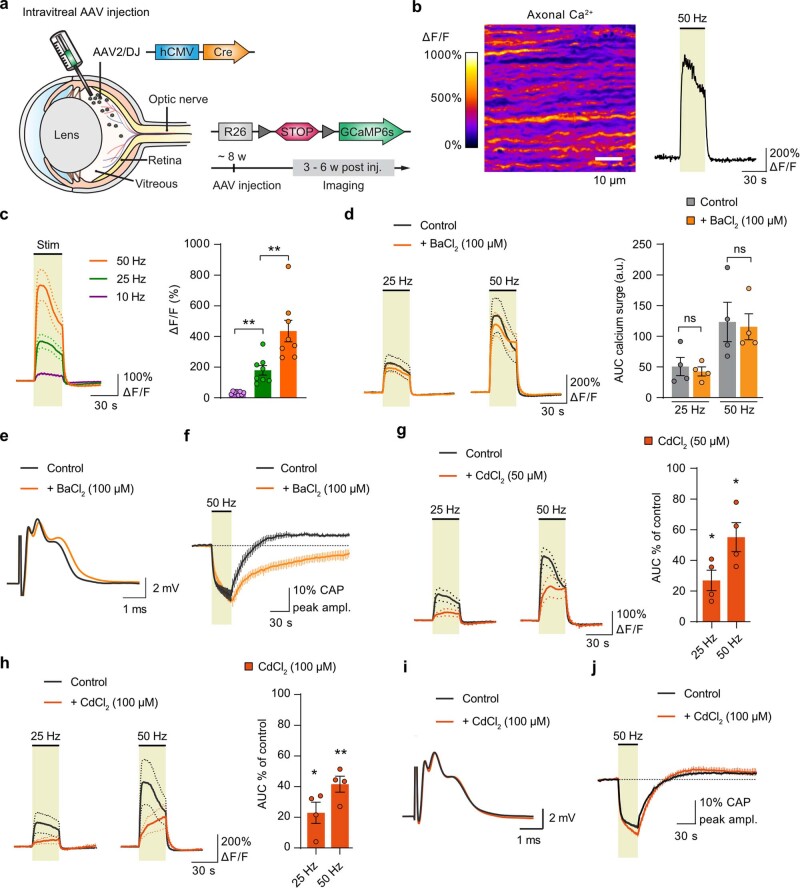
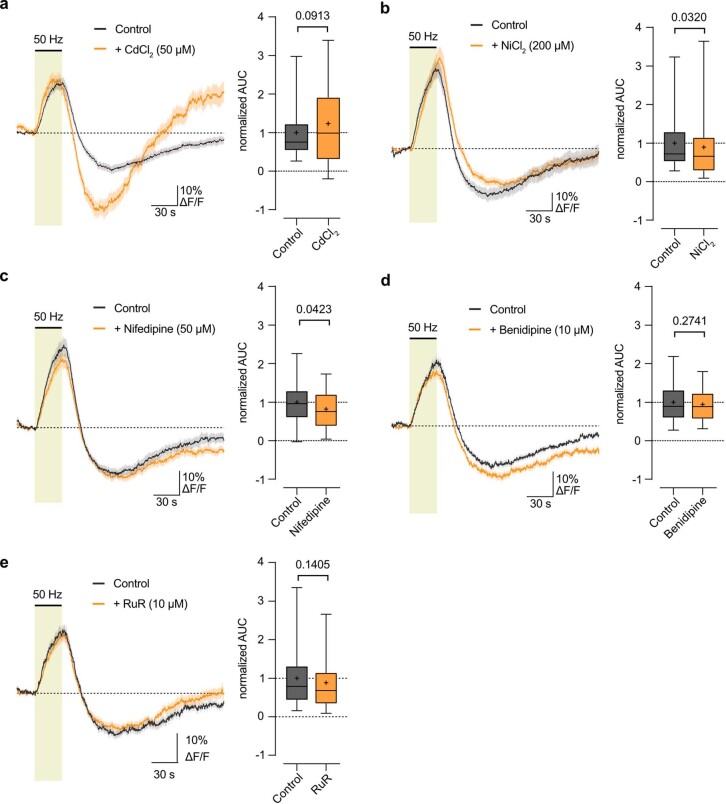
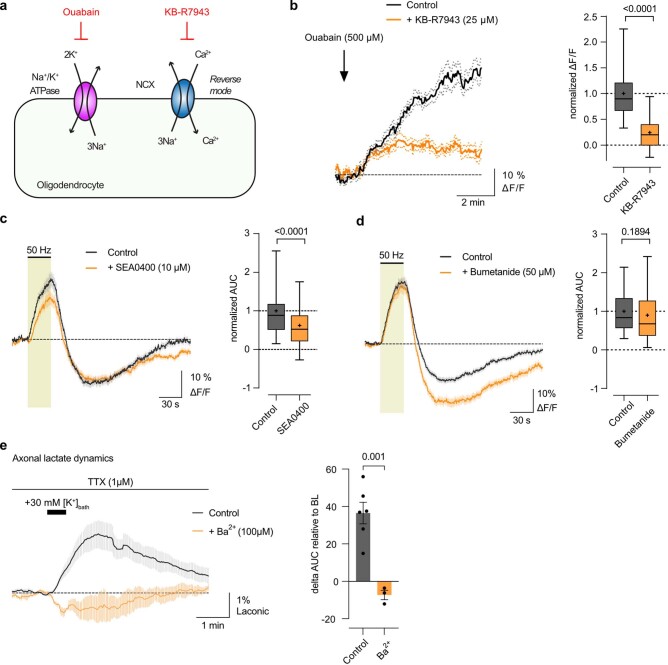
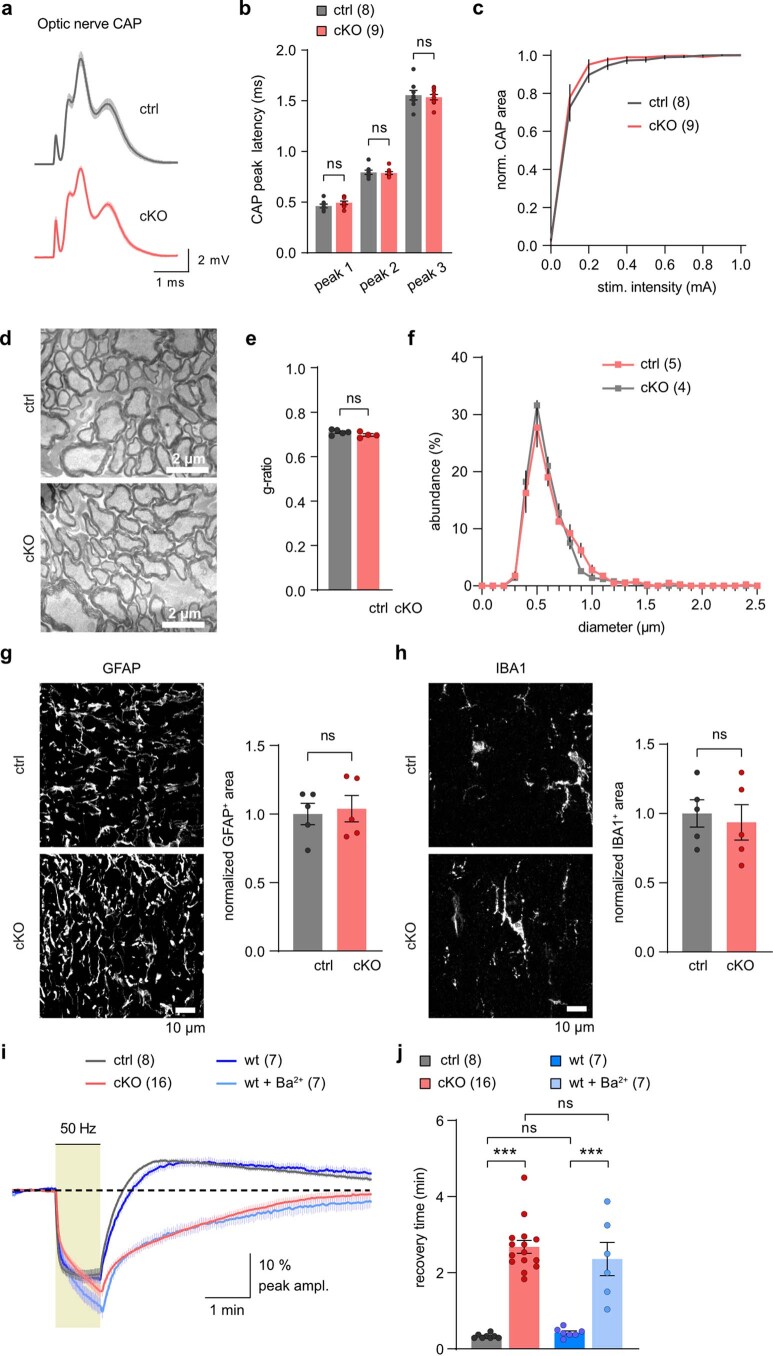
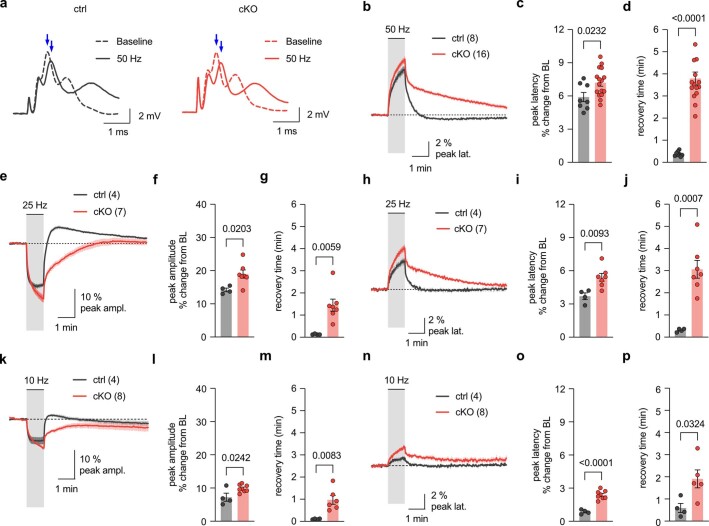
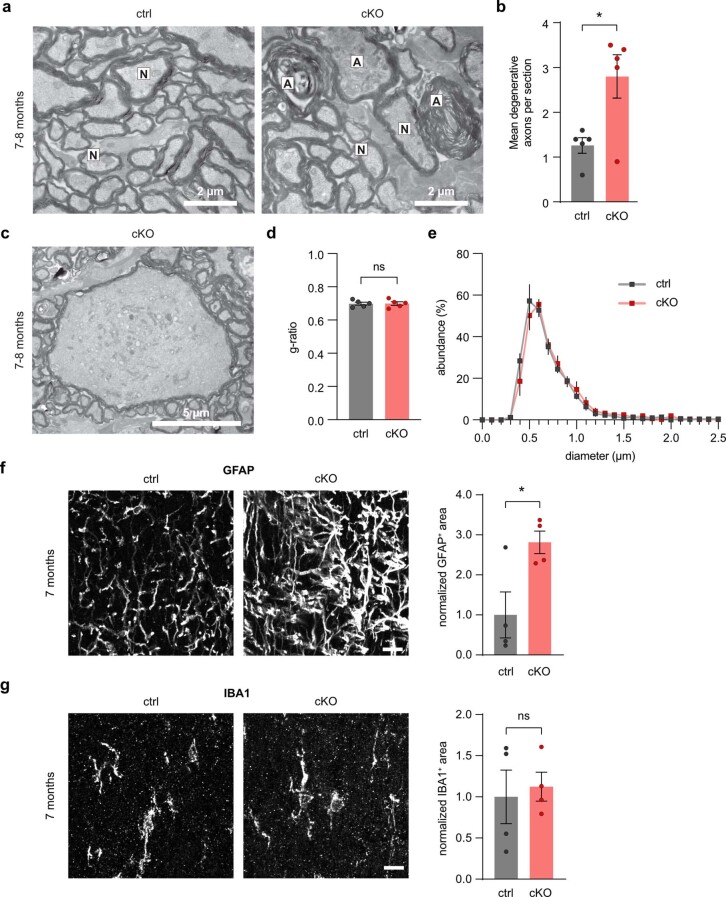
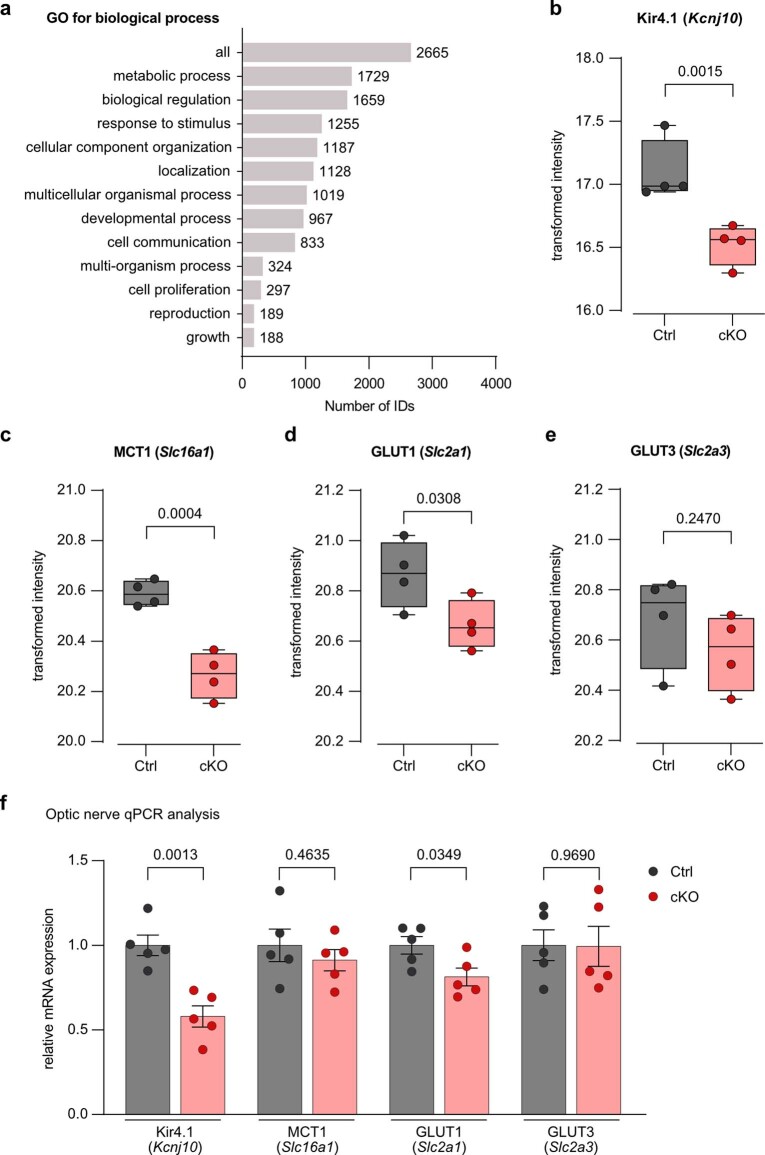
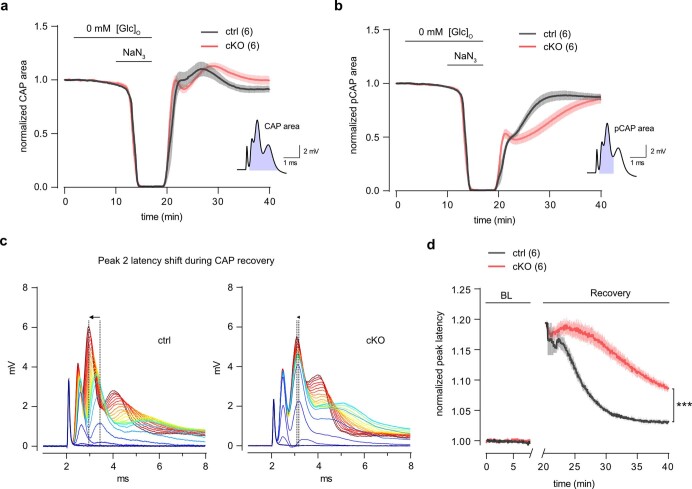
The integrity of myelinated axons relies on homeostatic support from oligodendrocytes (OLs). To determine how OLs detect axonal spiking and how rapid axon-OL metabolic coupling is regulated in the white matter, we studied activity-dependent calcium (Ca2+) and metabolite fluxes in the mouse optic nerve. We show that fast axonal spiking triggers Ca2+ signaling and glycolysis in OLs. OLs detect axonal activity through increases in extracellular potassium (K+) concentrations and activation of Kir4.1 channels, thereby regulating metabolite supply to axons. Both pharmacological inhibition and OL-specific inactivation of Kir4.1 reduce the activity-induced axonal lactate surge. Mice lacking oligodendroglial Kir4.1 exhibit lower resting lactate levels and altered glucose metabolism in axons. These early deficits in axonal energy metabolism are associated with late-onset axonopathy. Our findings reveal that OLs detect fast axonal spiking through K+ signaling, making acute metabolic coupling possible and adjusting the axon-OL metabolic unit to promote axonal health.


Conflict of interest statement

The authors declare no competing interests.

Figures

Fig. 1
Fig. 1. Axonal activity-induced Ca2+ signaling and glycolytic flux in optic nerve OLs.
a, Generation and tamoxifen treatment of PLP-CreERT;RCL-GCaMP6s mice at 6–8 weeks; experiments were performed 4–12 weeks after injection. b, Left, immunohistochemistry images of GCaMP6s expression in OLs (anti-green fluorescent protein (anti-GFP) antibody, green; anti-CC1 antibody, magenta). Right, percentage of GCaMP6s-positive cells that are also positive for CC1 (n = 4 mice, gray circles). c, Optic nerve preparation for electrophysiology and imaging. d, Left, example CAPs at 0.4 Hz (baseline (BL)) and after 30-s stimulation at 10, 25 or 50 Hz. Right, time course (mean ± s.e.m.) of CAP peak 2 amplitude relative to baseline (n = 8 mice). e, Left, OL Ca2+ responses (mean ± s.e.m.) to different axonal stimulations. Right, box plots showing the response area under the curve (AUC; n = 108 cells from eight mice). Higher frequencies induced larger Ca2+ surges (50 versus 25 Hz, ***P < 0.0001; 50 versus 10 Hz, ***P < 0.0001; 25 versus 10 Hz, ***P < 0.0001; one-way analysis of variance (ANOVA), Tukey’s multiple-comparison test). f, Left, TTX (1 μM) abolished the 50-Hz-induced OL Ca2+ response. Inset, CAP diminished by TTX. Right, normalized response AUCs before and after TTX (n = 82 cells from six mice), showing a reduction by 93 ± 9% (***P < 0.0001, two-sided paired t test). g, Left, removal of extracellular Ca2+ (+200 μM EGTA) diminished the OL Ca2+ response.Inset, CAP response in zero Ca2+. Right, normalized response AUCs showing a 96 ± 14% reduction (n = 44 cells from three mice, ***P < 0.0001, two-sided paired t test). h, AAV-mediated glucose (Glc) FRET sensor (FLIIP) expression in adult optic nerve OLs following intracerebroventricular injection. Immunostaining with CC1 (magenta) confirmed FLIIP expression (anti-GFP antibody, green) in mature OLs (observed in three mice). MBP, myelin basic protein; P10, postnatal day 10; ∼P56, approximately postnatal day 56. i, Left, schematic of glucose consumption after inhibiting glucose uptake with the glucose transporter (GLUT) blocker CytoB. Glc-6P, glucose 6-phosphate. Middle, time course of glucose decline during CytoB incubation at 0.1 Hz and upon transient 50-Hz stimulation (mean ± s.e.m.). The mean decline rate (red dashed lines) increased from 0.9 ± 0.4% min−1 at 0.1 Hz to 8.1 ± 0.6% min−1 at 50 Hz. Right, graph showing the glucose consumption rates (n = 3 mice, *P = 0.0159, two-sided paired t test). Box plots show the median (center line), quartiles (box bounds), mean (+) and 5th–95th percentiles (whiskers).
Fig. 2
Fig. 2. Kir4.1 channel-mediated mechanism underlying stimulus-evoked Ca2+ signaling in OLs.
a, OL Ca2+ levels increased by increasing [K+]ext with 5, 10 and 30 mM K+ (30-s bath application: Δ[K+]bath). Left, average OL Ca2+ traces (mean ± s.e.m.). Right, quantification of Δ[K+]bath-evoked signal amplitudes (30 mM: n = 57 cells from four mice; 10 mM: n = 52 cells from five mice; 5 mM: n = 35 cells from four mice; 5 versus 10 mM, **P = 0.0048; 5 versus 30 mM, ***P < 0.0001; 10 versus 30 mM, ***P < 0.0001; one-way ANOVA with Tukey’s multiple-comparison test). b, Left, K+-evoked OL Ca2+ response independent of axonal spiking activity, showing comparable surges with TTX. Right, box plots showing the normalized response AUCs (n = 72 cells from five mice; P = 0.8144, two-sided paired t test; NS, not significant). c, Left, barium (Ba2+, 100 µM) reversibly inhibited the 50-Hz-induced OL Ca2+ surge by 84 ± 10%. Right, box plots showing the normalized response AUCs (n = 45 cells from four mice; ***P < 0.0001, two-sided paired t test). d, Left, Ba2+ reduced the K+-evoked OL Ca2+ response by 88 ± 9%. Right, box plots showing the normalized response AUCs (n = 47 cells from three mice; ***P < 0.0001, two-sided paired t test). e,f, Reverse-mode NCX blocker KB-R7943 (25 μM) reduced the 50-Hz-induced Ca2+ increase (e) by 44 ± 11% (n = 64 cells from five mice; paired t test, ***P = 0.0002) and the K+-evoked Ca2+ response (f) by 47 ± 8% (n = 52 cells from three mice; two-sided paired t test, ***P < 0.0001). Box plots on the right show the normalized response AUCs. g, Summary of drugs tested and their inhibitory effects on 50-Hz-evoked OL Ca2+ surges (data are also shown as box plots including the respective P values in c and e, Fig. 1f,g, and Extended Data Figs. 2, 4 and 5): TTX (n = 82), zero Ca2+ (n = 44), BaCl2 (n = 45), KB-R7943 (n = 64), SEA0400 (n = 54), CdCl2 (n = 54), NiCl2 (n = 60), nifedipine (n = 39), benidipine (n = 56), RuR (n = 71), bumetanide (n = 77), PPADS (n = 46), suramin (n = 33), NBQX (n = 45) and +DAP-5/7-CKA (n = 33). AMPAR, AMPA receptor; NMDAR, NMDA receptor. h, Schematic of axonal activity-mediated OL Ca2+ activation: high-frequency axonal activity increases [K+]ext, depolarizing (Depol.) OLs through Kir4.1 and enhancing Ca2+ entry through NCX. Minor contributions of VGCCs, P2XR and NMDA receptors are illustrated. Box plots in af show the median (center line), quartiles (box bounds), mean (+) and 5th–95th percentiles (whiskers).
Fig. 3
Fig. 3. Axonal lactate dynamics are regulated by oligodendroglial Kir4.1.
a, Lactate FRET sensor (Laconic) expression in optic nerve axons through intravitreal AAV delivery in wild-type mice. Color-coded ratio images in ACSF with 10 mM glucose, additional 20 mM lactate (Lac), and after glucose and lactate removal. hCMV, human cytomegalovirus; mTFP, monomeric teal fluorescent protein. b, Ratio quantification of conditions in a, confirming the sensor’s response to lactate availability (n = 4 mice; [glucose]/[lactate] in mM: 10/0 versus 10/20: **P = 0.0052; 10/0 versus 0/0: **P = 0.0014; 10/20 versus 0/0: ***P < 0.0001; one-way ANOVA Holm–Šídák’s multiple-comparison test). c, Lactate level changes (%) upon 10-Hz (n = 8 mice), 25-Hz (n = 8 mice) or 50-Hz (n = 15 mice) stimulation. d, Lactate surges (initial slopes), showing higher lactate increases at higher frequencies (50 Hz, n = 15 mice; 25 Hz, n = 8 mice; 10 Hz, n = 8 mice; 50 versus 25 Hz, *P = 0.0141; 50 versus 10 Hz, ***P < 0.0001; 25 versus 10 Hz, *P = 0.0141; one-way ANOVA with Holm–Šídák’s multiple-comparison test). e,f, Ba2+ (100 μM) reduced the 50-Hz-induced axonal lactate increase (e) by 34 ± 11% (f) (n = 7, two-sided paired t test, *P = 0.0249). wt, wild type. g, OL-specific Kir4.1 cKO (Kir4.1fl/fl;MOGiCre) and control (ctrl) mice (Kir4.1fl/fl). hm, Axonal lactate and CAP analyses in ∼3-month-old cKO (n = 16) and control (n = 8) mice. h, Time course of axonal lactate levels during 50-Hz stimulation and GD. Traces were normalized to the minimum level after GD. i, Basal axonal lactate levels were lower in cKO versus control (*P = 0.0119, two-sided unpaired t test). j, 50-Hz-evoked lactate surge was lower in cKO (*P = 0.0174, two-sided unpaired t test). k, Lactate decline rate during GD was similar between genotypes (P = 0.1318, two-sided unpaired t test). l, CAP decline kinetics during GD were comparable between genotypes (CAP decline slope: P = 0.7934, time to 50% CAP area: P = 0.7265, two-sided unpaired t test). m, Normalized (Norm.) axonal lactate and CAP time traces during GD in control (left) and cKO (middle) mice. Right, graph showing that the temporal delay between 50% lactate decline and CAP drop (dashed arrows in left and middle) was similar between genotypes (P = 0.9789, two-sided unpaired t test). Data are represented as mean ± s.e.m.
Fig. 4
Fig. 4. MCT1 and GLUT1 levels are reduced in central nervous system myelin of Kir4.1 cKO mice.
a, TMT-based proteomics analysis in optic nerves from 2.5-month-old Kir4.1 cKO (n = 4) and littermate control (n = 4) mice. The scheme (generated by BioRender) shows extraction, digestion, TMT labeling and pooling for liquid chromatography–tandem mass spectrometry (LC–MS/MS). b, Top 50 (sorted by FDR) differentially regulated proteins listed with gene names. The heat map shows upregulation (red) or downregulation (blue) in cKO versus control ranked by log2(fold change), including only proteins with fold change >0.25 or <−0.25. Row z scores were calculated from normalized intensities. c,d, Gene set enrichment analyses (GSEAs) for the categories Gene Ontology (GO) molecular function (c) and pathway Kyoto Encyclopedia of Genes and Genomes (KEGG) (d) showed decreases in transmembrane transporter activity, vesicular transport and energy metabolism (FDR < 0.05). Analysis was performed through WebGestalt.org, with proteins ranked by log2(fold change). SNAP, soluble N-ethylmaleimide-sensitive factor attachment protein; SNARE, SNAP receptor. e, Left, immunoblot analysis of Kir4.1, MCT1 and GLUT1 in myelin biochemically purified from the brains of 2.5-month-old control (n = 3) and cKO (n = 3) mice. M, molecular weight marker. Right, compared to controls (gray), cKO mice (red) showed a reduced abundance of Kir4.1 by 81 ± 13% (**P = 0.0038), GLUT1 by 44 ± 8% (**P = 0.0044) and MCT1 by 50 ± 13% (*P = 0.0179, two-sided unpaired t test). Known myelin proteins PLP, 2′,3′-cyclic nucleotide 3′-phosphodiesterase (CNP), myelin oligodendrocyte glycoprotein (MOG), ATPase Na+/K+ transporting subunit α1 (ATP1α1) and ATP1α3 were detected as markers. Note that the MOG abundance was reduced by 40 ± 9% (*P = 0.0125, two-sided unpaired t test), attributed to Cre insertion under the MOG promoter in heterozygous MOGiCre mice inactivating one mog allele. Data are represented as mean ± s.e.m.
Fig. 5
Fig. 5. Minor changes in axonal ATP dynamics in the absence of oligodendroglial Kir4.1.
a, AAV-mediated ATP FRET sensor (ATeam1.03) expression in optic nerve axons. Color-coded ratio images from control (top) and cKO (bottom) nerves show ATP levels in ACSF with 10 mM glucose and after GD + MI with 5 mM NaN3. hSyn1, human synapsin 1; mseCFP, monomeric superenhanced cyan fluorescent protein. b, Time course of axonal ATP levels in ∼3-month-old cKO (n = 6) and control (n = 6) mice challenged with GD + MI, normalized to the minimum ATP level (R0). Inset, initial ATP recovery dynamics following reperfusion with 10 mM glucose. c, Basal axonal ATP levels were comparable between genotypes (n = 6 mice, P = 0.61, two-sided unpaired t test). d, No difference in the ATP decline rate between genotypes upon GD + MI (n = 6 mice, P = 0.44, two-sided unpaired t test). e, Similar initial ATP recovery rates between genotypes after GD + MI (n = 6 mice, P = 0.51, two-sided unpaired t test). f, Onset of ATP recovery (see dashed arrows in inset in b) differed between control and cKO nerves (n = 6 mice, *P = 0.03, two-sided unpaired t test). g, Lower axonal ATP level recovery in cKO than in controls following GD + MI (n = 6 mice, *P = 0.0135, two-sided unpaired t test). h, Axonal ATP level changes (%) at 50-Hz stimulation relative to baseline. i,j, Similar ATP level decline rates (i) during 50-Hz stimulation (n = 6 mice, P = 0.81, two-sided unpaired t test) and equal initial ATP recovery rates (j) after stimulation (P = 0.54, two-sided unpaired t test). k, Slightly lower axonal ATP level recovery after stimulation in cKO versus controls (n = 6 mice, *P = 0.0498, two-sided unpaired t test). Data are represented as mean ± s.e.m.
Fig. 6
Fig. 6. Lack of oligodendroglial Kir4.1 impairs axonal glucose metabolism.
a, AAV-mediated glucose FRET sensor (FLIIP) expression in optic nerve axons. Color-coded ratio images from control (top) and cKO (bottom) nerves show glucose levels in ACSF with 10 mM glucose and after GD. eYFP, enhanced yellow fluorescent protein; eCFP, enhanced cyan fluorescent protein. b, Time course of axonal glucose levels in ∼3-month-old cKO (n = 9) and control (n = 7) mice during perfusion with regular and zero-glucose ACSF, with 10 mM lactate to sustain CAPs. Traces were normalized to the minimum level after GD. c, Comparable basal axonal glucose levels between genotypes (control n = 7, cKO n = 9, P = 0.2276, two-sided unpaired t test). d,e, Glycolysis inhibition (d, left) with IA (1 mM) in ACSF with 10 mM glucose increased axonal glucose levels (d, right). e, Glucose increase rate (dashed lines in d) upon IA was lower in cKO (n = 7 mice) by 36 ± 13% compared to controls (n = 4 mice; *P = 0.0235, two-sided unpaired t test). f,g, Glucose consumption assessed with CytoB (20 µM) during 0.1-Hz stimulation. f, Scheme (left) and time course (right) of glucose level decline upon CytoB treatment for control (n = 10) and cKO (n = 14) mice, with mean decline rates (dashed lines) of 2.6 ± 0.4% min−1 and 1.6 ± 0.3% min−1, respectively. g, Basal axonal glucose consumption rate in cKO mice (n = 14) was reduced by 37 ± 17% compared to controls (n = 10 mice; *P = 0.0384, two-sided unpaired t test). Data are represented as mean ± s.e.m.
Fig. 7
Fig. 7. Activity-induced axonal glucose consumption rate is reduced in Kir4.1 cKO mice.
a, Time-course traces of 50-Hz-evoked axonal glucose dynamics showing differences in glucose level changes between cKO (n = 16) and control (n = 11) mice. b, During stimulation, glucose levels decreased at a rate of 2.7 ± 0.6% min−1 in controls (n = 11) but remained stable (0.1 ± 0.2% min−1) in cKO (n = 16; ***P = 0.0002, two-sided unpaired t test). c, After stimulation, glucose levels increased above the initial baseline values in both genotypes but were significantly higher in cKO (3.2 ± 0.3%) than in controls (1.4 ± 0.4%; ***P = 0.0006, two-sided unpaired t test). dg, Assessment of glucose consumption rate changes from 0.1- to 50-Hz stimulations in control (n = 6) and cKO (n = 7) mice. d, Decline slopes are indicated by dashed lines. e, Axonal glucose consumption rates significantly increased upon 50-Hz stimulation (Stim 50 Hz) in controls (0.1 versus 50 Hz, **P = 0.0022, two-sided paired t test) and in cKO (0.1 versus 50 Hz, ***P < 0.0001, two-sided paired t test). f, Glucose consumption rate during 50-Hz stimulation was 40 ± 15% lower in cKO than in controls (*P = 0.0208, two-sided unpaired t test). g, Fold change in glucose consumption from 0.1 to 50 Hz was comparable between genotypes (8.5 ± 2 in controls and 8.5 ± 1 in cKO, P = 0.9858, two-sided unpaired t test). Data are represented as mean ± s.e.m.
Fig. 8
Fig. 8. Activity-mediated model of axon–OL metabolic coupling.
The scheme shows a working model in which axon–OL communication and metabolic coupling in the white matter are controlled by K+ and Kir4.1-mediated signaling. Fast axonal spiking induces a rapid increase in OL [Ca2+] and glycolysis. OLs primarily detect axonal activity through elevated [K+]ext and activation of Kir4.1 channels. This K+-mediated signaling facilitates the supply of lactate (or pyruvate) to axons. Apart from regulating acute metabolic coupling, oligodendroglial Kir4.1 adjusts the myelinic levels of MCT1 and GLUT1. In addition to lactate, OLs might supply axons with glucose and/or modulate axonal glucose uptake at the nodes of Ranvier. Oligodendroglial K+ homeostasis also influences axonal glycolysis, which is likely critical for preserving axonal integrity through various glucose metabolism-dependent processes, such as antioxidant protection through the pentose phosphate pathway (PPP), biosynthesis of molecules required for structure and function, regulation of the redox state, and vesicular transport. The potential contribution of astrocytes as a source of (glycogen-derived) lactate (or pyruvate) for axons is not depicted in this scheme, pending future studies. Nav, voltage-gated sodium channel; Kv, voltage-gated potassium channel.
Extended Data Fig. 1
Extended Data Fig. 1. Functional assessment of glucose sensor in OLs.
a, AAV-mediated glucose FRET sensor FLIIP expression in optic nerve OLs of wildtype mice. Depicted are representative color-coded ratio images from optic nerve in ACSF containing 10 mM glucose (Glc), after removal of extracellular Glc, and following inhibition of glycolysis by 1 mM iodoacetate (IA) in ACSF containing 10 mM Glc. Warm and cold colors indicate high and low ratios or glucose levels, respectively. Scalebar 20 µm. b, Quantification of normalized ratios obtained from conditions presented in a. Ratios (n = 3 mice) were normalized to the averaged minimum obtained at 0 mM [Glc]O. Data shown in mean ± SEM.
Extended Data Fig. 2
Extended Data Fig. 2. Minor contribution of glutamatergic and purinergic signaling to stimulus-evoked Ca2+ response in OLs.
a, 50 Hz-evoked OL soma Ca2+ changes in control condition and with addition of NBQX (50 µM). Quantification of OL Ca2+ surge (AUC during stimulation period, boxplots) revealed no difference in the stimulus-evoked Ca2+ increase (n = 45 cells from 3 mice, p = 0.7277, two-sided paired t-test). b, OL Ca2+ changes with NBQX (50 µM), DAP-5 (100 µM), and 7-CKA (100 µM) revealed a decrease in the stimulus-evoked Ca2+ increase by 25 ± 13% (n = 33 cells from 3 mice, p = 0.0732, two-sided paired t-test). c, OL Ca2+ response with PPADS (50 µM) revealed a decrease in the stimulus-evoked Ca2+ increase by 21 ± 6% (n = 46 cells from 3 mice, p = 0.0018, two-sided paired t-test). d, OL Ca2+ response with Suramin (50 µM) revealed a decrease in the stimulus-evoked Ca2+ increase by 22 ± 6% (n = 33 cells from 2 mice, p = 0.0009, two-sided paired t-test). Traces represent mean ± SEM. Boxplots show median (line), quartiles (box bounds), mean (+), and 5-95 percentiles (whiskers).
Extended Data Fig. 3
Extended Data Fig. 3. Stimulus-evoked axonal Ca2+ surge not sensitive to barium.
a, Intravitreal AAV-Cre injection into ∼8 weeks old RCL-GCaMP6s mice drives GCaMP6s expression in optic nerve axons and used for two-photon imaging. b, Electrical 50 Hz stimulation triggers Ca2+ rise in axons. Depicted is an example recording of a 30 s stimulation, with ΔF/F image (left) and corresponding Ca2+ trace. c, Stimulus-evoked axonal Ca2+ transients are significantly larger with higher stimulation frequencies (n = 8 mice; 10 Hz vs 25 Hz, p = 0.0027; 25 Hz vs 50 Hz, p = 0.0013; one-way ANOVA with Tukey’s multiple comparisons test). d, Stimulus-evoked axonal Ca2+ surge is not affected by application of 100 µM Ba2+, tested at 25 Hz (n = 4 mice, p = 0.49, two-sided paired t-test) and 50 Hz (n = 4, p = 0.6859, two-sided paired t-test). e, Example CAP trace in control conditions and with addition of 100 µM Ba2+. f, Time course of CAP peak amplitude changes upon 50 Hz stimulations. Note that the recovery kinetics of the peak amplitude are strongly reduced in the presence of Ba2+ compared to control (n = 4 mice, Finteraction (74, 444) = 2.487, p < 0.0001, two-way ANOVA). g and h, Inhibition of VGCCs with Cd2+ significantly reduced the stimulus-evoked axonal Ca2+ surge. At 50 µM Cd2+ (g) the 25 Hz- and 50 Hz-evoked Ca2+ surges were reduced to 27 ± 7% (n = 4 mice; p = 0.0133, two-sided paired t-test) and to 55 ± 9% (n = 4 mice; p = 0.0343, two-sided paired t-test), respectively. At 100 µM Cd2+ (h) the 25 Hz- and 50 Hz-evoked Ca2+ surges were reduced to 23 ± 7% (n = 4 mice; p = 0.0402, two-sided paired t-test) and by 42 ± 5% (n = 4 mice; p = 0.0074, two-sided paired t-test), respectively. i, Example CAP trace in control conditions and with addition of 50 µM Cd2+. j, CAP recovery kinetics after 50 Hz stimulation is not affected by Cd2+ (n = 4 mice). Data are represented as mean time traces ± SEM and as dot-plots with means ± SEM.
Extended Data Fig. 4
Extended Data Fig. 4. Voltage-gated Ca2+ channels are no major drivers of stimulus-evoked OL Ca2+ response.
a, OL Ca2+ response in control condition and with Cd2+ (50 µM) revealed a slight increase in the 50 Hz-evoked Ca2+ rise (n = 54 cells from 4 mice, p = 0.0913 two-sided paired t-test). b, OL Ca2+ response with Ni2+ (200 µM) revealed a slight decrease in the 50 Hz-evoked Ca2+ surge by 11 ± 5% (n = 60 cells from 4 mice, p = 0.0320 two-sided paired t-test). c, OL Ca2+ response with Nifedipine (50 µM) revealed a slight decrease in the 50 Hz-evoked Ca2+ surge by 18 ± 9% (n = 39 cells from 3 mice, p = 0.0423 two-sided paired t-test). d, OL Ca2+ response with Benidipine (10 µM) revealed no overt change in the 50 Hz-evoked Ca2+ surge (n = 56 cells from 3 mice, p = 0.2741 two-sided paired t-test). e, OL Ca2+ response with RuR (10 µM) revealed no significant changes in the 50 Hz-evoked Ca2+ surge (n = 71 cells from 4 mice, p = 0.1405 two-sided paired t-test). Traces represent mean ± SEM. Boxplots show median (line), quartiles (box bounds), mean (+), and 5-95 percentiles (whiskers).
Extended Data Fig. 5
Extended Data Fig. 5. Reverse-mode NCX activation in OL Ca2+ response and extracellular K+-induced lactate surge in axons.
a, Schematic of reverse-mode NCX activity testing in OLs: Blocking the sodium pump with Ouabain raises intracellular Na+ concentration, which should activate NCX to exchange Na+ out for Ca2+ in. The ouabain-evoked Ca2+ is expected to be reduced by blocking NCX with KB-R7943. b, Indeed, 500 µM ouabain application resulted in increased Ca2+ levels in OLs, significantly reduced with 25 µM KB-R7943 (n = 31 cells from 2 mice, p < 0.0001, two-sided paired t-test). c, 50 Hz-evoked OL Ca2+ response with NCX blocker SEA0400 (10 µM) revealed a significant decrease in Ca2+ surge by 38 ± 7% (n = 54 cells from 4 mice, p < 0.0001, two-sided paired t-test). d, OL Ca2+ response with NKCC1 blocker Bumetanide (50 µM) revealed no difference in the stimulus-evoked Ca2+ surge (n = 77 cells from 4 mice, p = 0.1894, two-sided paired t-test). b-d, Ca2+ traces represent means ± SEM. Boxplots show data median as line, upper and lower quartile as bounds of box, mean as + and 5-95 percentiles as whiskers. e, Axonal lactate levels following transient 30 mM extracellular [K+] increase via 30 s bath application. Experiments were conducted in 1 µM TTX to inhibit axonal activity. Lactate levels are presented as % changes (± SEM), and the lactate surge (delta AUC) is compared to baseline (BL) before K+ application. The K+-induced axonal lactate rise (n = 6 mice) was abolished in the presence of 100 µM Ba2+ (n = 3 mice, p = 0.001, two-sided Student’s t-test).
Extended Data Fig. 6
Extended Data Fig. 6. Oligodendroglial Kir4.1 critical for white matter K+ clearance.
a, Average optic nerve CAP response of ctrl (n = 8) and Kir4.1 cKO (n = 9) mice. b, Similar CAP peak latencies between genotypes (ctrl n = 8, cKO n = 9; p = 07637 for peak 1, p = 0.9958 for peak 2, p = 0.9265 for peak 3, one-way ANOVA with Holm-Šídák’s –multiple comparisons test). c, Similar stimulus-response relationships in both groups (ctrl n = 8, cKO n = 9; Finteraction (10, 150) = 0.4445, p = 0.9224, two-way ANOVA). CAP area from each stimulus intensity normalized to max stimulation at 1 mA. d-f, Electron microscopic (EM) analysis of optic nerves from 3-months-old cKO (n = 4) and ctrl (n = 5) mice: d, Representative EM images. e, Myelin sheath thickness (g-ratio) comparable between genotypes (p = 0.1584, two-sided Student’s t-test). f, Similar axon size distribution of myelinated axons (Finteraction (25, 175) = 1.028, p = 0.4333, two-way ANOVA). g and h, Confocal images of optic nerve immunolabeling: g, GFAP; h, IBA1, in 2.5-months-old ctrl and cKO mice. No differences in GFAP-immunopositive area between genotypes (ctrl, n = 5; cKO n = 5; p = 0.7611, two-sided Student’s t-test), or IBA1 labeling (ctrl, n = 5; cKO n = 5; p = 0.7047, two-sided Student’s t-test). i, Averaged CAP amplitude changes (% from baseline) upon 1 min 50 Hz stimulation of optic nerves from cKO, ctrl, wildtype (wt) and wt treated with 100 µM Ba2+ (wt+Ba2+). j, CAP peak recovery time post 50 Hz stimulation: Slower recovery in cKO (n = 16 mice) and wt+Ba2+ (n = 7) compared to ctrl (n = 8) and wt (n = 7) (ctrl vs cKO, p < 0.0001; wt vs wt+Ba2+, p < 0.0001; ctrl vs wt, p = 0.9970; cKO vs wt+Ba2+, p = 0.7362; one-way ANOVA with Holm-Šídák’s multiple comparisons test). Data represented as means ± SEM.
Extended Data Fig. 7
Extended Data Fig. 7. Altered CAP peak latency recovery kinetics in Kir4.1 cKO.
a, Representative CAP traces of ctrl and cKO at baseline and post 50 Hz stimulus train, highlighting changes in CAP peak amplitude and latency (blue arrows). b-d, Analysis of CAP peak latency changes to 1 min 50 Hz in ctrl (n = 8 mice) and cKO (n = 16 mice): b, Average % changes (± SEM) from baseline in CAP peak latency showing slower recovery in cKO. c, CAP peak latency analysis at the end the stimulation revealing larger increase in latency in cKO compared to ctrl (p = 0.0232, two-sided Student’s t-test). d, Analysis of CAP peak latency recovery time post stimulation, significantly slower in cKO compared to ctrl (p < 0.0001, two-sided Student’s t-test). e-j, 25 Hz-induced CAP changes in ctrl (n = 4 mice) and cKO (n = 7 mice). e-g: CAP peak amplitude: e, Average % changes in peak amplitude. f, Greater decrease in cKO (p = 0.0203, two-sided Student’s t-test). g, Slower recovery post-stimulation in cKO (p = 0.0059, two-sided Student’s t-test). h-j, CAP peak latency: h, Average % changes in latency. i, Larger increase in cKO mice (p = 0.0093, two-sided Student’s t-test). j, Slower recovery post-stimulation in cKO (p = 0.0007, two-sided Student’s t-test). k-p, 10 Hz-induced CAP changes in ctrl (n = 4 mice) and cKO (n = 8 mice). k-m, CAP peak amplitude: k, Average % changes in peak amplitude. l, Greater decrease in cKO mice (p = 0.0242, two-sided Student’s t-test). m, Slower recovery post-stimulation in cKO (p = 0.0083, two-sided Student’s t-test). n-p, CAP peak latency: n, Average % changes in latency. o, Larger increase in cKO mice (p < 0.0001, two-sided Student’s t-test). p, Slower recovery post-stimulation in cKO (p = 0.0324, two-sided Student’s t-test). Data are represented as dot-plots with means ± SEM.
Extended Data Fig. 8
Extended Data Fig. 8. Age-related axonopathy and signs of astrogliosis in 7- to 8-months-old Kir4.1 cKO mice.
a-c, EM analysis of optic nerves from 7- to 8-months-old cKO and ctrl mice: a, Representative EM images with normal (N) appearing axons and signs of axonopathy (A). Scalebar 2 µm. b, Ultrastructural features of axonal injury and degeneration more frequent in cKO compared to ctrl (n = 5 mice per group, with 10 randomly taken images each covering 286 µm (ref. ); p = 0.0169, two-sided Student’s t-test). c, Notably, giant axonal swellings were exclusive to cKO nerves at this age. Scalebar 5 µm. d, No difference in myelin sheath thickness (g-ratio) between genotypes (n = 5 mice; p = 0.9813, two-sided Student’s t-test). e, Similar axon size distribution of myelinated axons (n = 5 mice; Finteraction (27, 216) = 0.6975, p = 0.8670, two-way ANOVA). f, Significant increase in GFAP-immunopositive area, indicative of astrogliosis, in optic nerves from cKO mice compared to ctrl at 7 months of age (n = 4 mice; p = 0.0295, two-sided Student’s t-test). Scalebar 10 µm. g, No significant differences in IBA1-immunopositive area between genotypes (n = 4 mice; p = 0.7493, two-sided Student’s t-test). Scalebar 10 µm. Data are represented as means ± SEM.
Extended Data Fig. 9
Extended Data Fig. 9. Proteomics and qPCR analysis of optic nerve lysates from young Kir4.1 cKO mice.
a, Of the 3624 detected protein hits from the TMT-based proteomics analysis (see Fig. 4), 2665 were unambiguously mapped to unique Entrez gene IDs. Using the GO term biological process, bar charts depict the GO annotation and functional categorization of identified proteins. WebGestalt.org provided the summary. b, Protein abundance of Kir4.1 (gene Kcnj10) is reduced in samples from cKO (n = 4 mice) compared to ctrl (n = 4, p = 0.0015, moderated t-test). c, Abundance of MCT1 (Slc16a1) is reduced in cKO compared to ctrl (n = 4, p = 0.0004, moderated t-test). d, Abundance of GLUT1 (Slc2a1) is reduced in cKO compared to ctrl (n = 4, p = 0.0308, moderated t-test). e, Abundance of GLUT3 (Slc2a3) is unchanged between genotypes (n = 4, p = 0.2470, moderated t-test). Boxplots with all points show median (line), quartiles (box bounds), and min to max (whiskers). f, Relative mRNA abundance in optic nerve lysates of 3-months-old cKO (n = 5) and littermate ctrls (n = 5): Compared to ctrl, Kir4.1 mRNA levels were reduced by 0.42 ± 0.09 (p = 0.0013, two-sided Student’s t-test) and GLUT1 mRNA levels were reduced by 0.19 ± 0.07 (p = 0.0349, two-sided Student’s t-test). No significant differences in mRNA levels of MCT1 (p = 0.4635) and GLUT3 (p = 0.9690). Data represented as dot-plots with means ± SEM.
Extended Data Fig. 10
Extended Data Fig. 10. Deficiency in adjusting axonal conduction speed following energy deprivation.
a, Time course of CAP area changes from optic nerves of ∼3 months old cKO (n = 6) and ctrl mice (n = 6), challenged with glucose deprivation (GD) and mitochondrial inhibition (MI) using 5 mM NaN3 (GD + MI, simulating chemical ischemia). See also Fig. 5b. Inset (bottom right) illustrates the CAP area. b, Partial CAP (pCAP) area (inset, bottom right) time course analysis during and after GD + MI. Note differing recovery kinetics between genotypes. c, Example traces of CAP response recovery (depicted in 25-second intervals, from blue to red), illustrating the first 10 minutes post GD + MI for ctrl (left) and cKO (right). Note the more considerable shift in peak 2 latency (indicated by arrow at dashed lines) during recovery in ctrl compared to cKO. d, Peak 2 latency analysis, adjusted to initial baseline value before GD + MI. Notably, post GD + MI, the initial increase in peak 2 latency of the first recovering CAPs was similar in both genotypes; however, its return to normal latency was significantly faster in ctrl than in cKO (n = 6, p < 0.0001, two-way ANOVA). Data represented as means ± SEM.

Similar articles

Cited by

References

    1. Salvadores N, Sanhueza M, Manque P, Court FA. Axonal degeneration during aging and its functional role in neurodegenerative disorders. Front. Neurosci. 2017;11:451. - PMC - PubMed
    1. Medana IM, Esiri MM. Axonal damage: a key predictor of outcome in human CNS diseases. Brain. 2003;126:515–530. - PubMed
    1. Saab AS, Tzvetanova ID, Nave K-A. The role of myelin and oligodendrocytes in axonal energy metabolism. Curr. Opin. Neurobiol. 2013;23:1065–1072. - PubMed
    1. Nave K-A. Myelination and the trophic support of long axons. Nat. Rev. Neurosci. 2010;11:275–283. - PubMed
    1. Philips T, Rothstein JD. Oligodendroglia: metabolic supporters of neurons. J. Clin. Invest. 2017;127:3271–3280. - PMC - PubMed

LinkOut - more resources