

Modular subgraphs in large-scale connectomes underpin spontaneous co-fluctuation events in mouse and human brains
- PMID: 38267534
- PMCID: PMC10810083
- DOI: 10.1038/s42003-024-05766-w
Modular subgraphs in large-scale connectomes underpin spontaneous co-fluctuation events in mouse and human brains
Abstract
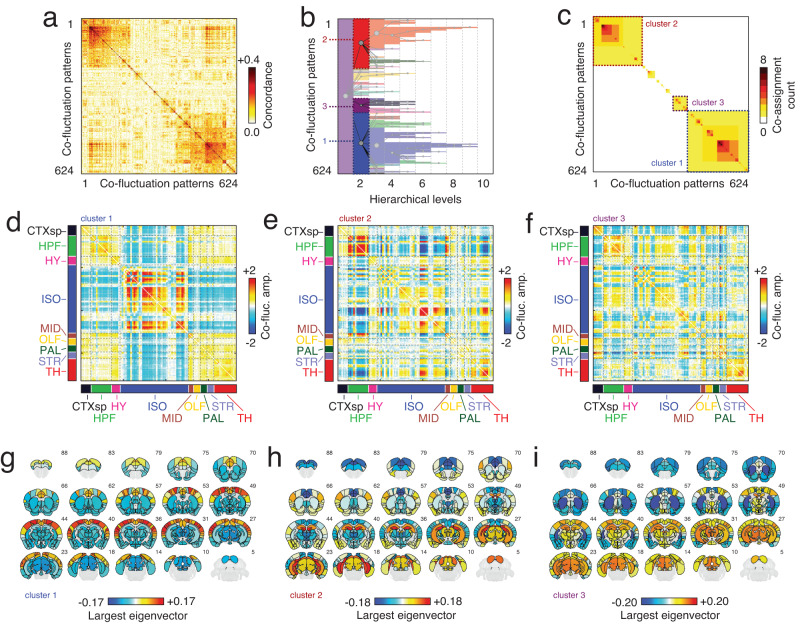
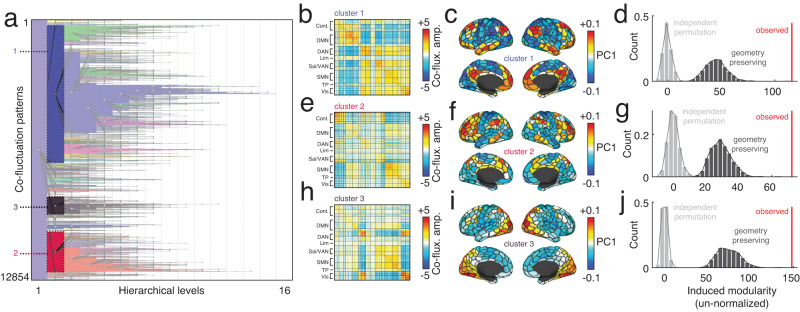
Previous studies have adopted an edge-centric framework to study fine-scale network dynamics in human fMRI. To date, however, no studies have applied this framework to data collected from model organisms. Here, we analyze structural and functional imaging data from lightly anesthetized mice through an edge-centric lens. We find evidence of "bursty" dynamics and events - brief periods of high-amplitude network connectivity. Further, we show that on a per-frame basis events best explain static FC and can be divided into a series of hierarchically-related clusters. The co-fluctuation patterns associated with each cluster centroid link distinct anatomical areas and largely adhere to the boundaries of algorithmically detected functional brain systems. We then investigate the anatomical connectivity undergirding high-amplitude co-fluctuation patterns. We find that events induce modular bipartitions of the anatomical network of inter-areal axonal projections. Finally, we replicate these same findings in a human imaging dataset. In summary, this report recapitulates in a model organism many of the same phenomena observed in previously edge-centric analyses of human imaging data. However, unlike human subjects, the murine nervous system is amenable to invasive experimental perturbations. Thus, this study sets the stage for future investigation into the causal origins of fine-scale brain dynamics and high-amplitude co-fluctuations. Moreover, the cross-species consistency of the reported findings enhances the likelihood of future translation.
© 2024. The Author(s).
Conflict of interest statement
The authors declare no competing interests.
Figures


Similar articles
-
Hierarchical organization of spontaneous co-fluctuations in densely sampled individuals using fMRI.Netw Neurosci. 2023 Oct 1;7(3):926-949. doi: 10.1162/netn_a_00321. eCollection 2023. Netw Neurosci. 2023. PMID: 37781150 Free PMC article.
-
Hierarchical Modular Structure of the Drosophila Connectome.J Neurosci. 2023 Sep 13;43(37):6384-6400. doi: 10.1523/JNEUROSCI.0134-23.2023. Epub 2023 Aug 17. J Neurosci. 2023. PMID: 37591738 Free PMC article.
-
Leveraging edge-centric networks complements existing network-level inference for functional connectomes.Neuroimage. 2022 Dec 1;264:119742. doi: 10.1016/j.neuroimage.2022.119742. Epub 2022 Nov 8. Neuroimage. 2022. PMID: 36368501 Free PMC article.
-
The nonhuman primate neuroimaging and neuroanatomy project.Neuroimage. 2021 Apr 1;229:117726. doi: 10.1016/j.neuroimage.2021.117726. Epub 2021 Jan 20. Neuroimage. 2021. PMID: 33484849 Free PMC article. Review.
-
Folic acid supplementation and malaria susceptibility and severity among people taking antifolate antimalarial drugs in endemic areas.Cochrane Database Syst Rev. 2022 Feb 1;2(2022):CD014217. doi: 10.1002/14651858.CD014217. Cochrane Database Syst Rev. 2022. PMID: 36321557 Free PMC article.
Cited by
-
Distinct Time-Resolved Brain-Wide Coactivations in Oxygenated and Deoxygenated Hemoglobin.IEEE Trans Biomed Eng. 2024 Aug;71(8):2463-2472. doi: 10.1109/TBME.2024.3377109. Epub 2024 Jul 18. IEEE Trans Biomed Eng. 2024. PMID: 38478444 Free PMC article.
-
Evolutionarily conserved fMRI network dynamics in the mouse, macaque, and human brain.Nat Commun. 2024 Oct 2;15(1):8518. doi: 10.1038/s41467-024-52721-8. Nat Commun. 2024. PMID: 39353895 Free PMC article.
-
Multiscale brain modeling: bridging microscopic and macroscopic brain dynamics for clinical and technological applications.Front Cell Neurosci. 2025 Feb 19;19:1537462. doi: 10.3389/fncel.2025.1537462. eCollection 2025. Front Cell Neurosci. 2025. PMID: 40046848 Free PMC article. Review.
-
Structural and genetic determinants of zebrafish functional brain networks.Sci Adv. 2025 Jul 11;11(28):eadv7576. doi: 10.1126/sciadv.adv7576. Epub 2025 Jul 11. Sci Adv. 2025. PMID: 40644546 Free PMC article.
-
Living on the edge: network neuroscience beyond nodes.Trends Cogn Sci. 2023 Nov;27(11):1068-1084. doi: 10.1016/j.tics.2023.08.009. Epub 2023 Sep 14. Trends Cogn Sci. 2023. PMID: 37716895 Free PMC article. Review.
References
Publication types
MeSH terms
Grants and funding
LinkOut - more resources
Full Text Sources
