. 2024 Jan 25;40(1):4.
doi: 10.1007/s10565-024-09841-0.

TFEB and TFE3 cooperate in regulating inorganic arsenic-induced autophagy-lysosome impairment and immuno-dysfunction in primary dendritic cells

Affiliations

TFEB and TFE3 cooperate in regulating inorganic arsenic-induced autophagy-lysosome impairment and immuno-dysfunction in primary dendritic cells

Guowei Xu et al. Cell Biol Toxicol. .

Abstract

Arsenic (As) is a prevalent and hazardous environmental toxicant associated with cancer and various health problems, which has been shown suppressive effects on dendritic cells (DCs). Autophagy is essential for the innate and adaptive immune responses of DCs, and the transcription factors TFEB and TFE3 are key regulators of autophagic and lysosomal target genes. However, the detrimental alterations of the autophagy-lysosome pathway in As-exposed DCs and the possible coordinating roles of TFEB and TFE3 in the immune dysfunction of this cell are less understood. In this paper, we found that As exposure significantly impaired lysosomal number, lysosomal acidic environment, and lysosomal membrane permeabilization, which might lead to blocked autophagic flux in cultured DCs. Furthermore, our results confirmed that TFEB or TFE3 knockdown exacerbated the disorders of lysosome and the blockade of autophagic flux in As-exposed DCs, and also enhanced the inhibitory expression of co-stimulatory molecules Cd80 and Cd83; adhesion molecule Icam1; cytokines TNF-α, IL-1β, and IL-6; chemokine receptor Ccr7; and antigen-presenting molecules MHC II and MHC I. By contrast, overexpression of TFEB or TFE3 partially alleviated the above-mentioned impairment of DCs by inorganic As exposure. In conclusion, these findings reveal a previously unappreciated inhibition of lysosome-mediated degradation and damage of lysosomal membrane integrity leading to dysregulated autophagy and impaired immune functions of DCs by arsenicals, and also suggest TFEB and TFE3 as potential therapeutic targets for ameliorating As toxicity.

Keywords: Autophagy; Dendritic cells; Inorganic arsenic; Lysosome; TFE3; TFEB.


Conflict of interest statement

The authors declare no competing interests.

Figures
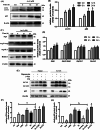
Fig. 1
Fig. 1
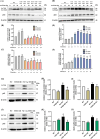
As inhibits autophagy flux in mouse primary BMDC cultures. A Western blotting of LC3-II and p62 in BMDCs exposed to 1 μM As for the times indicated. B Quantification of LC3-II and p62 protein levels. C Western blotting of ATGs and Beclin1 exposed to 1 μM As for times indicated. D Quantification of ATGs and Beclin1 protein levels. E BMDCs were pre-treated separately with ( +)/without ( −) autophagy agonist (200 nM, Rapamycin), autophagy inhibitors (1 mM 3-MA and 20 μM CQ) 1 h prior to 1 μM As exposure for 12 h, and representative bands of LC3-II and p62 proteins are shown. F, G Quantification of LC3-II and p62 protein levels. All summary data are normalized to control, and values reflect Mean ± SEM, *P < 0.05 compared with control (Ctr) group, #P < 0.05 compared with As group, &P < 0.05 compared with Rap group, %P < 0.05 compared with 3-MA group, n = 3
Fig. 2
Fig. 2
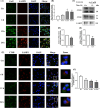
As impairs lysosomal degradative function in mouse primary BMDC cultures. A Immunofluorescence images stained with Lyso-Tracker Red or Lyso-Sensor Green treated with 1 μM As for the times indicated. B, C Quantification of Lyso-Tracker and Lyso-Sensor fluorescence intensity. Summary data from at least five visual fields in each independent experiment. D RT-PCR analysis showing mRNA expression of lysosome membrane proton pump genes exposed to 1 μM As for the times indicated. All summary data are normalized to control, and values reflect Mean ± SEM, scale bar: 20 μm, *P < 0.05 compared with control (Ctr) group, n = 4
Fig. 3
Fig. 3
As exposure leads to increase LMP as well as altered lysosomal cathepsins levels and distribution in primary BMDCs. A Representative immunofluorescence images for Gal3 and LAMP1 treated with 1 μM As for the times indicated. B Quantitative analysis of Gal3 fluorescence intensity. C Lysosomal CTSD and CTSB proteins treated with 1 μM As for 12 h by western blotting. D, E Quantification of CTSD and CTSB protein levels. F Representative images show CTSB (green) immunostaining with LAMP1 (red) by 1 μM As for the times indicated. G Co-localization of F is represented by yellow signals and quantified as Pearson’s correlation coefficient. All summary data are normalized to control, and values reflect Mean ± SEM, scale bar: 20 μm, *P < 0.05 compared with control (Ctr) group, n = 4
Fig. 4
Fig. 4
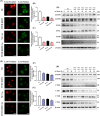
Knockdown of TFEB/TFE3 enhances lysosomal dysfunction in As-exposed primary BMDCs. Primary BMDCs were electro-transfected with plasmid carrying sgRNA-mediated knockdown of endogenous TFEB/TFE3 or NC plasmid. A Immunofluorescence images stained with Lyso-Tracker Red and Lyso-Sensor Green and exposed to 1 μM As for 12 h with TFEB knockdown. B, C Fluorescence intensity of Lyso-Tracker Red or Lyso-Sensor Green quantification, respectively (n = 4). D Western blotting of lysosome-associated proteins exposed to 1 μM As with TFEB knockdown for the times indicated. E Immunofluorescence images stained with Lyso-Tracker Red and Lyso-Sensor Green and exposed to 1 μM As for 12 h with TFE3 knockdown. F, G Fluorescence intensity of Lyso-Tracker Red or Lyso-Sensor Green quantification, respectively (n = 4). H Western blotting of lysosome-associated proteins exposed to 1 μM As with TFE3 knockdown for the times indicated. All summary data are normalized to negative control (NC), and values reflect Mean ± SEM, scale bar: 20 μm, *P < 0.05 compared with NC group, #P < 0.05 compared with NC + As group
Fig. 5
Fig. 5
Overexpression of TFEB/TFE3 attenuates lysosomal dysfunction in arsenic-exposed primary BMDCs. Primary BMDCs were electro-transfected with plasmid carrying exogenous TFEB/TFE3 or empty vector and then exposed to 1 μM As for 12 h. A Immunofluorescence images stained with Lyso-Tracker Red or Lyso-Sensor Green and exposed to As with TFEB overexpression. B, C Fluorescence intensity of Lyso-Tracker Red or Lyso-Sensor Green quantification, respectively (n = 4). D Western blotting of lysosome-associated proteins exposed to As with TFEB overexpression. E Immunofluorescence images stained with Lyso-Tracker Red or Lyso-Sensor Green and exposed to As with TFE3 overexpression. F, G Fluorescence intensity of Lyso-Tracker Red or Lyso-Sensor Green quantification, respectively (n = 4). H Western blotting of lysosome-associated proteins exposed to As with TFE3 overexpression. All summary data are normalized to negative control (NC), and values reflect Mean ± SEM. Scale bar: 20 μm. *P < 0.05 compared with NC group, #P < 0.05 compared with NC + As group
Fig. 6
Fig. 6
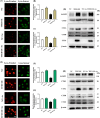
Knockdown of TFEB/TFE3 enhances LMP in As-exposed primary BMDCs. A, C Representative immunofluorescence images for Gal3 and LAMP1 exposed to 1 μM As for 12 h with TFEB or TFE3 knockdown, and quantitative analysis of the corresponding Gal3 fluorescence intensity are shown in B and D, respectively. All summary data are normalized to negative control (NC), and values reflect Mean ± SEM. Scale bar: 20 μm. *P < 0.05 compared with NC group, #P < 0.05 compared with NC + As group, n = 4
Fig. 7
Fig. 7
Overexpression of TFEB/TFE3 attenuates LMP in arsenic-exposed primary BMDCs. A, C Representative immunofluorescence images for Gal3 and LAMP1 exposed to 1 μM As for 12 h with TFEB or TFE3 overexpression, and quantitative analysis of the corresponding Gal3 fluorescence intensity are shown in B and D, respectively. All summary data are normalized to negative control (NC), and values reflect Mean ± SEM. Scale bar: 20 μm. *P < 0.05 compared with NC group, #P < 0.05 compared with NC + As group, n = 4
Fig. 8
Fig. 8
Autophagy flux is affected by knockdown or overexpression of TFEB/TFE3 in As-exposed primary BMDCs. A, D Western blotting of LC3-II and p62 exposed to 1 μM As with TFEB or TFE3 knockdown for the times indicated, quantitative analysis are shown in BC and EF, respectively (n = 3). G, J Western blotting of LC3-II and p62 exposed to 1 μM As with TFEB or TFE3 overexpression for 12 h, quantitative analysis are shown in HI and KL, respectively (n = 6). All summary data are normalized to negative control (NC), and values reflect Mean ± SEM. *P < 0.05 compared with NC group, #P < 0.05 compared with NC + As group
Fig. 9
Fig. 9
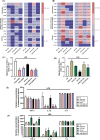
Knockdown or overexpression of TFEB/TFE3 on phenotypic molecules and cytokine expression in As-exposed primary BMDCs. A, B BMDCs were treated with 1 μM As for 2 h, stimulated with 25 ng/mL LPS for another 6 h with TFEB/TFE3 knockdown or overexpression. RT-PCR was performed and a heat map was generated to show the relative mRNA levels (Mean, n = 4) of nine phenotypic molecules and six cytokines, with significantly upregulated mRNA levels highlighted in red and significantly downregulated mRNA levels highlighted in purple. CF BMDCs were treated with 1 μM As for 2 h, stimulated with 25 ng/mL LPS for another 12 h with TFEB/TFE3 knockdown or overexpression. Cell migration rate (C, D, n = 3) as well as TNF-α, IL-1β, and IL-6 secretion in the supernatants (E, F, n = 4) were determined by transwell migration and ELISA assay, respectively. All summary data are normalized to negative control (NC), and values reflect Mean ± SEM. *P < 0.05 compared with NC group, #P < 0.05 compared with NC + As group
Fig. 10
Fig. 10
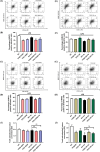
Knockdown or overexpression of TFEB/TFE3 on antigen presentation and antigen cross-presentation in As-exposed primary BMDCs. BMDCs were treated with 1 μM As for 2 h, stimulated with 25 ng/mL LPS for another 12 h with TFEB/TFE3 knockdown or overexpression. MHC II (A, B) and MHC I (C, D) molecules with TFEB or TFE3 knockdown, MHC II (E, F) and MHC I (G, H) molecules with TFEB or TFE3 overexpression were measured by flow cytometry and then quantified, respectively (n = 3). I, J Antigen cross-presentation was assessed using B3Z CD8 + T hybridoma cells co-cultured with BMDCs. BMDCs were treated with 1 μM As for 24 h with TFEB/TFE3 knockdown or overexpression, and activation of CD8 + T hybridoma cells was determined based on LacZ color conversion by optical density (OD) at 590 nm, n = 4. All summary data are normalized to negative control (NC), and values reflect Mean ± SEM. *P < 0.05 compared with NC group, #P < 0.05 compared with NC + As group
Fig. 11
Fig. 11
The proposed working model

Similar articles

Cited by

References

    1. Aits S. Methods to detect loss of lysosomal membrane integrity. Methods Mol Biol. 2019;1880:315–29. 10.1007/978-1-4939-8873-0_21. - PubMed
    1. Bretou M, Saez PJ, Sanseau D et al. Lysosome signaling controls the migration of dendritic cells. Sci Immunol. 2017;2(16). 10.1126/sciimmunol.aak9573. - PubMed
    1. Campbell GR, Rawat P, Bruckman RS, et al. Human immunodeficiency virus type 1 Nef inhibits autophagy through transcription factor EB sequestration. PLoS Pathog. 2015;11(6):e1005018. 10.1371/journal.ppat.1005018. - PMC - PubMed
    1. Contreras PS, Tapia PJ, Jeong E, et al. Beta-coronaviruses exploit cellular stress responses by modulating TFEB and TFE3 activity. iScience. 2023;26(3):106169. 10.1016/j.isci.2023.106169. - PMC - PubMed
    1. Ding J, Xie Y, Sun X, et al. Inhibition of TFEB promotes tumor-educated dendritic cells activation to enhance antitumor immune responses. Mol Immunol. 2022;147:30–9. 10.1016/j.molimm.2022.04.011. - PubMed

Publication types

Substances