. 2024 Feb;626(7997):169-176.
doi: 10.1038/s41586-023-06956-y. Epub 2024 Jan 24.

Motion of VAPB molecules reveals ER-mitochondria contact site subdomains

Affiliations

Motion of VAPB molecules reveals ER-mitochondria contact site subdomains

Christopher J Obara et al. Nature. 2024 Feb.

Abstract

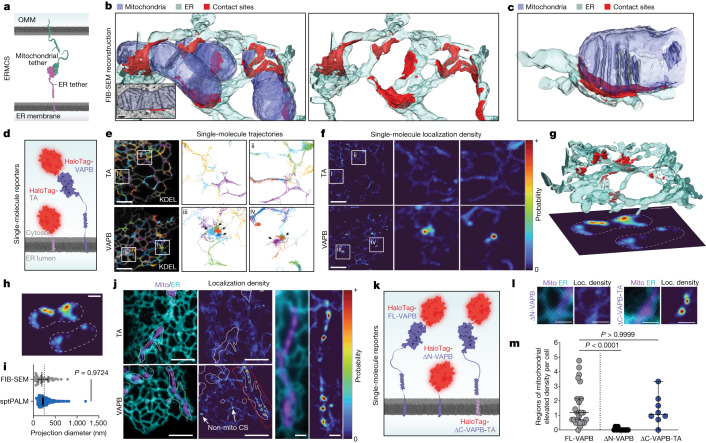
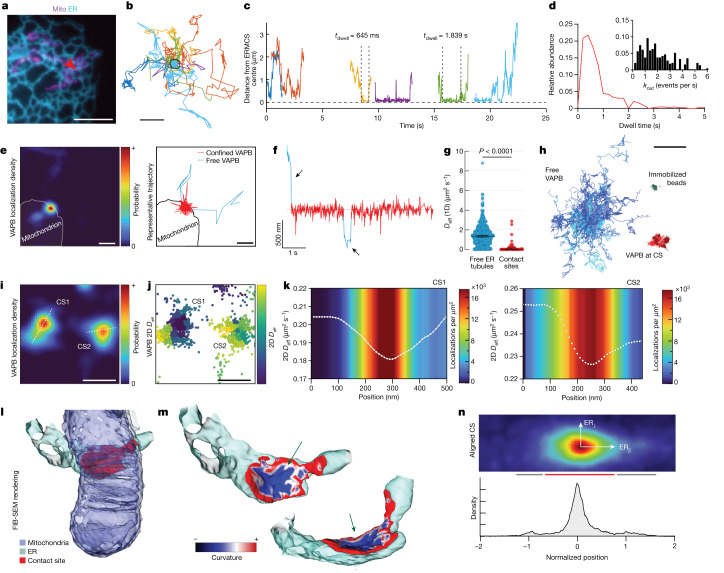
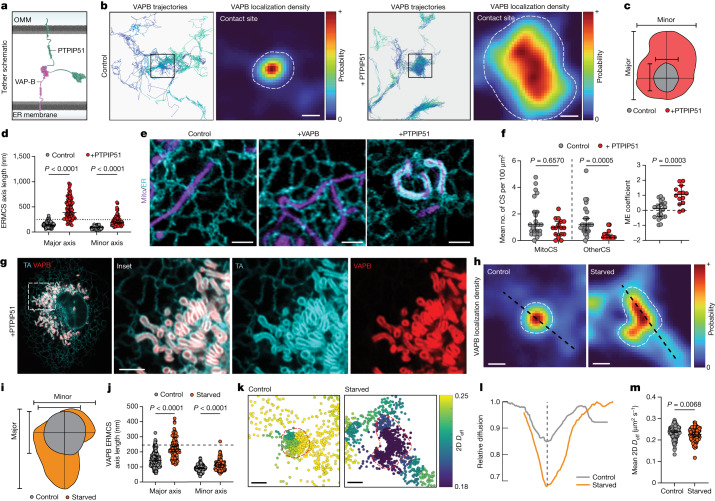
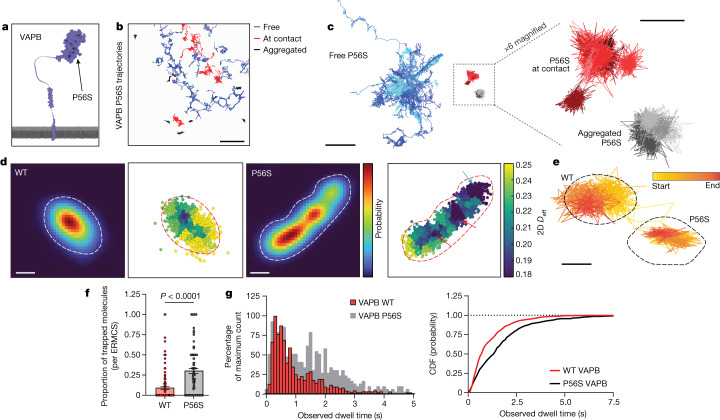
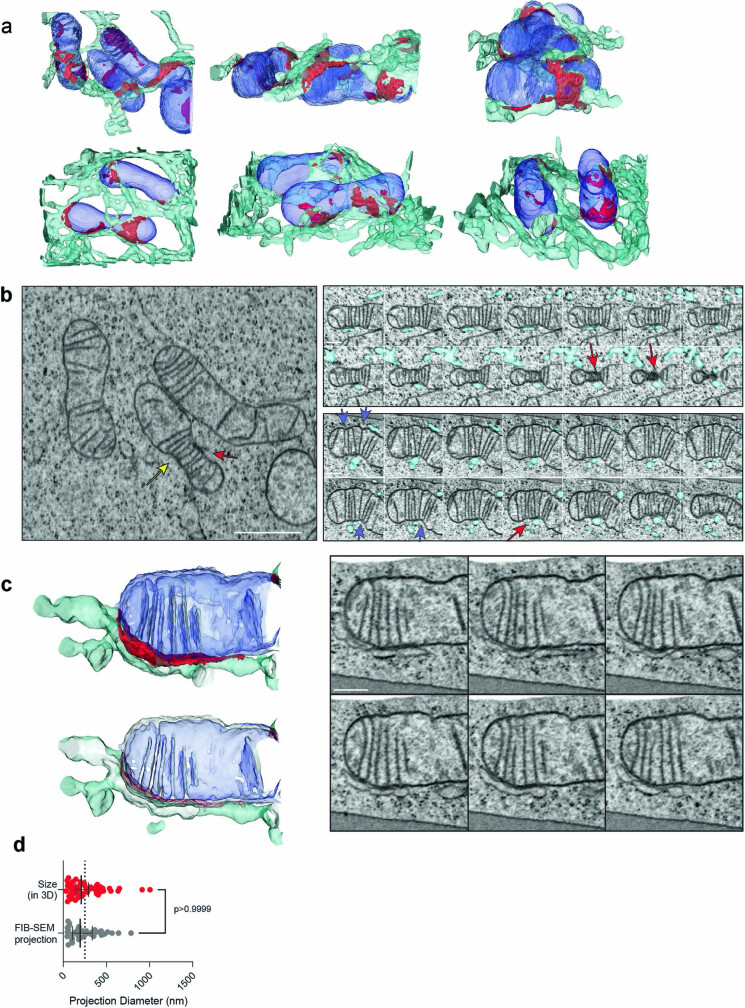
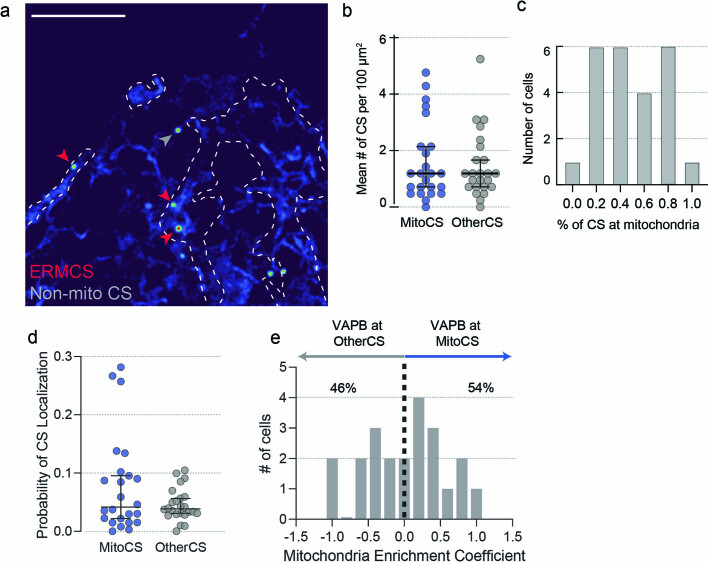
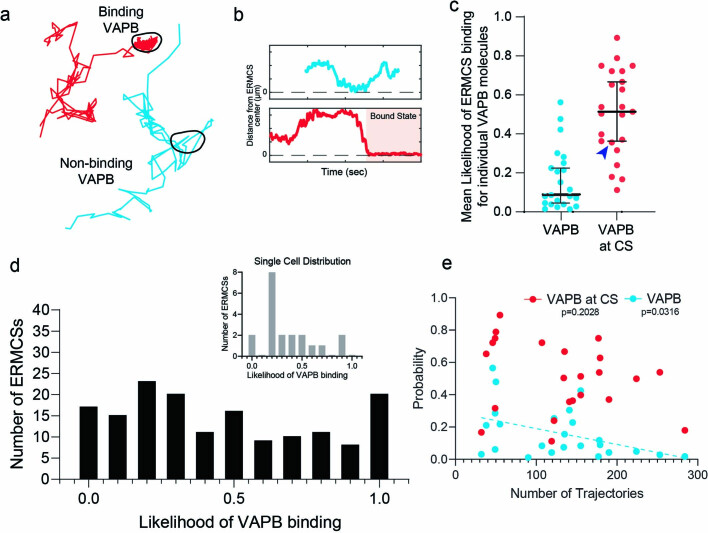
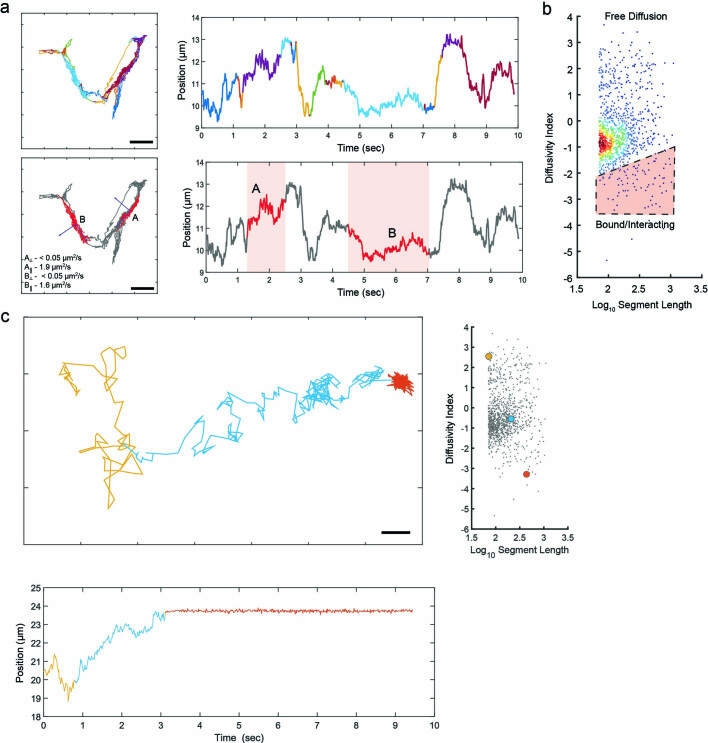
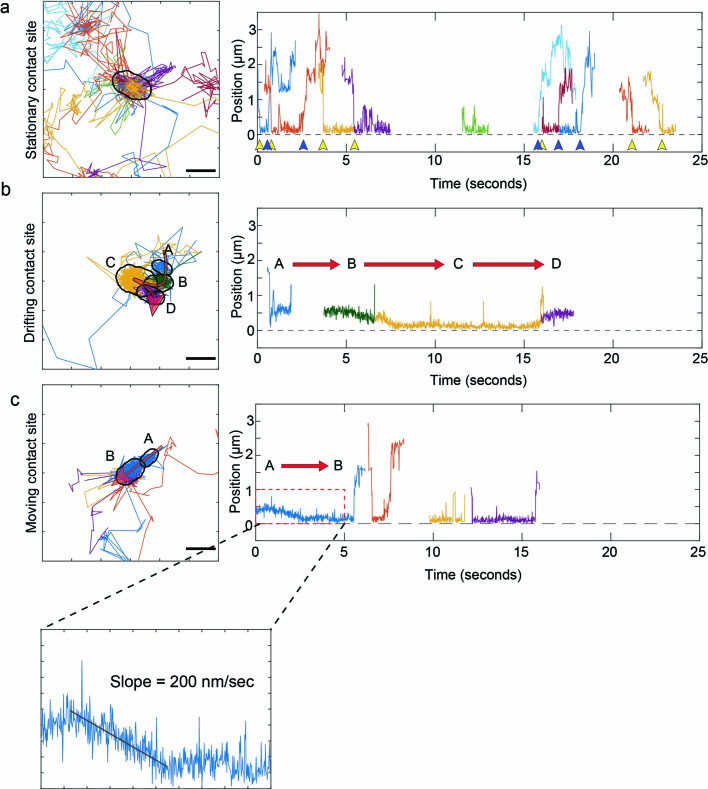
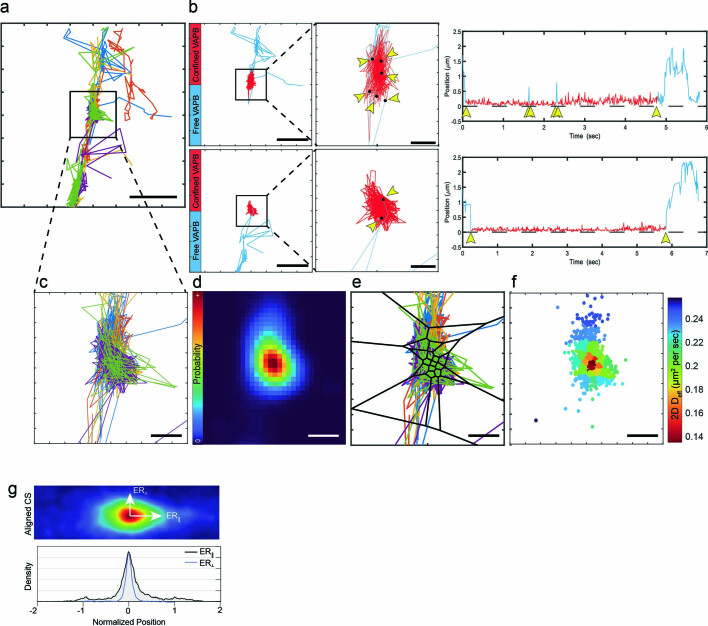
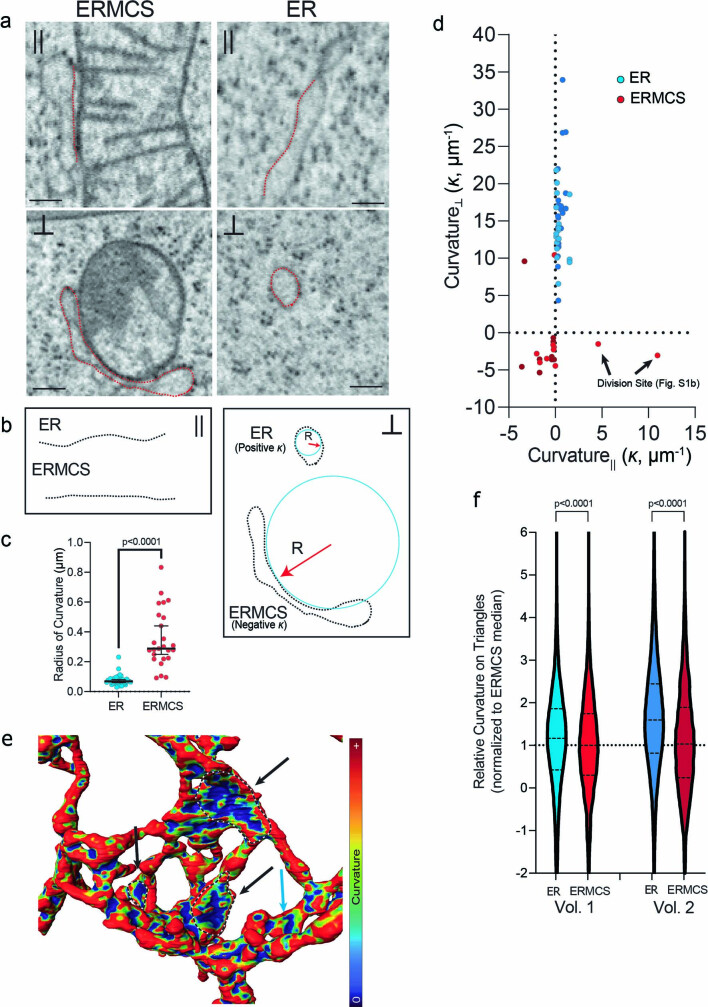
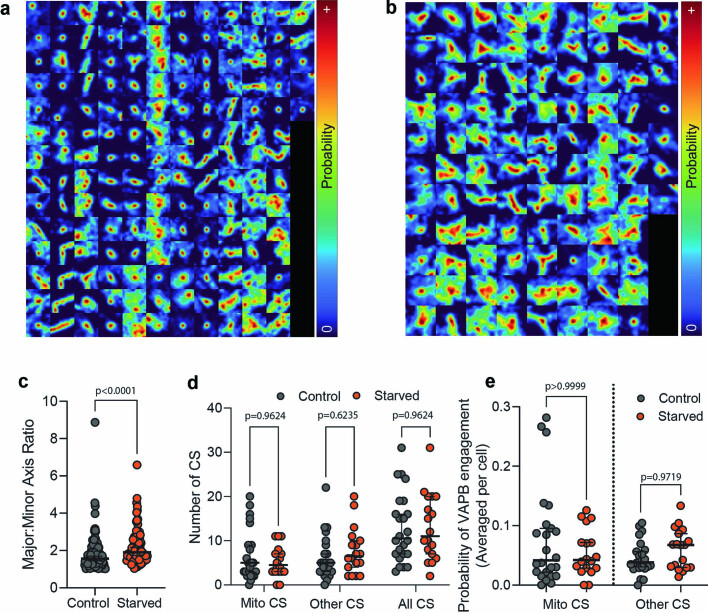
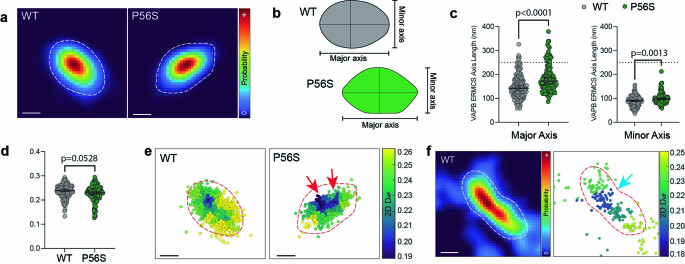
To coordinate cellular physiology, eukaryotic cells rely on the rapid exchange of molecules at specialized organelle-organelle contact sites1,2. Endoplasmic reticulum-mitochondrial contact sites (ERMCSs) are particularly vital communication hubs, playing key roles in the exchange of signalling molecules, lipids and metabolites3,4. ERMCSs are maintained by interactions between complementary tethering molecules on the surface of each organelle5,6. However, due to the extreme sensitivity of these membrane interfaces to experimental perturbation7,8, a clear understanding of their nanoscale organization and regulation is still lacking. Here we combine three-dimensional electron microscopy with high-speed molecular tracking of a model organelle tether, Vesicle-associated membrane protein (VAMP)-associated protein B (VAPB), to map the structure and diffusion landscape of ERMCSs. We uncovered dynamic subdomains within VAPB contact sites that correlate with ER membrane curvature and undergo rapid remodelling. We show that VAPB molecules enter and leave ERMCSs within seconds, despite the contact site itself remaining stable over much longer time scales. This metastability allows ERMCSs to remodel with changes in the physiological environment to accommodate metabolic needs of the cell. An amyotrophic lateral sclerosis-associated mutation in VAPB perturbs these subdomains, likely impairing their remodelling capacity and resulting in impaired interorganelle communication. These results establish high-speed single-molecule imaging as a new tool for mapping the structure of contact site interfaces and reveal that the diffusion landscape of VAPB at contact sites is a crucial component of ERMCS homeostasis.


Conflict of interest statement

The authors declare the following competing interests: C.P.C. is the founder and employed by Ursa Analytics, a company that offers statistical analysis services such as the non-parametric Bayesian approach utilized in this paper. All other authors declare no competing interests.

Figures

Fig. 1
Fig. 1. Altered ER tether motion at ER–mitochondria contact sites.
a, Cartoon indicating ER–mitochondrial tethering. b, 3D FIB-SEM reconstruction of ER (cyan), mitochondria (blue) and ERMCSs (red). Inset shows representative EM slice overlaid with segmentation masks. c, 3D reconstruction of an ERMCS with aligned cristae. d, Single-molecule tracers used in ef. e, sptPALM trajectories of either non-specific tail anchor (TA, top) or VAPB (bottom) overlaid on ER reference image (KDEL, white). Arrows indicate regions of spatially correlated motion. f, Spatial probability maps for TA (top) or VAPB (bottom) generated from trajectories in e. Hotspots indicate likely sites of VAPB tethering. ef are representative examples of n = 13 (TA, regions i and ii) or n = 24 (VAPB, regions iii and iv) cells. g, 3D EM reconstruction of contact sites (CS) (red) between ER (cyan) and mitochondria (not shown), with simulated sptPALM localization densities from the volume projected below. Dashed lines indicate mitochondria borders. h, Simulated localization densities from g. i, Contact size measured from FIB-SEM simulation projections or from single-molecule localization density (n = 466 contact sites (sptPALM), 38 contact sites (FIB-SEM); P = 0.9724, Dunn’s multiple comparisons test, two-sided). Dotted line indicates confocal microscopy resolution limit. j, Micrograph of ensemble ER and mitochondria reporters (left), with corresponding TA or VAPB probability maps (centre) and magnified inset (right) in an example cell. Outlines indicate the area explored by each mitochondrion during the experiment. See Extended Data Fig. 2 for full dataset. k, Cartoon indicating VAPB single-molecule tracers used in lm. ΔN-VAPB, deletion of the N terminus; ΔC-VAPB-TA; replacement of the C terminus with TA. l, Representative ERMCSs with associated localization (Loc.) densities for the tracer molecules shown in k. m, Number of mitochondria-associated regions of enhanced tethering per cell for the indicated VAPB reporters (n = 24 (VAPB), 12 (ΔN-VAPB), 8 (ΔC-VAPB-TA); P < 0.0001, P > 0.9999, Dunn’s multiple comparisons test, two-sided). Error bars show the median and 95% confidence interval. Scale bars, 100 nm (b), 5 µm (e,f,j), 1 µm (j, inset), 500 nm (g–h), 1 µm (l).All panels are representative of at least two independently performed experiments with similar results. Source Data
Fig. 2
Fig. 2. Dynamic interactions generate a variable VAPB diffusion landscape within single ER–mitochondria contact sites.
a, Ensemble image of ER and mitochondria. Arrow indicates ERMCS (one cell of 24 similar shown). b, VAPB trajectories within this ERMCS (pseudo coloured by molecule). c, Time traces of selected trajectories in b. d, Measured dwell time of VAPB molecules at all ERMCSs measured. Inset shows leaving frequency of molecules within the ERMCS (n = 427 binding interactions, median = 556 ms). e, VAPB localization density of an ERMCS with representative interacting single VAPB trajectory colour coded by diffusion state. f, Distance of single VAPB molecule from the ERMCS centre (pseudo coloured by diffusion state, arrows indicate free ER diffusion). g, Effective one-dimensional diffusion coefficient of trajectory segments in ER tubules versus in ERMCSs (n = 700 segments in free ER, 48 segments in ERMCSs; P < 0.0001, two-sided Mann–Whitney, error bars show 95% confidence interval of the median). h, Representative centre-aligned trajectory segments of free VAPB, ERMCS-associated VAPB or immobilized beads. i, Localization density of two adjacent ERMCSs on the same mitochondrion (CS1 and CS2). Lines represent axes used in k. j, Location of single-molecule steps associated with the contact sites in e, coloured by mean two-dimensional (2D) Deff in the local neighbourhood. k, Mean 2D Deff in a 30 nm neighbourhood at each 10 nm step along the lines specified in e. Colourmap indicates net localization density. l, 3D EM reconstruction of an ERMCS. m, ER membrane within the contact site colour coded by local curvature. Arrows indicate sites with negative ER curvature within potential tethering distance for VAPB. n, Collective VAPB localization density across aligned contact sites between ER tubules and mitochondria in the cell periphery. Red bar indicates approximately Gaussian decay at the contact site centre, grey bar indicates shoulders extending into the ER tubules. Scale bars, 5 µm (a), 500 nm (b,e,f,i,j), 2 µm (h). Time bar, 1 s (f). Source Data
Fig. 3
Fig. 3. VAPB contact sites dynamically reorganize according to tether availability and metabolic needs.
a, Cartoon of VAPB-PTPIP51 tethering at an ERMCS. b, Representative trajectories and corresponding localization densities for VAPB at ERMCSs in control (left) or PTPIP51-overexpressing (right) cells. Dashed lines indicate contact site boundaries. c, Overlaid ERMCS footprints from b with axes indicated. d, VAPB-associated ERMCS size in control or PTPIP51-overexpressing cells (n = 160 ERMCSs (control), 64 ERMCSs (+PTPIP51); major P < 0.0001, minor P < 0.0001; Dunn’s multiple comparisons test, two-sided). Line indicates confocal microscopy resolution limit. e, Airyscan micrographs of ER (cyan) and mitochondria (magenta) in either control, VAPB-overexpressing, or PTPIP51-overexpressing cells. f, Number of total VAPB organelle contact sites in control or PTPIP51-overexpressing cells (n = 24 cells (control), 16 cells (+PTPIP51); P = 0.6570, P = 0.0005; Dunn’s multiple comparisons test, two-sided) and mitochondrial enrichment coefficient derived from the same cells (n = 22 cells (control), 14 cells (+PTPIP51); P = 0.0003; Dunnett’s T3 multiple comparisons test, two-sided). g, Airyscan micrograph of TA (cyan) and VAPB (red) in a COS7 overexpressing PTPIP51 (untagged). h, Representative VAPB localization density at ERMCSs in control (complete medium) or starved (HBSS 8 h) cells. Line profiles indicate axes used for i; dashed lines indicate contact site boundaries. i, Overlaid ERMCS footprints from h. j, Contact site size in control or starved cells (n = 160 ERMCSs (control), 96 ERMCSs (starved); major P < 0.0001, minor P < 0.0001; Dunn’s multiple comparisons test, two-sided); line indicates confocal microscopy resolution limit. k, Single-molecule steps associated with the contact sites in h, coloured by the mean 2D Deff in the local neighbourhood. l, Effective 2D diffusion coefficient of VAPB from h, normalized to neighbouring ER regions (dashed line indicates contact site centre). m, Mean 2D Deff within contact sites in either control or starved cells (n = 160 ERMCSs (control), 96 ERMCSs (starved); P = 0.0068; Dunn’s multiple comparisons test, two-sided). Error bars indicate 95% confidence interval of the median. Scale bars, 200 nm (b,h,k), 2.5 µm (e), 2.5 µm (g). Source Data
Fig. 4
Fig. 4. The ALS-linked VAPB P56S mutation displays aberrant motility at ER–mitochondria contact sites.
a, A cartoon indicating the approximate location of the P56S mutation in the MSP domain of VAPB. b, Selected molecular trajectories of P56S VAPB in a representative COS7 cell. Tracks are colour coded by their primary state of motion (Methods). c, Grouped and overlaid representative trajectory segments of P56S VAPB in COS7 cells. d, Localization density in a representative ERMCS of HaloTag fused to either WT or P56S VAPB and corresponding local diffusion maps. Note the existence of multiple distinct low diffusion wells in the P56S VAPB ERMCS landscape, some of which correspond to high net tether density (red arrows) and some of which do not (blue arrow). Dotted lines delineate the edge of the contact site. e, Single representative ERMCSs of WT or P56S VAPB with the trajectory traversed by a single VAPB molecule plotted above. Note the effective confinement of P56S VAPB resulting in a trapped state, the molecule does not encounter the edges of the ERMCS. f, Quantification of the mean proportion of molecules trapped in WT or P56S VAPB ERMCSs for the full lifetime of the fluorochrome. (n = 160 (WT), 120 (P56S) contact sites, bars show mean ± s.e.m.; P < 0.0001, two-sided Mann–Whitney test). g, Observed dwell times for WT or P56S VAPB molecules in ERMCSs and the associated cumulative distribution function for trajectories in the bound state (n = 734 (WT), 483 (P56S) binding interactions; median values: WT, 715 ms; P56S, 1.358 s). Scale bars, 5 µm (b), 2 µm (c, left), 500 nm (c, right), 200 nm (d), 250 nm (e). Source Data
Extended Data Fig. 1
Extended Data Fig. 1. FIB-SEM reveals association of ER-mitochondrial contact sites and known contact site-associated biology.
a, Reconstructed surfaces of ER and mitochondria in association from the FIB-SEM volumes used in this study from several angles. Mitochondria blue, ER cyan, ER membrane within approximate tethering distance of VAPB is colored red. b, Serial slices through an ER-associated site of mitochondrial constriction. Upper panels are every 24 nm from above as viewed in the image to the left, lower panels are every 48 nm from the side of the yellow arrow in the direction of the red arrow in the left image. Red arrows correspond to regions of contact site interface with unusual electron density, presumably associated with mitochondrial division machinery. Blue arrows indicate regions of mitochondrial constriction propagating away from the site of direct contact by the ER, generally aligned with enriched cristae at the site. This is one of two ERMCSs with this architecture in the volume (see Extended Data Fig. 7). c, The site of aligned cristae shown in Fig. 1b with more context. Lower panel is a cut away of the reconstruction above to the central axis of the mitochondria, showing continuity of the cristae with the inner membrane space. Panels to the right are selected single slices of raw EM data through the contact site shown, taken every 64 nm. This is one representative ERMCS of 25 with similar structures throughout the volume. d, Comparison of the measured sizes of ERMCSs in three dimensions from FIB-SEM volumes and the corresponding projection into two dimensions blurred by the resolution of sptPALM. Error bars represent the 95% confidence interval of the median (n = 38 [projected], 52 [three dimensional]; p > 0.9999, Dunn’s multiple comparisons test, two-sided). Note some ERMCSs that are close in space are no longer distinguishable when projected down into two dimensions. Scale Bars: b, 1 µm, inset, 400 nm; c, 400 nm. Source Data
Extended Data Fig. 2
Extended Data Fig. 2. Comparisons of VAPB interactions with mitochondria-associated and non-mitochondria associated structures.
a, The likelihood of VAPB localization in a representative cell, showing hotspots associated with mitochondria (red arrows) and a hotspot associated with other structures (grey arrow). Shown is one cell of 24 collected with various hotspot distributions (see Fig. 1 for other examples). b, Frequency of VAPB contact sites associated with mitochondria or other organelles in COS7 cells (n = 24 cells from 3 experiments). Error bars indicate the median and 95% confidence interval of the median. c, Variability in the proportion of VAPB contact sites that are associated with mitochondria as opposed to other organelles, suggesting adaptability of tether function as a result of cellular needs. d, The probability of a randomly selected VAPB molecule localization being associated with contact sites on mitochondria or other structures, as averaged for each cell (n = 24 cells from 3 experiments). Error bars indicate the median and 95% confidence interval of the median. e, The distribution of mitochondrial enrichment coefficients over the cells in the dataset, showing heterogeneity in tether targets as a result of cellular needs. Scale bars: 500 nm. Source Data
Extended Data Fig. 3
Extended Data Fig. 3. Individual ERMCS show variability in capacity to bind passing VAPB molecules.
a, Two representative trajectories of single VAPB molecules passing the same ERMCS. ERMCS boundary is indicated by the black line. b, Time traces of the trajectories shown in a; the period of direct contact site interaction is indicated by the shaded background. c, The average probability of ERMCS interaction over all VAPB trajectories in a cell or just those that physically encounter an ERMCS, showing the majority of VAPB is freely diffusing in the ER (n = 23 cells). Error bars indicate the median and 95% confidence interval of the median. The blue arrow indicates the cell used as an example in the inset of (d). d, The distribution of likelihoods for VAPB binding, as calculated for individual contact sites (n = 160 contact sites). The inset shows the distribution of the single cell indicated by the blue arrow in c (n = 20 contact sites). e, Average likelihood of individual VAPB molecules engaging with ERMCSs as a function of VAPB expression level. Note that the probability of ERMCS-associated VAPB engagement is uncorrelated to VAPB expression level, suggesting the law of mass action is satisfied (n = 24 cells; p = 0.2028 VAPB, p = 0.0316 VAPB at ERMCS; two-sided F-test, dFn=1 dFd=22, testing significance of the slope being different from zero). Source Data
Extended Data Fig. 4
Extended Data Fig. 4. Latent states can be inferred from trajectory segments with similar mobility profiles.
a, Latent states determined in a single freely diffusing VAPB molecule within ER tubules (not shown). Two states with sufficient steps for analysis are highlighted in the lower panels, showing that diagonalization of the force and diffusion tensors reveals the native axis of the ER tubule (eiganvectors shown in blue). Diffusion in the perpendicular direction (around the tubule) is negligible, but diffusion along the long axis is discernible and consistent with literature values. b, Segments of individual trajectories of VAPB can be characterized by the diffusivity index (see Supplementary Text), with bound states showing lower indices. A scatter plot of diffusivity index vs. segment length is shown, the red gate indicates segments considered to be interacting. c, A single VAPB trajectory with three discernible states. Segments of the trajectory defined to be in each state are colour coded in the xy-projection of the trajectory (upper) and in a time projection (lower). The diffusivity index for each trajectory is shown against the full set of analyzed VAPB trajectory segments in the scatter plot on the right, for context. Scale Bars: 500 nm.
Extended Data Fig. 5
Extended Data Fig. 5. VAPB-mediated ERMCS contact site mobility is visible in VAPB trajectory analysis.
a-c, Representative examples of ER-mitochondria contact sites undergoing motion, showing a number of individual VAPB molecules exploring the site over the time scale shown. Panels to the left show trajectories colored by molecule, panels to the right show the distance to the center of the contact site over time for the trajectories on the left. Yellow arrows indicate entry events of a single VAPB molecule, blue arrows indicate exit events. Red arrows correspond to shifts in the mean location of confined trajectories over time, representing distinct contact site locations as a result of mitochondrial motion. Note the directed motion in the bottom example corresponds to a linear speed consistent with TAC-mediated motion in COS7 cells.
Extended Data Fig. 6
Extended Data Fig. 6. Stationary contact sites show spatially stable regions of common molecular behaviour.
a, A set of VAPB trajectories associated with a single ER-mitochondrial contact site, colored by trajectory. b, The xy-projections and time projections of trajectories of two distinct VAPB molecules that entered and left the contact site in a) are shown. Segments are color coded by their state, as defined in Extended Data Fig. 4b. Points where the molecules changed from freely diffusing states to confined states or vice versa are indicated with black dots and yellow arrows. c, A zoomed view of the contact site in a) scaled to match the subsequent panels. d, The probability density of finding a VAPB molecule across the contact site integrated over the 60 s time window it was deemed to be stationary. e, Voronoi tessellations derived from the density in d) used to segment individual steps of the VAPB trajectories for spatially-defined diffusion analysis. f, The effective 2D diffusion coefficient of the steps in e), grouped and solved by tessellation. Scale bars: a, 1 µm; b, 1 µm, insets, 200 nm; c-f, 200 nm.
Extended Data Fig. 7
Extended Data Fig. 7. Changes in ER curvature within ERMCSs.
a, Single slices through the longitudinal (parallel to the central cylindrical axis of the structure) and perpendicular axes of a representative ERMCS or a neighboring ER control in the cytoplasm. Red lines indicate the location of the ER membrane. These are single representative images of n = 39 (ER tubules) or n = 25 (ERMCSs) collected through the two FIB-SEM volumes. b, Schematic of the ER cross sections in a and their methods of analysis. Note that in the longitudinal sections, ER membrane curvature (κ) is largely neutral, but in the perpendicular sections it can be highly positively curved (curving towards ER lumen) or negatively curved (curving away from ER lumen). The radius of curvature (R) is inversely proportional to the degree of curvature (κ). c, The radius of curvature of the ERMCS and isolated ER in the FIB-SEM volumes. Isolated ER controls are selected within 5 μm of each ERMCS (n = 39 tubules, 25 ERMCSs; p < 0.0001; two-sided Mann Whitney test). Error bars represent the median and 95% confidence interval for the median. d, Curvature along the parallel or perpendicular dimensions of the ERMCS or local ER controls as demonstrated in b. e, Local ER curvature as calculated in three dimensions on the triangulated mesh generated from the surface of the ER membrane in a representative FIB-SEM volume. Sites of contact with mitochondria (not shown for clarity) are traced with dotted lines and indicated with black arrows. The blue arrow indicates a site of direct contact with a mitochondrion facing away from the viewer. f, Relative mean local curvature of ERMCS- or non-CS-associated ER membrane as calculated from the triangulated surface in the two volumes shown in Extended Data Fig. 1 and normalized to median value in the ERMCSs. Dotted lines in the plots show the median and quartiles. (ERMCS data is n = 133,494 [vol1] or n = 37,062 [vol2] triangulated faces within ERMCSs, control ER is n = 500,000 triangulated faces selected randomly from the ER outside the ERMCSs in the matched volume. P-values are approximated from the z distribution of a Kruskal-Wallis test using two-sided Dunn’s multiple comparisons test to adjust direct comparisons for multiplicity). Scale Bars: 200 nm. Source Data
Extended Data Fig. 8
Extended Data Fig. 8. Variability of VAPB contact site size and shape in well fed and starved cells.
a, Spatially-defined probability of VAPB localization in 160 mitochondria-associated contact sites from cells cultured in complete DMEM. A 1.2 µm x 1.2 µm square around the center of each contact site is shown, note that proximal contact sites often appear in the images of their neighbors. b, 96 mitochondria-associated VAPB contact sites displayed as in a), for cells cultured in HBSS for 8 h. Note the asymmetric nature of contact site expansion under these conditions. c, The ratio of Major:Minor axis of ellipse fits to spatially-defined VAPB localization probability within individual contact sites, showing asymmetric expansion of contact sites under nutrient deprivation (n = 160 [Control], 96 [Starved]; p < 0.0001; Mann-Whitney test, two-sided). Error bars indicate the median and 95% confidence interval of the median. d, The number of mitochondria-associated (MitoCS), other structure-associated (OtherCS), or total number of CSs in control cells or cells starved with an 8-hour incubation in HBSS (n = 24 [Control], n = 18 [Starved]; p = 0.9244 MitoCS, p = 0.2780 OtherCS, p = 0.8060 TotalCS; two-sided Mann-Whitney tests with Holm-Šidák threshold for multiple comparisons). Error bars indicate the median and 95% confidence interval of the median. No significant difference observed suggests continued regulation of VAPB at both classes of contact sites. e, The likelihood of VAPB engagement at ERMCSs or other contact sites in control cells or cells starved by 8 h in HBSS, averaged per each cell, showing VAPB is not largely depleted from the ER during starvation as in PTPIP51 overexpression (n = 24 DMEM, n = 18 HBSS; p > 0.9999 MitoCS, p = 0.9719 OtherCS, Dunn’s multiple comparisons test, two-sided). Error bars indicate the median and 95% confidence interval of the median. Source Data
Extended Data Fig. 9
Extended Data Fig. 9. Additional characterization of ERMCS interactions of P56S VAPB molecules.
a, Spatially-defined probability of VAPB localization in representative WT or P56S VAPB-expressing cells. b, Schematic showing approximate major and minor axis of the examples ERMCSs in a. c, The size of the major and minor axes of ellipse fits to the probability of VAPB localization within the ERMCS, showing slight but significant expansion of ERMCSs in P56S VAPB-expressing cells (n = 160 [WT],118 [P56S]; p < 0.0001 Major, p = 0.0013 Minor; Dunn’s multiple comparisons test, two-sided). Error bars indicate the median and 95% confidence interval of the median. d, The 2D Deff of WT or P56S VAPB averaged over entire ERMCSs (n = 160 [WT], 118 [P56S]; p = 0.0528; Dunn’s multiple comparisons test, two-sided). Error bars indicate the median and 95% confidence interval of the median. e, The diffusivity landscape of the WT or P56S VAPB ERMCSs shown in a. Red arrows indicate the asymmetric diffusion well at the center of the P56S VAPB-containing ERMCS. f, An example of a large WT VAPB-containing ERMCS similar in size to the one shown in Fig. 4d, showing a single, central diffusion well at the center of the contact site (blue arrow). Source Data

References

    1. Prinz WA, Toulmay A, Balla T. The functional universe of membrane contact sites. Nat. Rev. Mol. Cell Biol. 2019;21:7–24. doi: 10.1038/s41580-019-0180-9. - DOI - PMC - PubMed
    1. Phillips MJ, Voeltz GK. Structure and function of ER membrane contact sites with other organelles. Nat. Rev. Mol. Cell Biol. 2016;17:69–82. doi: 10.1038/nrm.2015.8. - DOI - PMC - PubMed
    1. Zung N, Schuldiner M. New horizons in mitochondrial contact site research. Biol. Chem. 2020;401:793–809. doi: 10.1515/hsz-2020-0133. - DOI - PubMed
    1. Csordás G, Weaver D, Hajnóczky G. Endoplasmic reticulum–mitochondrial contactology: structure and signaling functions. Trends Cell Biol. 2018;28:523–540. doi: 10.1016/j.tcb.2018.02.009. - DOI - PMC - PubMed
    1. Eisenberg-Bord M, Shai N, Schuldiner M, Bohnert M. A tether is a tether is a tether: tethering at membrane contact sites. Dev. Cell. 2016;39:395–409. doi: 10.1016/j.devcel.2016.10.022. - DOI - PubMed

MeSH terms

Substances

LinkOut - more resources