. 2024 Jan 25;14(1):2129.
doi: 10.1038/s41598-024-52520-7.

Non-invasive assessment and visualization of Phytophthora cactorum infection in strawberry crowns using quantitative magnetic resonance imaging

Affiliations

Non-invasive assessment and visualization of Phytophthora cactorum infection in strawberry crowns using quantitative magnetic resonance imaging

Teemu Valtteri Tuomainen et al. Sci Rep. .

Abstract

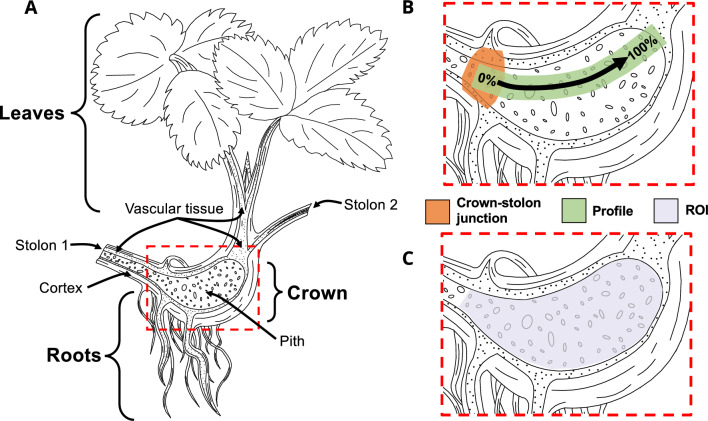
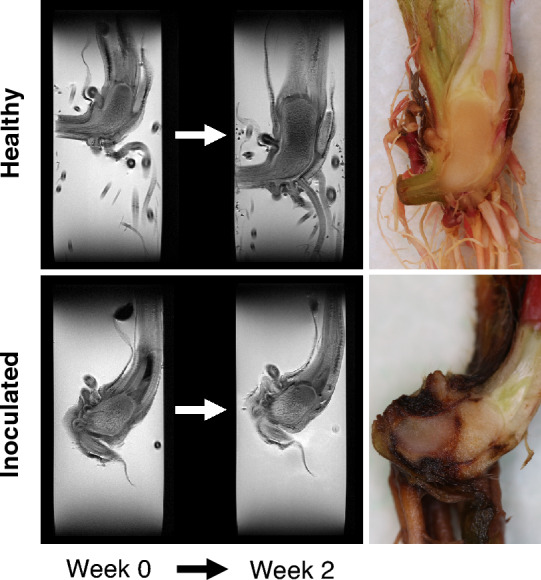
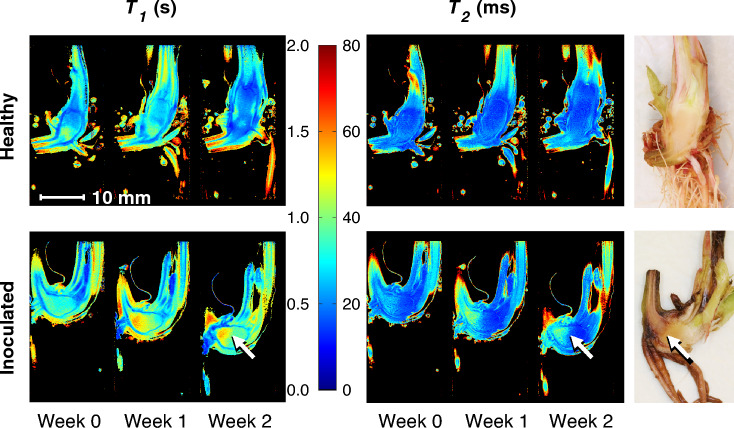
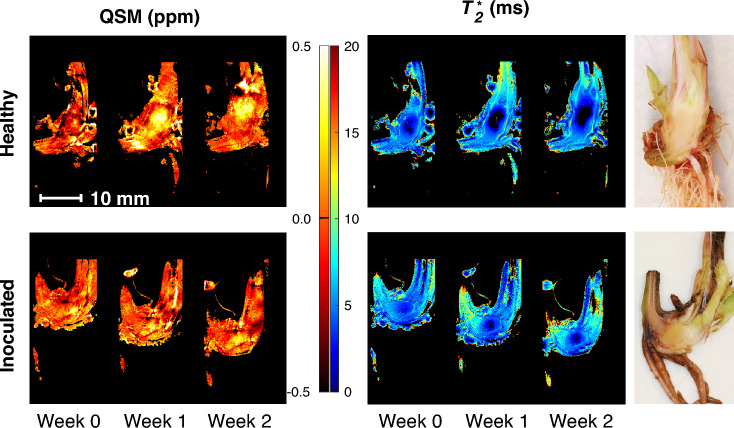
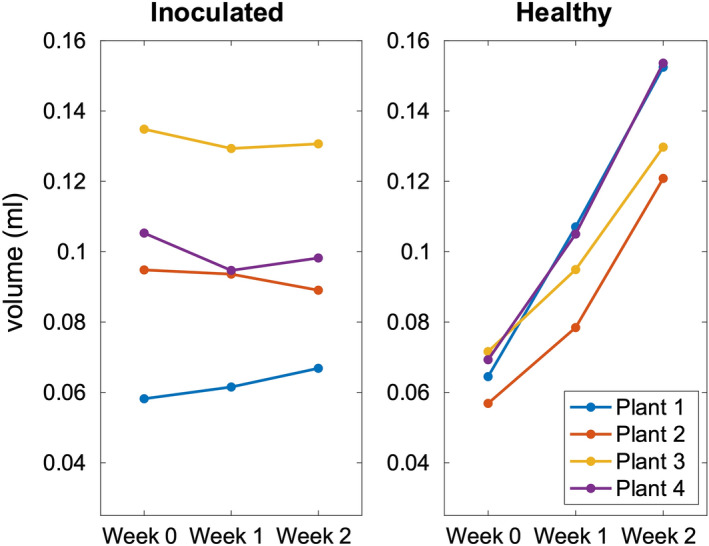
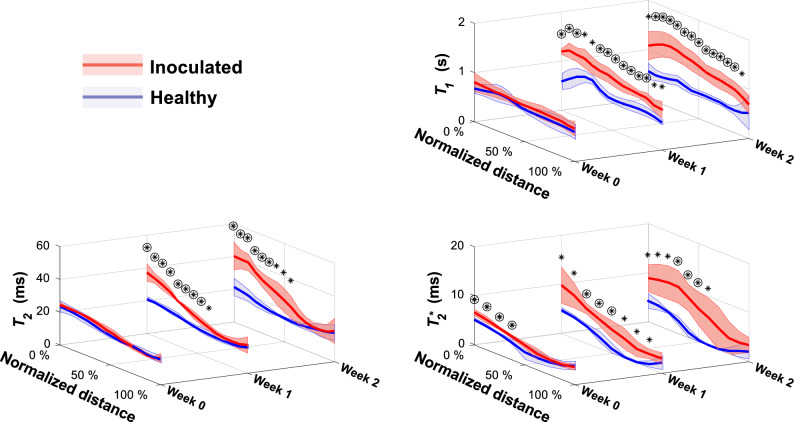
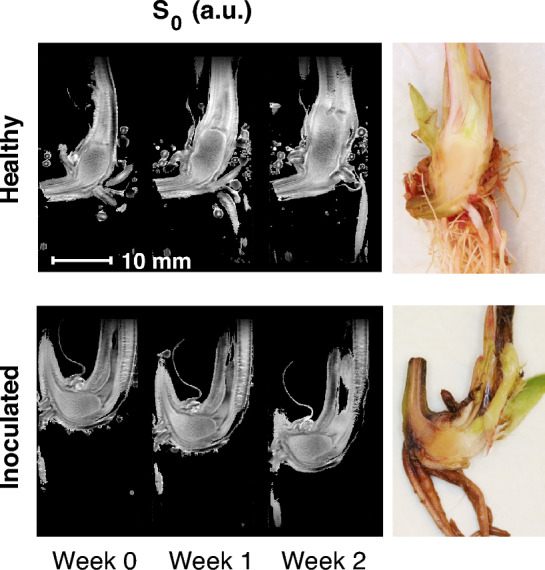
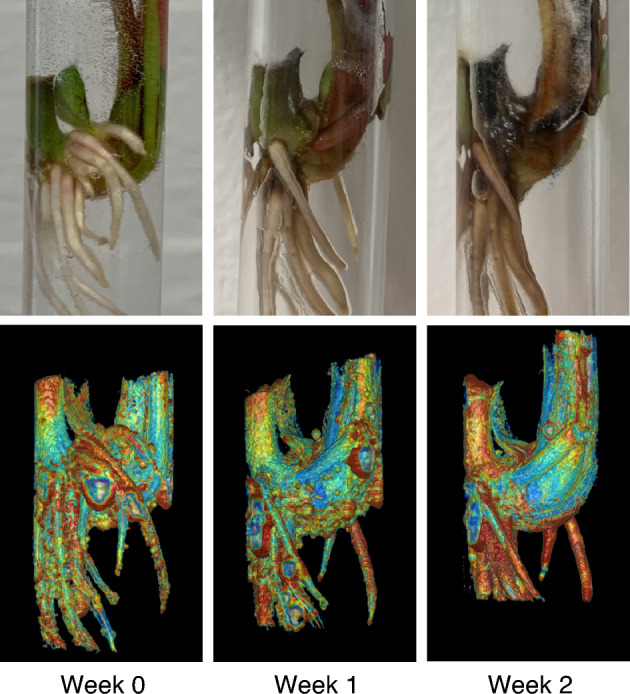
Phytophthora cactorum is an oomycete species that causes enormous losses on horticultural crops, including strawberries. The purpose of this work was to investigate the alterations caused by P. cactorum inoculation in hydroponically grown strawberry plantlets (Fragaria × ananassa Duch.) using quantitative magnetic resonance imaging (qMRI). It was observed that with MRI, spatial and temporal progression of the infection could be observed in the crown using quantitative MR parameters, namely relaxation time maps. Relaxation times are numeric subject-specific properties that describe the MR signal behavior in an examined anatomical region. Elevated [Formula: see text] relaxation time values were observed inside the infected plant crowns with respect to the healthy references. The [Formula: see text] and [Formula: see text] values of healthy plants were small in the crown region and further diminished during the development of the plant. Furthermore, elevated [Formula: see text] relaxation time values were seen in regions where P. cactorum progression was observed in corresponding plant dissection photographs. Quantitative susceptibility maps (QSM) were calculated to estimate the local magnetic field inhomogeneities. The QSM suggests magnetic susceptibility differences near the center of the pith. This study provides novel non-invasive information on the structure and development of strawberry plants and the effects caused by the P. cactorum infection.


Conflict of interest statement

The authors declare no competing interests.

Figures

Figure 1
Figure 1
Simplified schematic illustration of strawberry plant structures and an example of the profile selection. (A) Simplified illustration of Fragaria × ananassa structures, namely leaves, crown and roots to assist in the interpretation of the MR images and quantitative data. Stolon 1 is connected to the mother plant and Stolon 2 to the daughter plant. (B) Example selection used for presenting average relaxation time profile data. The arrow indicates the direction and increase in distance from the crown-stolon junction in the profiles in Fig. 6. The presented approximate crown-stolon junction was used as a starting point for the profile. (C) Example of a region-of-interest (ROI) section for volumetric analysis of the pith region.
Figure 2
Figure 2
Raw MR images from MEMS data. MR images obtained with multi echo multi slice (MEMS) pulse sequence utilizing the shortest echo time (TE = 9.98 ms) of healthy and inoculated plantlets at different time points. Observe the free water surrounding the plantlets and the limited RF coil range near the upper and lower bounds of the image. The representative examples here are #1 from healthy and #2 from inoculated plantlets presented in Supplementary Fig. S1 online.
Figure 3
Figure 3
Examples of relaxation time maps of healthy and inoculated plants during development. Quantitative T1 and T2 relaxation time maps of healthy and inoculated strawberry crowns during a two-week development period after inoculation. T1 and T2 relaxation time maps are calculated from fast spin echo multi slice—inversion recovery (FSEMS-IR) and multi echo multi slice (MEMS) pulse sequence MRI data, respectively. Differences in the visibility of the stolon and root structures between time points is due to slightly different MR image slice positions. The representative examples here are #4 from healthy and #1 from inoculated plants presented in Supplementary Fig. S1 online. Relaxation time data from surrounding water have been omitted (black). The white arrow indicates the observed progressing edge of the infection in the dissection photograph as well as the same position at the relaxation time maps. The color gradient represents the relaxation times for each region, from relatively low relaxation time values (blue) to relatively high relaxation time values (red), and relaxation time values in-between (cyan, green, yellow and orange).
Figure 4
Figure 4
Example of QSM and T2 relaxation time maps. Quantitative T2 map and quantitative susceptibility map (QSM) of healthy and inoculated strawberry crowns during the two-week development period after inoculation. Mean of 10 consecutive slices from T2 relaxation time maps and quantitative susceptibility maps (QSM) are presented. Averaging effectively provides the same slice thickness as obtained with T1 fast spin echo multi slice—inversion recovery (FSEMS-IR) and T2 multi echo multi slice (MEMS) data sets. Differences in the visibility of the stolon and root structures between time points are due to slightly different MR image slice positions. For comparison, similar positions with respect to the relaxation time maps in Fig. 3 were selected for these maps. The representative examples here are #4 from healthy and #1 from inoculated plantlets presented in Supplementary Fig. S1 online. Relaxation data from surrounding water have been omitted (black). For Fig. 4a, the color gradient represents magnetic susceptibilities from negative diamagnetic susceptibility (dark red) to positive paramagnetic susceptibility (light yellow), with zero susceptibilities in-between (orange). For Fig. 4b, the color gradient represents the relaxation times for each region, from relatively low relaxation time values (blue) to relatively high relaxation time values (red), and relaxation time values in-between (cyan, green, yellow and orange).
Figure 5
Figure 5
Volume of the crown pith. Manually segmented approximate crown pith volumes from MGE data (shortest TE) for healthy and inoculated plantlets.
Figure 6
Figure 6
Average relaxation time profiles across the healthy and inoculated crown piths at different time points. Point-wise average profiles from T1, T2 and T2 data (FSEMS-IR, MEMS and MGE pulse sequences) of 4 plantlets for both healthy and inoculated plants at all time points (week 0, 1 and 2). The normalized distance is illustrated in Fig. 1B and indicates the percentage from the crown-stolon junction. The circled asterisks above the profiles indicate highly statistically significant difference (p < 0.01) and asterisks statistically significant difference (p < 0.05).
Figure 7
Figure 7
Example of proton density maps. Normalized average proton density S0 maps of healthy and inoculated strawberry crowns during the two-week development period after inoculation. Average proton densities were calculated from S0 maps obtained together with T1 and T2 relaxation time maps. Differences in the visibility of the stolon and root structures between time points are due to slightly different MR image slice positions. The representative examples here are #4 from healthy and #1 from inoculated plantlets presented in Supplementary Fig. S1 online. Values are presented in arbitrary units (a.u.) and the values from surrounding water have been omitted (black).
Figure 8
Figure 8
Development of an inoculated plantlet. External symptoms of the Phytophthora cactorum progression in a strawberry plantlet (#1) at the three time points (week 0, 1 and 2) together with 3-D pseudo-color volume renderings from T2 relaxation time maps calculated from MGE data. Air bubbles are visible on the surface of the volume rendered plantlet. T2 relaxation times from the surrounding water have been omitted. A rotating example video of dissected healthy and inoculated plantlets at different timepoints can be found in the online supplementary material (Supplementary Video S1 online). Color is used to illustrate the T2 relaxation time values for different regions from relatively low relaxation time values (blue) to relatively high relaxation time values (red), and relaxation time values in-between (cyan, green, yellow and orange).

Similar articles

References

    1. FAO. Crops and livestock products. License: CC BY-NC-SA 3.0 IGO. Date Accessed: 2023-01-13. Food and Agriculture Organization of the United Nations https://www.fao.org/faostat/en/#data/QCL (2020).
    1. Thines M. Phylogeny and evolution of plant pathogenic oomycetes-a global overview. Eur. J. Plant Pathol. 2014;138:431–447. doi: 10.1007/s10658-013-0366-5. - DOI
    1. Maas JL. Compendium of Strawberry Diseases. APS Press; 1998. pp. 1–98.
    1. Erwin DC, Ribeiro OK. Phytophthora Diseases Worldwide. American Phytopathological Society; 1996. pp. 1–592.
    1. White PR. Studies of the physiological anatomy of the strawberry. J. Agric. Res. 1927;35:481–492.