. 2024 Mar;5(3):448-462.
doi: 10.1038/s43018-023-00712-x. Epub 2024 Jan 24.

The efficacy of chemotherapy is limited by intratumoral senescent cells expressing PD-L2

Affiliations

The efficacy of chemotherapy is limited by intratumoral senescent cells expressing PD-L2

Selim Chaib et al. Nat Cancer. 2024 Mar.

Abstract

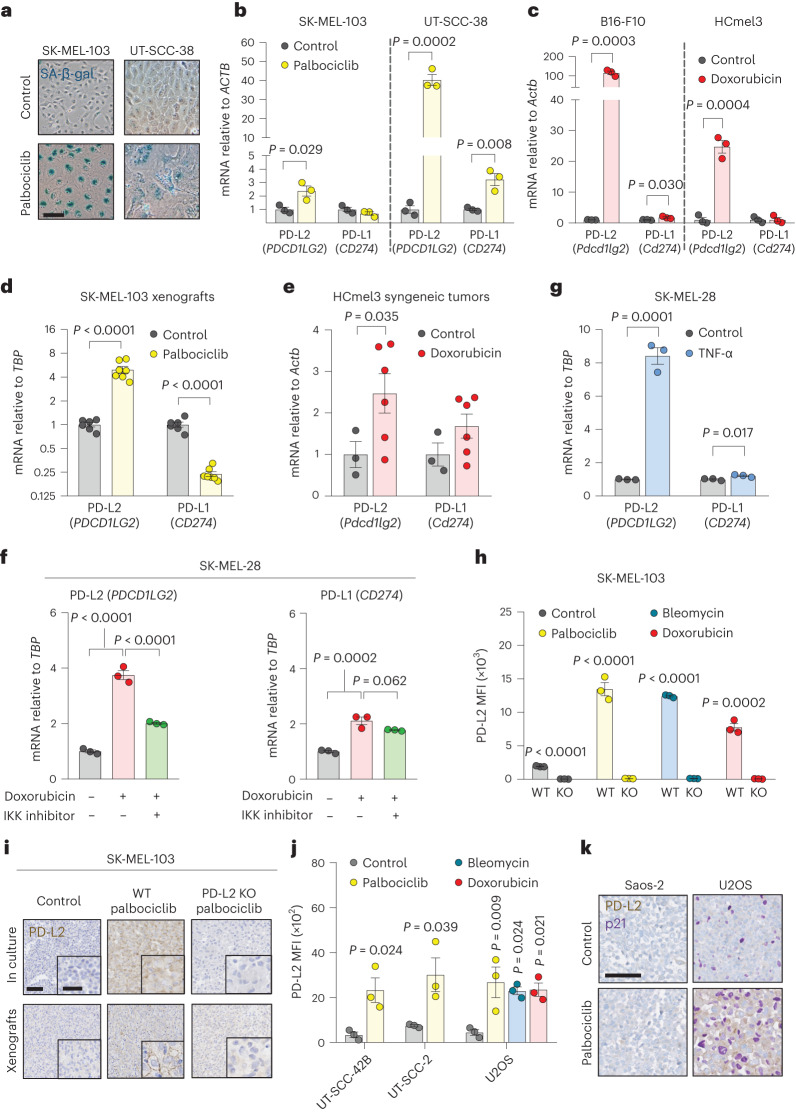
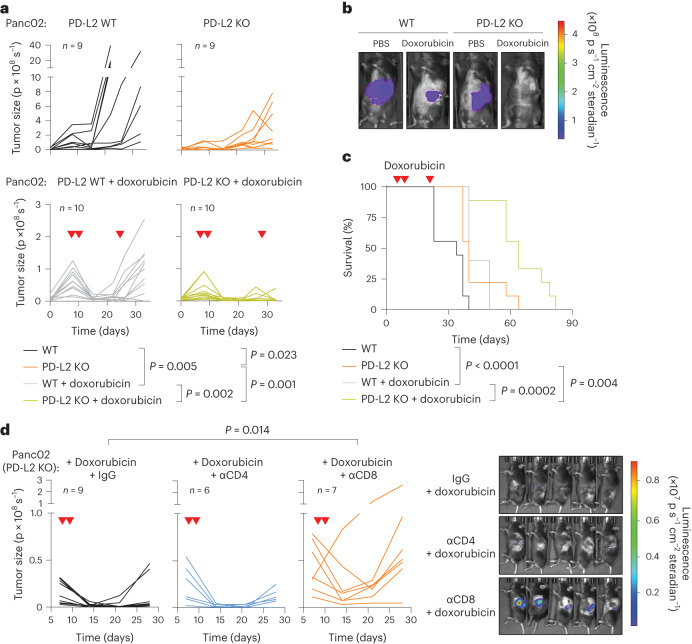
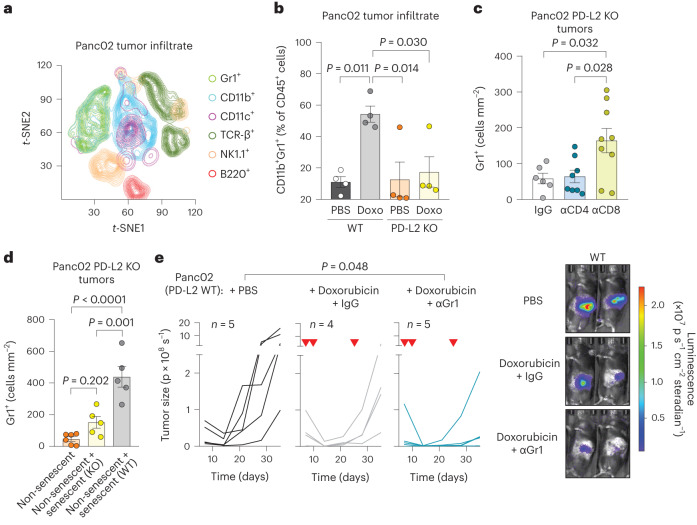
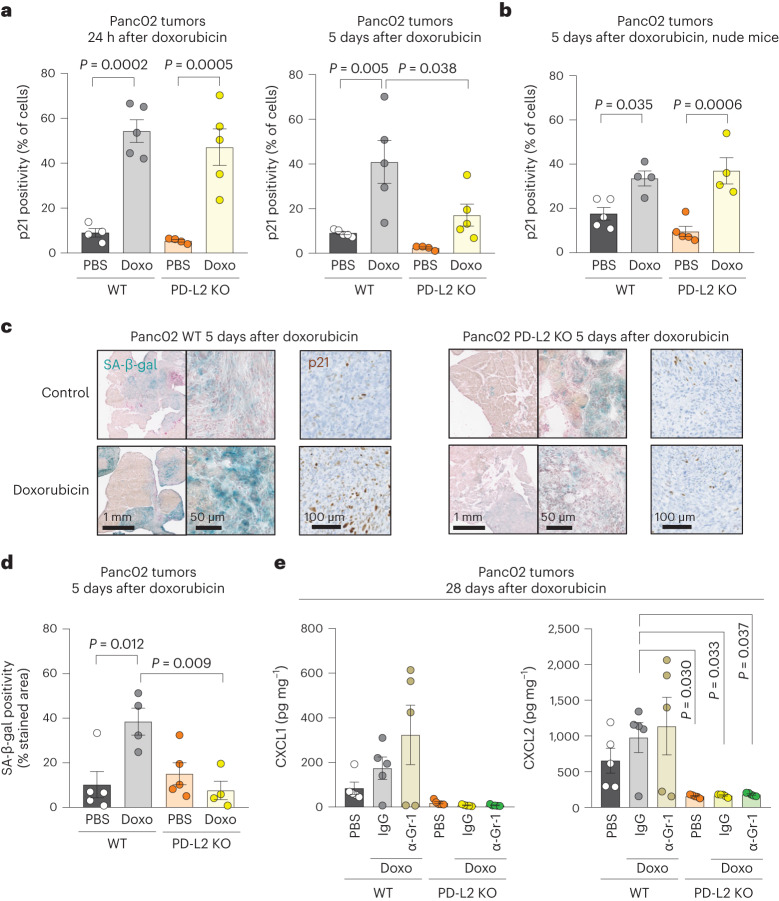
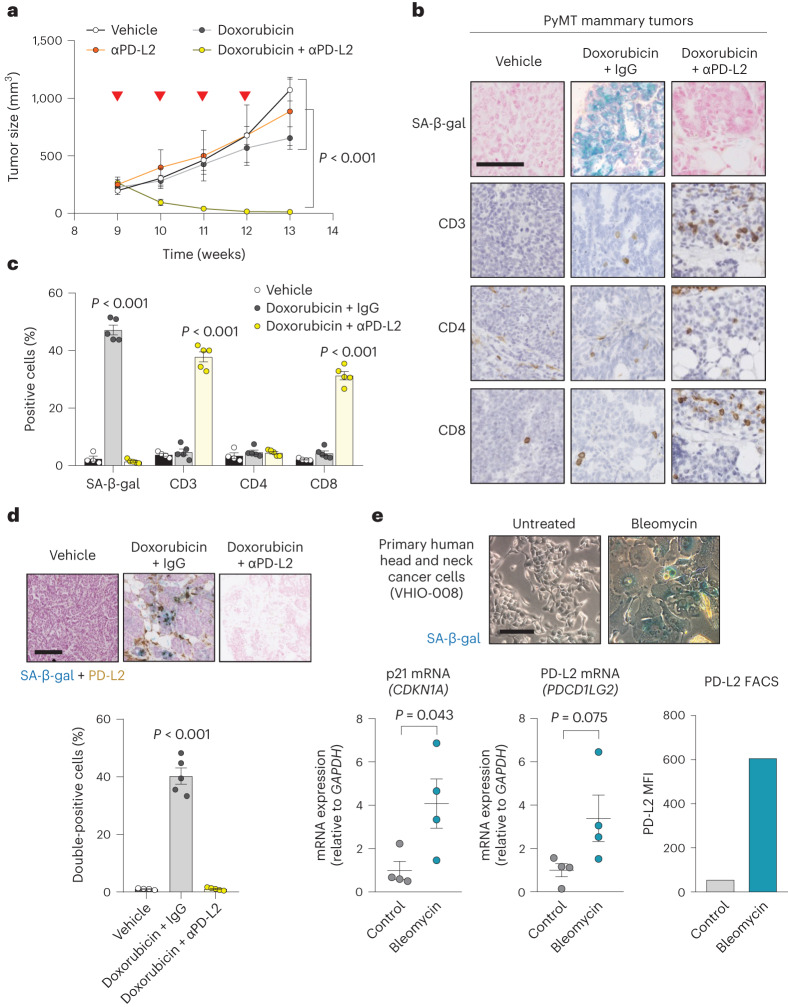
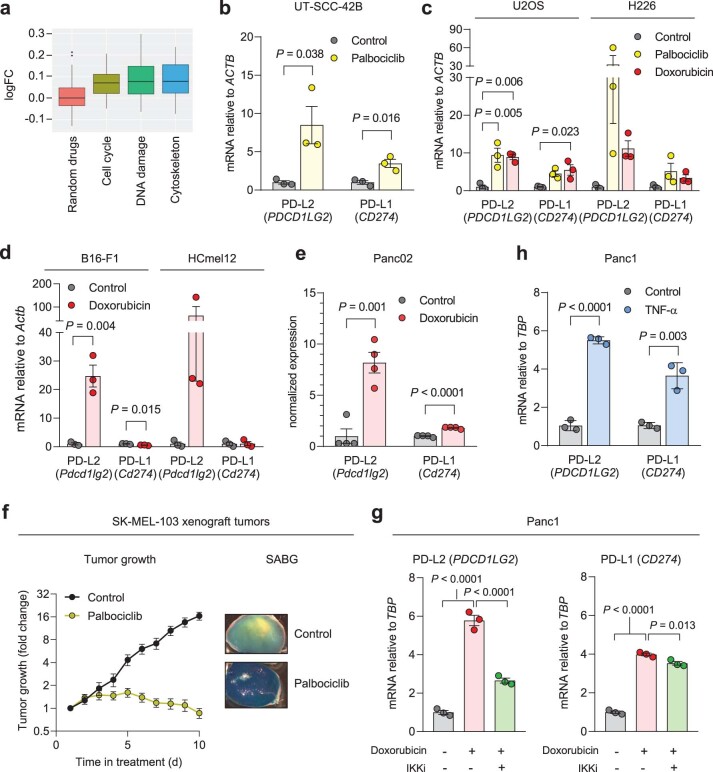
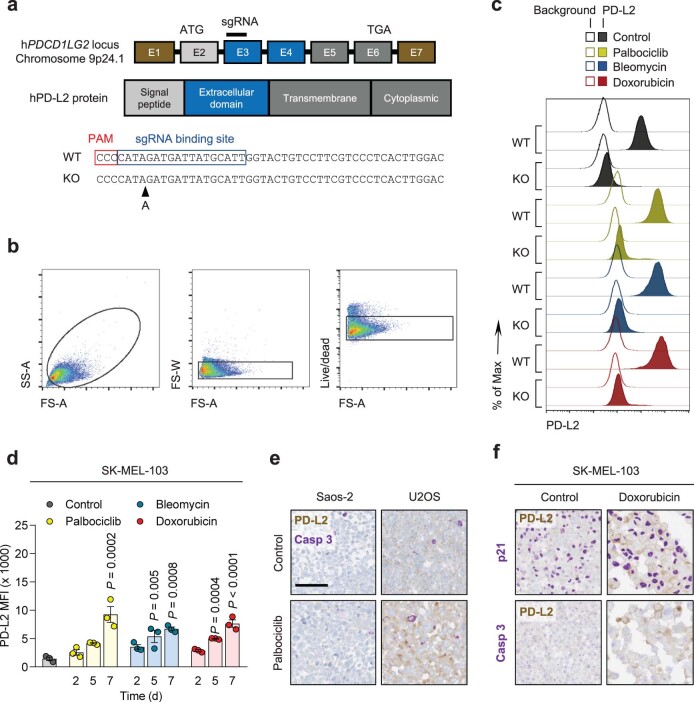
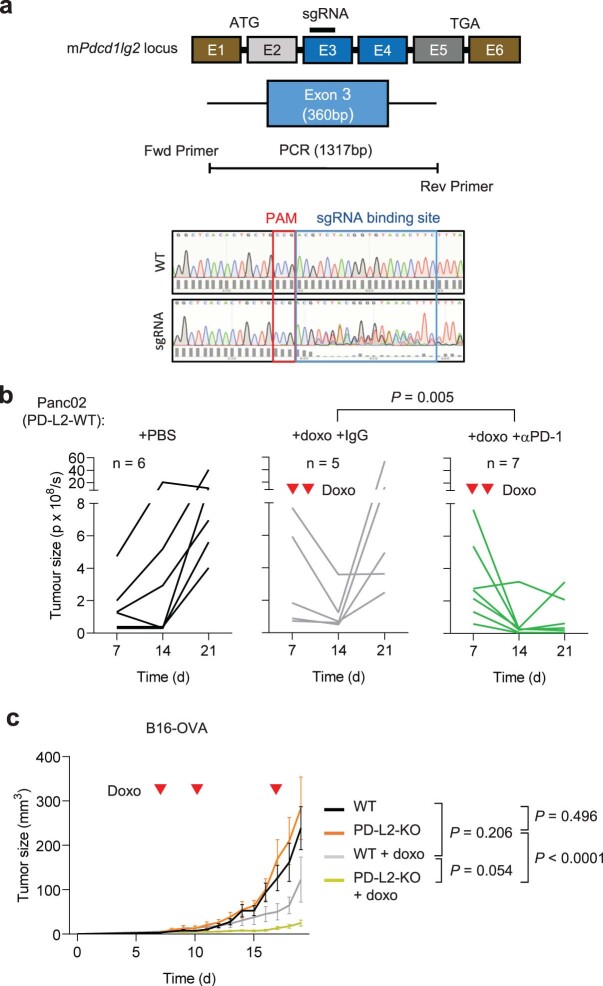
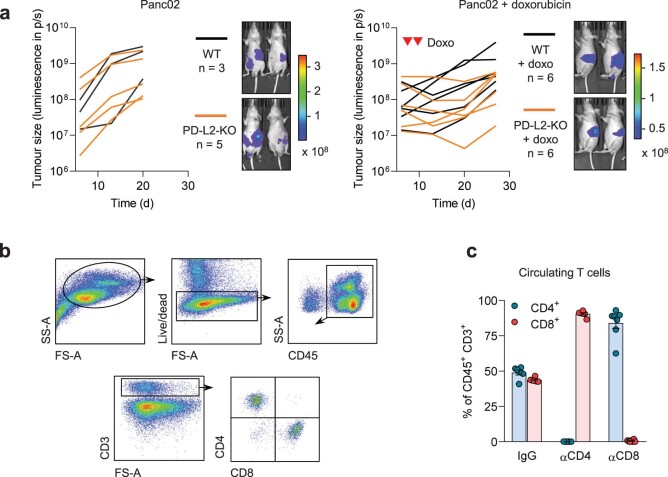
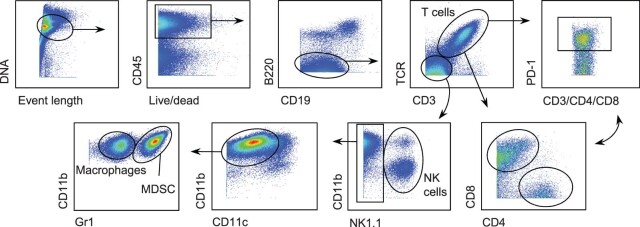
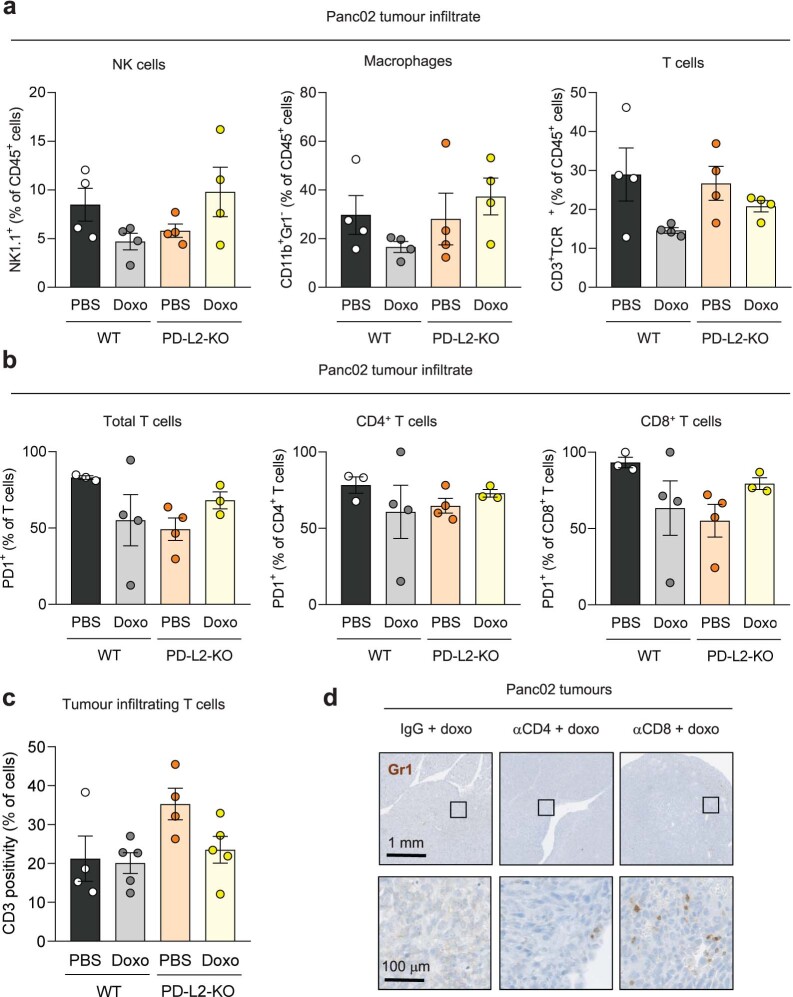
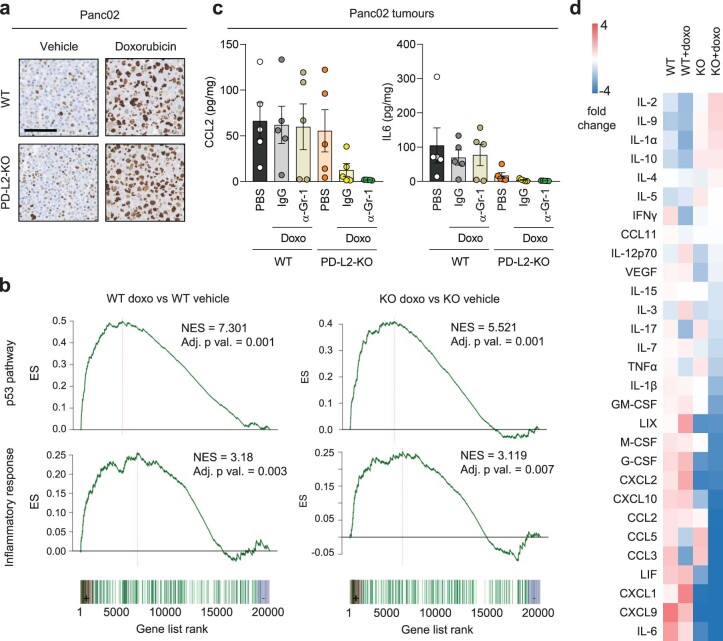
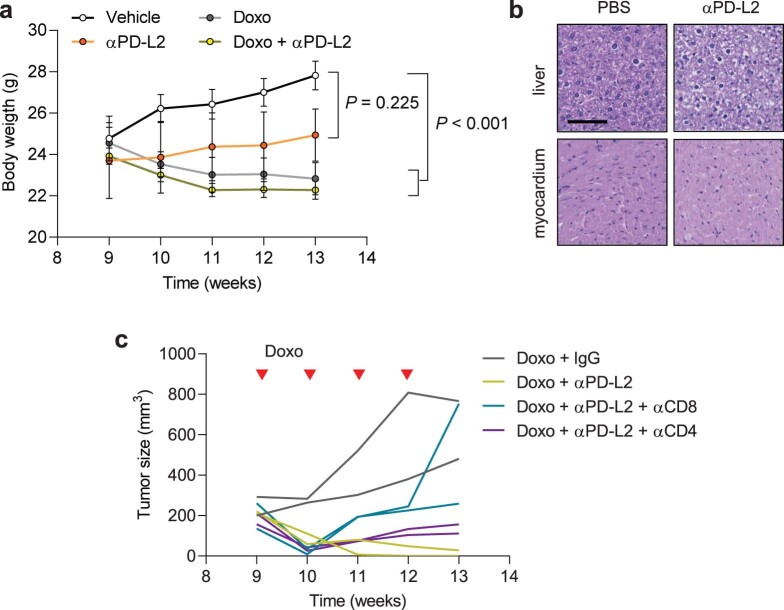
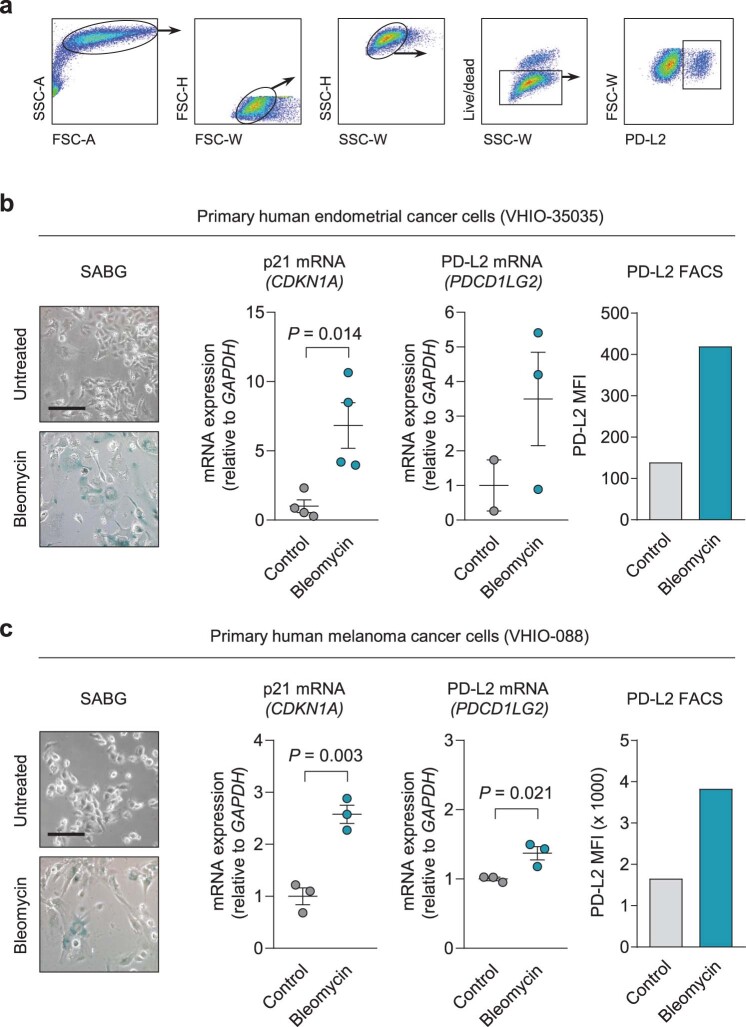
Chemotherapy often generates intratumoral senescent cancer cells that strongly modify the tumor microenvironment, favoring immunosuppression and tumor growth. We discovered, through an unbiased proteomics screen, that the immune checkpoint inhibitor programmed cell death 1 ligand 2 (PD-L2) is highly upregulated upon induction of senescence in different types of cancer cells. PD-L2 is not required for cells to undergo senescence, but it is critical for senescent cells to evade the immune system and persist intratumorally. Indeed, after chemotherapy, PD-L2-deficient senescent cancer cells are rapidly eliminated and tumors do not produce the senescence-associated chemokines CXCL1 and CXCL2. Accordingly, PD-L2-deficient pancreatic tumors fail to recruit myeloid-derived suppressor cells and undergo regression driven by CD8 T cells after chemotherapy. Finally, antibody-mediated blockade of PD-L2 strongly synergizes with chemotherapy causing remission of mammary tumors in mice. The combination of chemotherapy with anti-PD-L2 provides a therapeutic strategy that exploits vulnerabilities arising from therapy-induced senescence.


Conflict of interest statement

M.S. is a shareholder of Senolytic Therapeutics, Life Biosciences, Rejuveron Senescence Therapeutics and Altos Labs. S.C. has received royalties from Rejuveron Senescence Therapeutics. T.P.C. is a shareholder of Rejuveron Senescence Therapeutics. A.G. performs consulting work for Rejuveron Senescence Therapeutics. T.T. and J.L.K. have a financial interest related to this research including patents and pending patents covering senolytic drugs and their uses, which are held by the Mayo Clinic. This research has been reviewed by the Mayo Clinic Conflict of Interest Review Board and was conducted in compliance with the Mayo Clinic conflict of interest policies. The other authors declare no competing interests. The funders had no role in study design, data collection and analysis, decision to publish or paper preparation.

Figures

Fig. 1
Fig. 1. PD-L2 is upregulated in human and murine cancer cell lines on induction of cellular senescence.
a,b, Representative images of SA-β-gal staining (a, scale bar, 50 μm) and PD-L1 and PD-L2 mRNA expression in human cancer cell lines treated with palbociclib (b, n = 3 experiments). c, PD-L1 and PD-L2 mRNA expression in murine cancer cell lines after treatment with doxorubicin (n = 3 experiments). d, PD-L1 and PD-L2 mRNA expression in SK-MEL-103 xenograft tumors in nude mice, treated with 100 mg kg−1 oral palbociclib for 10 days and euthanized after the treatment. Control (n = 6 tumors); palbociclib-treated tumors (n = 7). e, PD-L1 and PD-L2 mRNA expression in HCmel3 tumors in C57BL/6 mice treated with 5 mg kg−1 doxorubicin (days 7, 10 and 17), analyzed after day 19. Control (n = 3 tumors); doxorubicin-treated tumors (n = 6). f, PD-L1 and PD-L2 mRNA expression in SK-MEL-28 cells treated with doxorubicin and then with the IKK inhibitor BAY 11-7082 (3 μM, 24 h, n = 3 experiments). g, PD-L1 and PD-L2 mRNA expression in SK-MEL-28 cells treated with TNF-α (100 ng ml−1, 3 days, n = 3 experiments). h, Quantification of PD-L2 protein levels using flow cytometry on the generation of a PD-L2 KO SK-MEL-103 cell line, under control and senescent conditions (n = 3 experiments). i, PD-L2 staining of WT and PD-L2 KO SK-MEL-103 cells in culture (as cell pellets) and as xenograft tumors, untreated and treated with palbociclib. Scale bar, 100 μm. Insets: high-magnification images. Scale bar, 50 μm. Representative images of n = 3 experiments. j, PD-L2 protein levels measured using flow cytometry after induction of senescence with palbociclib, bleomycin or doxorubicin in different cancer cell lines on day 7 after induction. MFI, mean fluorescence intensity (n = 3 experiments). Data are presented as the mean ± s.e.m. Two-sided t-tests or a one-way analysis of variance (ANOVA) with Tukey post-hoc test were used. k, Representative images of cell pellets stained for p21 and PD-L2 in Saos-2 and U2OS. Double staining was performed once. Scale bar, 100 μm. For all the experiments in culture, senescence was induced with 200 nM doxorubicin for 48 h, 5 µM palbociclib for 7 days or 12 mU bleomycin for 48 h. Senescence was evaluated at day 7. Source data
Fig. 2
Fig. 2. A combination of PD-L2 ablation and chemotherapy results in CD8 T cell-dependent tumor remission.
a, Quantification of tumor growth for PD-L2 WT and KO Panc02 orthotopic tumors, untreated or treated with doxorubicin (4 mg kg−1) at days 7, 10 and 24. b, Representative images. PBS-injected groups (n = 9 mice); doxorubicin-treated groups (n = 10). c, Survival curve for the mice from a. d, Quantification and representative images of tumor growth for PD-L2 KO Panc02 tumors after doxorubicin treatment (4 mg kg−1, days 7 and 10) and repeated injections with IgG isotype control, anti-CD4 or anti-CD8 blocking antibodies (100 μg per injection) from day 3 after tumor cell injection and repeated every 3 days. Inverted red triangles indicate day of doxorubicin treatment. Luminescence units are photons (p) s−1 in the graphs and p s cm2 steradian in the images. A two-way ANOVA and one-way ANOVA with Tukey post-hoc test were used. Source data
Fig. 3
Fig. 3. Recruitment of tumor-promoting myeloid cells is prevented in PD-L2 KO after doxorubicin treatment.
a, t-distributed stochastic neighbor embedding (t-SNE) plot including the different tumor-infiltrating immune subpopulations detected using mass cytometry. The plot shows the pooled data for a total of 16 mice corresponding to four experimental groups (n = 4 mice for WT and PD-L2 KO, untreated or treated with doxorubicin). Doxorubicin (4 mg kg−1) treatment was administered on days 7 and 10, and samples were obtained on day 12. b, Quantification of the percentage of CD11b+Gr1+ cells, relative to total CD45+ cells, measured using mass cytometry. n = 4 tumors for each experimental group. Doxo, doxorubicin. c, Quantification of Gr1+ cells in sections of PD-L2 KO tumors treated with doxorubicin on days 7 and 10, subject to depletion of CD4+ (n = 8 mice) or CD8+ (n = 9) T cells (100 μg per injection, every 3 days from day 3) or the same dose of IgG (n = 6) isotype control, and collected on day 28. d, Quantification of Gr1+ cells in sections of tumors generated by the coinjection of non-senescent (n = 6 mice) PD-L2 KO Panc02 cells in combination with senescent Panc02 cells, either WT (n = 5) or PD-L2 KO (n = 5), evaluated 6 days after tumor cell injection. e, Representative quantification and images of tumor growth for PD-L2 WT tumors, untreated or treated with doxorubicin (4 mg kg−1) on days 7, 10 and 24, including an additional group treated with anti-Gr1 blocking antibody (200 μg per injection, started on day 3 and continued twice weekly) or the same dose of IgG isotype control (n = 4,5 mice per group). Inverted red triangles indicate day of doxorubicin treatment. Luminescence units are p s−1 in the graphs and p s cm2steradian in the images. Data are presented as mean ± s.e.m. A one-way ANOVA with Tukey post-hoc test was used. Source data
Fig. 4
Fig. 4. PD-L2 KO Panc02 tumors after chemotherapy present lower levels of cellular senescence markers and intratumoral cytokines and chemokines.
a, Quantification of p21+ cells using IHC in PD-L2 WT and KO Panc02 tumors treated with one dose of doxorubicin (4 mg kg−1) on day 7 and analyzed 24 h after (left), or treated twice with the same dose of doxorubicin at days 7 and 10, and analyzed at day 12 (that is, 5 days after the first dose of doxorubicin). PBS-injected groups (n = 4 mice); doxorubicin-treated group for the 24 h experiment (n = 5 mice); all groups at 5 days (n = 5 mice) except for PD-L2 KO + PBS (n = 4). b, Same experimental design as in a (right) in nude mice. Doxorubicin-treated groups (n = 4 mice), PBS-injected group (n = 5 mice). c, Representative staining of p21 and SA-β-gal in Panc02 tumors corresponding to the experiment in a. d, Quantification of the SA-β-gal of c. Doxorubicin-treated groups (n = 4 mice); PBS-injected group (n = 5 mice). e, Intratumoral levels of CXCL1 and CXCL2 in PD-L2 WT and KO tumors, treated with doxorubicin as in a. Treatment with anti-Gr1 (200 μg per injection) or the same dose of IgG isotype control was started on day 3 and continued twice a week, as described for Fig. 3e. Mice per experimental group in all assays (n = 5). Data are presented as the mean ± s.e.m. A one-way ANOVA with Tukey post-hoc test was used. Source data
Fig. 5
Fig. 5. Combining chemotherapy and PD-L2 blockade holds translational potential.
a, Tumor growth in PyMT mice treated weekly (from week 9 until week 12) with αPD-L2 alone (TY25, 10 mg kg−1) or the same dose of isotype control every 3 days, doxorubicin alone or a combination of both as indicated. αPD-L2 monotherapy (n = 3 mice); PBS and doxorubicin + IgG groups (n = 4); doxorubicin + αPD-L2 (n = 5). Two-way ANOVA. Inverted red triangles indicate day of doxorubicin treatment. b,c, SA-β-gal, CD3, CD4 and CD8 staining of untreated tumors and tumors treated with doxorubicin alone or in combination with αPD-L2 blocking antibody (TY25, 10 mg kg−1) or the same dose of isotype control (b), as in a, and analyzed at week 13 (c). Vehicle-treated group (n = 4); doxorubicin-treated groups (n = 5). Representative images are shown. Statistical significance shown versus the rest of the experimental conditions. One-way ANOVA with Tukey post-hoc test. Scale bar, 100 μm. d, SA-β-gal and PD-L2 costaining in tumor samples from PyMT mice treated weekly with doxorubicin (4 mg kg−1) at postnatal weeks 9–12. The indicated groups were treated with αPD-L2 (TY25, 10 mg kg−1), or the same dose of IgG isotype control, every 3 days. Representative images and quantification are shown. Samples were obtained at postnatal week 13 (that is, 7 days after the last doxorubicin dose). Vehicle-treated group (n = 4 mice); doxorubicin-treated groups (n = 5 mice). A one-way ANOVA was used for significant changes versus the rest of the conditions. Scale bar, 100 μm. e, SA-β-gal staining, p21 mRNA levels, PD-L2 mRNA levels and PD-L2 protein levels measured using fluorescence-activated cell sorting (FACS), with and without bleomycin treatment, in human head and neck cancer primary culture from patient VHIO-008. Gene expression (n = 4 independent replicates); FACS (n = 1). Scale bar, 50 μm. Two-sided t-tests were used. Source data
Extended Data Fig. 1
Extended Data Fig. 1. PD-L2 is upregulated in human and murine senescent cancer cells.
(a) Drug class enrichment analysis for human PDCD1LG2 (PD-L2). P = 0.0013 for cell cycle, P = 8.3 · 10-06 for DNA damage, P = 0.0003 for cytoskeleton. (b) PD-L1/2 mRNA expression in human cancer cell lines treated with palbociclib. (c) PD-L1/2 mRNA expression in human cancer cell lines after treatment with doxorubicin or palbociclib. (d) PD-L1/2 mRNA expression in murine cancer cell lines treated with doxorubicin. N = 3 experiments for (b-d). (e) Normalized PD-L1/2 mRNA expression measured by RNA sequencing. N = 4 biological replicates. (f) Growth curve and representative whole mount beta-galactosidase stainings of SK-MEL-103 xenografts in nude mice, untreated or treated with 100 mg/kg oral palbociclib, daily, once tumors reached 150 mm3 (day 7-10). (g) PD-L1/2 mRNA expression in SK-MEL-103 cells treated with doxorubicin and the IKK inhibitor BAY 11-7082 (3 µM, 24 h). N = 11 control mice and 14 palbociclib-treated mice. (h) PD-L1/2 mRNA expression in SK-MEL-103 cells treated with TNF-α (100 ng/ml, 3 days). N = 3 experiments for (g-h). Data are presented as mean ± SEM. Two-sided t-tests or 1 way ANOVA with Tukey post-test were applied. For all the experiments in culture, senescence was induced with 200 nM doxorubicin for 48 h, 5 µM palbociclib for 7 days or 12 mU bleomycin for 48 h. Senescence was evaluated at day 7. Source data
Extended Data Fig. 2
Extended Data Fig. 2. PD-L2 protein levels are upregulated in human and murine senescent cells.
(a) CRISPR-Cas9 genome editing of the human PDCD1LG2 locus, specifying the sgRNA binding site in exon 3. The sequence corresponds to the single clone of edited SK-MEL-103 cells used in the experiments labelled as PD-L2-KO SK-MEL-103. (b) Gating strategy for definition of PD-L2 positive populations in culture and (c) representative example (1 out of n = 3) of histogram for PD-L2 protein levels upon generation of a PD-L2-KO SK-MEL-103 cell line, in control and senescent conditions, measured by flow cytometry. The gating strategy in (b) applies to Figs. 1h, 1j and panel (d) in the present figure. (d) PD-L2 protein levels as measured by flow cytometry upon induction of senescence with palbociclib, bleomycin and doxorubicin in SK-MEL-103 cells. N = 3 independent experiments. Data are presented as mean ± SEM. 1-way ANOVA was applied. (e) Double staining of PD-L2 and active caspase-3 in Saos-2 and U2OS cell pellets, after treatment with palbociclib. (f) Double staining of PD-L2 and p21 (above) and PD-L2 and caspase-3 (below) in SK-MEL-103 cell pellets, after treatment with doxorubicin. Double stainings in (e) and (f) were performed once. Scale bars = 100 μm. For all the experiments in culture, senescence was induced with 200 nM doxorubicin for 48 h, 5 μM palbociclib for 7 days (unless otherwise indicated) or 12 mU bleomycin for 48 h. Senescence was evaluated at day 7 unless otherwise indicated. Source data
Extended Data Fig. 3
Extended Data Fig. 3. A combination of PD-L2 ablation and chemotherapy results in tumor remission.
(a) CRISPR-Cas9 genome editing of the murine Pdcd1lg2 locus, specifying the sgRNA binding site in exon 3, that generated a bulk population of edited Panc02 cells. This bulk population was used in all the experiments labelled as PD-L2-KO Panc02. (b) Quantification of tumor growth for PD-L2-WT tumors, untreated or treated with doxorubicin on days 7 and 10, including an additional group treated with anti-PD-1 depleting antibody (200 µg), or the same dose of IgG isotype control, from day 3 after tumor cell injection, twice a week. N = 6 for PBS-injected mice, n = 5 for doxo-treated, n = 7 for doxo + anti-PD-1. (c) Growth curve of WT and bulk PD-L2-KO B16-OVA tumors in C57BL/6 mice, untreated or treated with doxorubicin on days 7, 10 and 17 after subcutaneous injection of cells. B16-OVA-WT n = 5 tumors, B16-OVA-KO n = 6, B16-OVA-WT + doxo n = 11, B16-OVA-KO + doxo n = 11. 2-way ANOVA. Source data
Extended Data Fig. 4
Extended Data Fig. 4. A functional adaptive immune system is required for clearance of PD-L2-KO tumors.
(a) Quantification and representative images of Panc02 WT and PD-L2-KO tumors in nude mice, untreated and treated with doxorubicin on days 7 and 10. Luminescence units are photon/sec/cm2/stereoradian in the images. N = 3 for PD-L2-WT + PBS mice, n = 5 for PD-L2-KO + PBS, n = 6 for both doxo-treated groups. (b) Gating strategy to define circulating CD4+ and CD8+ T cell populations. (c) Percentage of CD4+ and CD8+ T cells among total CD45+ CD3+ cells in blood of mice after treatment with blocking anti-CD4 and anti-CD8 antibodies. N = 6-7 mice. Data are presented as mean ± SEM. Source data
Extended Data Fig. 5
Extended Data Fig. 5. Gating strategy for definition of immune cell populations by mass cytometry.
Definition of T cells (including CD4+, CD8+ and, in each case, PD-1+ cells), macrophages, NK cells and myeloid-derived suppressor cells shown in Fig. 3a-b and Extended Data Fig. 6a-b.
Extended Data Fig. 6
Extended Data Fig. 6. Recruitment of tumor-promoting myeloid cells is prevented in PD-L2-KO tumors upon doxorubicin treatment.
(a) Percentage of NK cells (NK1.1+), macrophages (CD11b+ Gr1-) and lymphocytes (CD3+ TCRb+) relative to total CD45+ cells, in WT and PD-L2-KO tumors untreated or treated with doxorubicin at days 7 and 10, analysed by mass cytometry. N = 4 mice for all conditions. (b) Percentage of PD-1+ cells among subsets of infiltrating T cells, analysed by mass cytometry. N = 3 mice for WT + PBS and PD-L2-KO + doxo, n = 4 for WT + doxo and PD-L2-KO + PBS (c) Quantification of tumor infiltrating CD3+ lymphocytes in WT and PD-L2-KO tumors, untreated or treated with doxorubicin, analysed by immunohistochemistry. N = 4 for PBS-treated groups and n = 5 for doxo-treated groups. None of the changes were significant (1 way ANOVA, Tukey post-test). Data are presented as mean ± SEM. (d) Representative Gr1 stainings in sections of PD-L2-KO tumors treated with doxorubicin and subject to depletion of CD4+ (n = 8) or CD8+ (n = 9) T cells, as well as IgG-treated controls (n = 6) from Fig. 3c. Source data
Extended Data Fig. 7
Extended Data Fig. 7. Characterization of senescent cells in culture and in vivo.
(a) p21 staining in pellets from Panc02 cells, WT and PD-L2-KO, untreated or treated with doxorubicin (200 nM, 48 h, evaluated at day 7, n = 4 experiments). Scale bar = 100 μm. (b) GSEA plots for representative gene sets associated to cellular senescence in doxorubicin-treated versus untreated WT Panc02 cells, as well as in doxorubicin-treated (as described) versus untreated PD-L2-KO Panc02 cells at day 7 after treatment. DESEq2 was used for differential expression analysis with fold change shrinkage as implemented in the lfcShrink function. Functional enrichment analysis was performed over gene sets defined in the Molecular Signatures Database (MSigDB) hallmark gene set collection. Data from 4 biological replicates. (c) Absolute quantifications of intratumoral levels of CCL2 and interleukin 6 measured by a commercial multiplexed system with beads bound to antibodies, in WT and PD-L2-KO tumors, untreated or treated with doxorubicin (4 mg/kg, days 7, 10 and 24) and anti-Gr1 (200 µg per injection, as described for Fig. 3e), or the same dose of IgG isotype control. N = 5 mice per experimental condition. 1 way ANOVAs with Tukey post-tests were applied. (d) Relative levels of intratumoral cytokines and chemokines in WT and PD-L2-KO tumors, untreated or treated with doxorubicin (4 mg/kg, on days 7, 10 and 24, as described). N = 5 mice per experimental condition. Source data
Extended Data Fig. 8
Extended Data Fig. 8. PD-L2 blockade eliminates mammary tumors after chemotherapy.
(a) Body weight of PyMT mice during doxorubicin and anti-PD-L2 treatments, corresponding to Fig. 5a. 2-way ANOVA. N = 3 mice for anti-PD-L2 monotherapy, n = 4 for PBS and doxo + IgG groups, n = 5 for doxo + anti-PD-L2. (b) Representative hematoxilin/eosin staining of liver and myocardium of animals treated with anti-PD-L2 (10 mg/kg) (n = 2 mice) or vehicle (PBS, n = 1) every three days for four weeks. Scale bar = 100 μm. (c) Individual replicates (n = 2 mice) of tumor growth curves in PyMT mice treated with doxorubicin and anti-PD-L2, together with blocking antibodies against CD4 (10 mg/kg) and CD8 (10 mg/kg), or the same dose of IgG isotype control, every three days for four weeks. Source data
Extended Data Fig. 9
Extended Data Fig. 9. PD-L2 expression and protein levels increase in primary cultures from human patients upon establishment of cellular senescence.
(a) Gating strategy for detection of PD-L2+ cells in Fig. 5e and in the following panels. (b-c) SABG staining, p21 mRNA levels, PD-L2 mRNA levels, and PD-L2 protein levels measured by FACS with and without bleomycin treatment in (b) human endometrial cancer primary culture from patient VHIO-35035 and (c) human melanoma primary culture from patient VHIO-088. N = 4 independent experiments for gene expression, n = 1 for FACS. Data are presented as mean ± SEM. Two-sided t-tests were applied. Scale bars = 50 μm. Source data

References

    1. Topalian SL, et al. Safety, activity, and immune correlates of anti-PD-1 antibody in cancer. N. Engl. J. Med. 2012;366:2443–2454. doi: 10.1056/NEJMoa1200690. - DOI - PMC - PubMed
    1. Cha J-H, Chan L-C, Li C-W, Hsu JL, Hung MC. Mechanisms controlling PD-L1 expression in cancer. Mol. Cell. 2019;76:359–370. doi: 10.1016/j.molcel.2019.09.030. - DOI - PMC - PubMed
    1. Chen L, Han X. Anti-PD-1/PD-L1 therapy of human cancer: past, present, and future. J. Clin. Invest. 2015;125:3384–3391. doi: 10.1172/JCI80011. - DOI - PMC - PubMed
    1. Ghosh C, Luong G, Sun Y. A snapshot of the PD-1/PD-L1 pathway. J. Cancer. 2021;12:2735–2746. doi: 10.7150/jca.57334. - DOI - PMC - PubMed
    1. Ribas A, Wolchok JD. Cancer immunotherapy using checkpoint blockade. Science. 2018;359:1350–1355. doi: 10.1126/science.aar4060. - DOI - PMC - PubMed

Publication types