. 2024 Mar;21(3):275-291.
doi: 10.1038/s41423-024-01131-3. Epub 2024 Jan 24.

Disulfiram ameliorates STING/MITA-dependent inflammation and autoimmunity by targeting RNF115

Affiliations

Disulfiram ameliorates STING/MITA-dependent inflammation and autoimmunity by targeting RNF115

Zhi-Dong Zhang et al. Cell Mol Immunol. 2024 Mar.

Abstract

STING (also known as MITA) is an adaptor protein that mediates cytoplasmic DNA-triggered signaling, and aberrant activation of STING/MITA by cytosolic self-DNA or gain-of-function mutations causes severe inflammation. Here, we show that STING-mediated inflammation and autoimmunity are promoted by RNF115 and alleviated by the RNF115 inhibitor disulfiram (DSF). Knockout of RNF115 or treatment with DSF significantly inhibit systemic inflammation and autoimmune lethality and restore immune cell development in Trex1-/- mice and STINGN153S/WT bone marrow chimeric mice. In addition, knockdown or pharmacological inhibition of RNF115 substantially downregulate the expression of IFN-α, IFN-γ and proinflammatory cytokines in PBMCs from patients with systemic lupus erythematosus (SLE) who exhibit high concentrations of dsDNA in peripheral blood. Mechanistically, knockout or inhibition of RNF115 impair the oligomerization and Golgi localization of STING in various types of cells transfected with cGAMP and in organs and cells from Trex1-/- mice. Interestingly, knockout of RNF115 inhibits the activation and Golgi localization of STINGN153S as well as the expression of proinflammatory cytokines in myeloid cells but not in endothelial cells or fibroblasts. Taken together, these findings highlight the RNF115-mediated cell type-specific regulation of STING and STINGN153S and provide potential targeted intervention strategies for STING-related autoimmune diseases.

Keywords: Autoimmunity; Disulfiram; RNF115; SLE; STING/MITA.


Conflict of interest statement

The authors declare no competing interests.

Figures
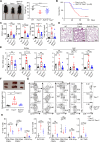
Fig. 1
Fig. 1
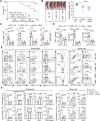
Deletion of RNF115 attenuates the autoimmune phenotypes of Trex1–/– mice. A Representative images (left) and body weights (right) of 5-week-old wild-type (WT) (n = 16), Trex1–/– (n = 19), and Rnf115–/–Trex1–/– (n = 45) mice. B Survival (Kaplan–Meier curves) of Trex1–/– (n = 72) and Rnf115–/–Trex1–/– (n = 49) mice. C ELISA of CXCL1, TNF-α, CCL5 and total IgG in the sera of 6-week-old WT (n = 6), Trex1–/– (n = 8) and Rnf115–/–Trex1–/– (n = 8) mice. D Representative images of H&E-stained lung sections from 6-week-old Trex1–/– (n = 3) and Rnf115–/–Trex1–/– (n = 3) mice. E qRT‒PCR analysis of Tnf, Cxcl9, and Cxcl10 mRNA in the kidneys and livers of 6-week-old WT (n = 6), Trex1–/– (n = 9) and Rnf115–/–Trex1–/– (n = 8) mice. F Representative images (upper) of spleens and spleen weight/body weight ratios (lower) of 6-week-old WT (n = 9), Trex1–/– (n = 15) and Rnf115–/–Trex1–/– (n = 10) mice. G, H Flow cytometric analysis of splenocytes from 6-week-old WT (n = 10), Trex1–/– (n = 6), and Rnf115–/–Trex1–/– (n = 11) mice stained with fluorophore-conjugated antibodies against the indicated surface or intracellular molecules. *P < 0.05, **P < 0.01, ***P < 0.001, ****P < 0.0001; ns, not significant (one-way ANOVA or the log-rank test). The graphs show the means ± SDs (A, C, E, F, H). The scale bars represent 200 μm (D). The data are representative of three independent experiments (CH)
Fig. 2
Fig. 2
Rnf115–/–STINGN153S/WT bone marrow chimeric mice exhibit attenuated autoimmunity. A Survival (Kaplan-Meier curves) of wild-type (WT) → WT (n = 8), STINGN153S/WT (NS) → WT (n = 20), and Rnf115–/–STINGN153S/WT (115NS) → WT (n = 16) bone marrow chimeric mice. B Representative images of spleens (left) and the spleen weight/body weight ratios (right) of WT → WT (n = 5), NS → WT (n = 5), and 115NS → WT (n = 5) chimeric mice at the 7th week after bone marrow cell transfer. C ELISA of G-CSF, CXCL10, and TNF-α in the sera of WT → WT (n = 5), NS → WT (n = 5), and 115NS → WT (n = 5) chimeric mice as described in (B). D qRT‒PCR analysis of Cxcl10 and Cxcl9 mRNA expression in blood cells from WT → WT (n = 5), NS → WT (n = 5), and 115NS → WT (n = 5) chimeric mice as described in (B). E, F Flow cytometric analysis of splenocytes from WT → WT (n = 5), NS → WT (n = 5), and 115NS → WT (n = 5) chimeric mice as described in (B) after staining with fluorophore-conjugated antibodies against the indicated surface or intracellular molecules. *P < 0.05, **P < 0.01, ***P < 0.001, ****P < 0.0001; ns, not significant (one-way ANOVA or the log-rank test). The graphs show the means ± SDs (BF). The data are combined from two independent experiments (A) or are representative of two independent experiments (BF)
Fig. 3
Fig. 3
RNF115 in hematopoietic cells contributes to autoimmunity in Rnf115–/–STINGN153S/WT mice. A Survival (Kaplan-Meier curves) of STINGN153S/WT (NS)→wild-type (WT) (n = 10), Rnf115-/-STINGN153S/WT (115NS) → WT (n = 10), and Rnf115-/-STINGN153S/WT (115NS)→Rnf115–/– (115KO) (n = 12) chimeric mice. B Representative images (left) of spleens and the spleen weight/body weight ratios (right) of NS → WT (n = 4), 115NS → WT (n = 6), and 115NS → 115KO (n = 6) chimeric mice at the 7th week after bone marrow cell transfer. C qRT‒PCR analysis of Cxcl10, Cxcl9, Tnf, and Il6 mRNA expression in blood cells from NS → WT (n = 4), 115NS → WT (n = 6), and 115NS → 115KO (n = 6) chimeric mice as described in (B). D ELISA of CXCL1, CCL5, and IL-6 in the sera of NS → WT (n = 4), 115NS → WT (n = 6), and 115NS → 115KO (n = 6) chimeric mice as described in (B). E, F Flow cytometric analysis of splenocytes and blood cells from NS → WT (n = 4), 115NS → WT (n = 6), and 115NS → 115KO (n = 6) chimeric mice as described in (B) after staining with fluorophore-conjugated antibodies against the indicated surface or intracellular molecules. *P < 0.05, **P < 0.01, ***P < 0.001, ****P < 0.0001; ns, not significant (one-way ANOVA or the log-rank test). The graphs show the means ± SDs (BD, F). The data are representative of two independent experiments (AF)
Fig. 4
Fig. 4
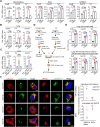
RNF115 specifically facilitates the Golgi localization of STINGN153S in myeloid cells. A qRT‒PCR analysis of Cxcl9, Cxcl10, and Tnf mRNA expression in bone marrow-derived dendritic cells and macrophages (GM-DCs/Macs), mouse lung fibroblasts (MLFs), and mouse pulmonary microvascular endothelial cells (MPMECs) from 6-week-old wild-type (WT) (n = 4), STINGN153S/WT (NS) (n = 4), and Rnf115–/–STINGN153S/WT (115NS) (n = 4) mice. B qRT‒PCR analysis of Cxcl9, Tnf, and Cxcl10 mRNA expression in lungs from 6-week-old WT (n = 4), NS (n = 4), and 115NS (n = 4) mice. C qRT‒PCR analysis of Cxcl10, Cxcl9, and Tnf mRNA expression in lungs from WT → WT (n = 5), NS → WT (n = 5), and 115NS → WT (n = 5) chimeric mice at the 7th week after bone marrow cell transfer. D Schematic diagram of the coculture assay of lung CD45- nonimmune cells from WT, NS, or 115NS mice with lung CD45+ immune cells from WT mice. E qRT‒PCR analysis of Cxcl10, Ccl5, and Tnf mRNA expression in lung CD45- nonimmune cells from WT (n = 4), NS (n = 4), and 115NS (n = 4) mice (upper graphs) and lung CD45+ immune cells from WT mice that were cocultured as described in (D) (lower graphs). F Immunofluorescence staining of Calnexin (an ER marker) (red), GM130 (a Golgi apparatus marker) (red), and FLAG (green) and confocal microscopy analysis of Rnf115+/+ and Rnf115–/– GM-DCs/Macs or MLFs reconstituted with STINGN153S-FLAG. Statistical analysis was based on two different colocalization images and was performed using ImageJ software. *P < 0.05, **P < 0.01, ***P < 0.001, ****P < 0.0001; ns, not significant (one-way ANOVA). The orange and white scale bars represent 5 μm and 10 μm, respectively (D). The graphs show the means ± SDs (AC, E). The data are representative of three (A, B) or two (C, E, F) independent experiments
Fig. 5
Fig. 5
RNF115 promotes the activation of wild-type STING and STINGN153S. Denaturing IP (IP with an anti-STING antibody and immunoblotting with an anti-K63-linked polyubiquitin antibody; upper two panels), immunoprecipitation (with an anti-STING antibody; middle two panels), immunoblot analysis (with an anti-STING, anti-RNF115, anti-TBK1, or anti-Tubulin antibody), and SDD-AGE analysis (with an anti-STING antibody; middle panels) of livers and kidneys (A), bone marrow-derived dendritic cells and macrophages (GM-DCs/Macs), and mouse lung fibroblasts (MLFs) (B) from 6-week-old WT, Trex1–/–, and Rnf115–/–Trex1–/– mice. C Immunoblot analysis (with an anti-pTBK1, anti-pSTING, anti-TBK1, anti-STING, anti-RNF115, or anti-Tubulin antibody) of livers from 6-week-old WT, Trex1–/–, and Rnf115–/–Trex1–/– mice (left panels) or from WT, Trex1–/–, and Rnf115–/–Trex1–/– GM-DCs/Macs (right panels). D Denaturing IP (IP with an anti-FLAG antibody and immunoblotting with an anti-K63-linked polyubiquitin antibody; upper two panels), SDD-AGE analysis (with an anti-FLAG antibody; middle panel), and immunoblot analysis (with an anti-FLAG, anti-RNF115, or anti-Tubulin antibody; bottom three panels) of Rnf115+/+ and Rnf115–/– MLFs and GM-DCs/Macs reconstituted with STINGN153S-FLAG. E Immunoprecipitation (with control IgG or an anti-FLAG antibody) and immunoblot analysis (with an anti-FLAG, anti-RNF115, or anti-Tubulin antibody) of MLFs and GM-DCs/Macs reconstituted with STINGN153S-FLAG. The data are representative of two independent experiments
Fig. 6
Fig. 6
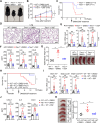
DSF attenuates the autoimmune phenotypes of Trex1-/- mice and NS → WT chimeric mice. A Representative images of 4-week-old wild-type C57BL/6 mice injected i.p. with DMSO (WT + DMSO), Trex1–/– mice injected i.p. with DMSO (Trex1–/– + DMSO), and Trex1–/– mice injected i.p. with disulfiram (DSF) (50 mg/kg body weight) (Trex1–/– + DSF) every other day for 4 weeks for survival analysis or for 2 weeks for other analyses. B Body weight changes in WT + DMSO (n = 6), Trex1–/– + DMSO (n = 5), and Trex1–/– + DSF (n = 8) mice treated as described in (A). C Survival (Kaplan-Meier curves) of Trex1–/– + DMSO (n = 11) and Trex1–/–+ DSF (n = 11) mice treated as described in (A). D Representative images of H&E-stained lung sections from WT + DMSO (n = 3), Trex1–/– + DMSO (n = 3), and Trex1–/– + DSF (n = 3) mice treated as described in (A). qRT‒PCR analysis of Tnf, Cxcl9, and Cxcl10 mRNA expression in the liver (E) and ELISA of CXCL1, CCL5, and IL-6 in the serum (F) of WT + DMSO (n = 6), Trex1–/– + DMSO (n = 6), and Trex1–/–+ DSF (n = 6) mice treated as described in (A). G Representative images (right) of spleens and spleen weight/body weight ratios (left) of WT + DMSO (n = 6), Trex1–/– + DMSO (n = 6), and Trex1–/– + DSF (n = 6) mice treated as described in (A). H Survival (Kaplan-Meier curves) of wild-type (WT) → WT chimeric mice injected i.p. with DMSO (WT → WT + DMSO) (n = 8), STINGN153S/WT (NS) → WT chimeric mice injected i.p. with DMSO (NS → WT + DMSO) (n = 11), and NS → WT chimeric mice injected i.p. with DSF (50 mg/kg body weight) (NS → WT + DSF) (n = 10) every other day starting from the 6th week after bone marrow cell transfer for 5 weeks for survival analysis or for 2 weeks for various other analyses. qRT‒PCR analysis of Tnf, Cxcl10, and Cxcl9 mRNA expression in the brain (I) and ELISA of CXCL1, CCL5, and IL-6 in the serum (J) of WT → WT + DMSO (n = 6), NS → WT + DMSO (n = 6), and NS → WT + DSF (n = 6) mice treated as described in (H). K Representative images (left) of spleens and spleen weight/body weight ratios (right) of DMSO (n = 6), Trex1–/– + DMSO (n = 6), or Trex1–/–+ DSF (n = 6) mice treated every other day as described in (H). *P < 0.05, **P < 0.01, ***P < 0.001; ns, not significant (one-way ANOVA or the log-rank test). The graphs show the means ± SDs (B, EG, IK). The scale bars represent 200 μm (D). The data are combined from two independent experiments (C, H) or are representative of two independent experiments (B, DG, IK)
Fig. 7
Fig. 7
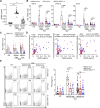
Inhibition of RNF115 downregulates the expression of proinflammatory cytokines in PBMCs from SLE patients. A Quantitative analysis of the dsDNA concentration in plasma from SLE patients and healthy donors (HDs) (n = 15). High-dsDNA (n = 13) and low-dsDNA (n = 35) patients were defined based on a cutoff plasma dsDNA concentration of 0.1 μg/ml. qRT‒PCR analysis of ISG15, CXCL10, CCL5 (B), and RNF115 (C) mRNA expression in PBMCs obtained as described in (A) and transfected with siCon or siRNF115 in the presence of DMSO or disulfiram (DSF) (5 μM) for 24 h. D Correlation analysis between fold decreases in the expression levels of the genes listed in (B) and the dsDNA concentration in the SLE patients described in (A). E Flow cytometric analysis of intracellular IFN-α expression in PBMCs treated as described in (A) and then stained with an anti-IFN-α-PE antibody. *P < 0.05, **P < 0.01, ***P < 0.001 (one-way ANOVA). The graphs show the means ± SDs (AC, E)

References

    1. Tan X, Sun L, Chen J, Chen ZJ. Detection of microbial infections through innate immune sensing of nucleic acids. Annu Rev Microbiol. 2018;72:447–78. doi: 10.1146/annurev-micro-102215-095605. - DOI - PubMed
    1. Zhong B, Shu HB. MITA/STING-mediated antiviral immunity and autoimmunity: the evolution, mechanism, and intervention. Curr Opin Immunol. 2022;78:102248. doi: 10.1016/j.coi.2022.102248. - DOI - PubMed
    1. Zhang ZD, Zhong B. Regulation and function of the cGAS-MITA/STING axis in health and disease. Cell Insight. 2022;1:100001. doi: 10.1016/j.cellin.2021.100001. - DOI - PMC - PubMed
    1. Li XD, Wu J, Gao D, Wang H, Sun L, Chen ZJ. Pivotal roles of cGAS-cGAMP signaling in antiviral defense and immune adjuvant effects. Science. 2013;341:1390–4. doi: 10.1126/science.1244040. - DOI - PMC - PubMed
    1. Sun L, Wu J, Du F, Chen X, Chen ZJ. Cyclic GMP-AMP synthase is a cytosolic DNA sensor that activates the type I interferon pathway. Science. 2013;339:786–91. doi: 10.1126/science.1232458. - DOI - PMC - PubMed