. 2024 Feb;4(2):185-197.
doi: 10.1038/s43587-023-00564-1. Epub 2024 Jan 24.

TXNRD1 drives the innate immune response in senescent cells with implications for age-associated inflammation

Affiliations

TXNRD1 drives the innate immune response in senescent cells with implications for age-associated inflammation

Xue Hao et al. Nat Aging. 2024 Feb.

Abstract

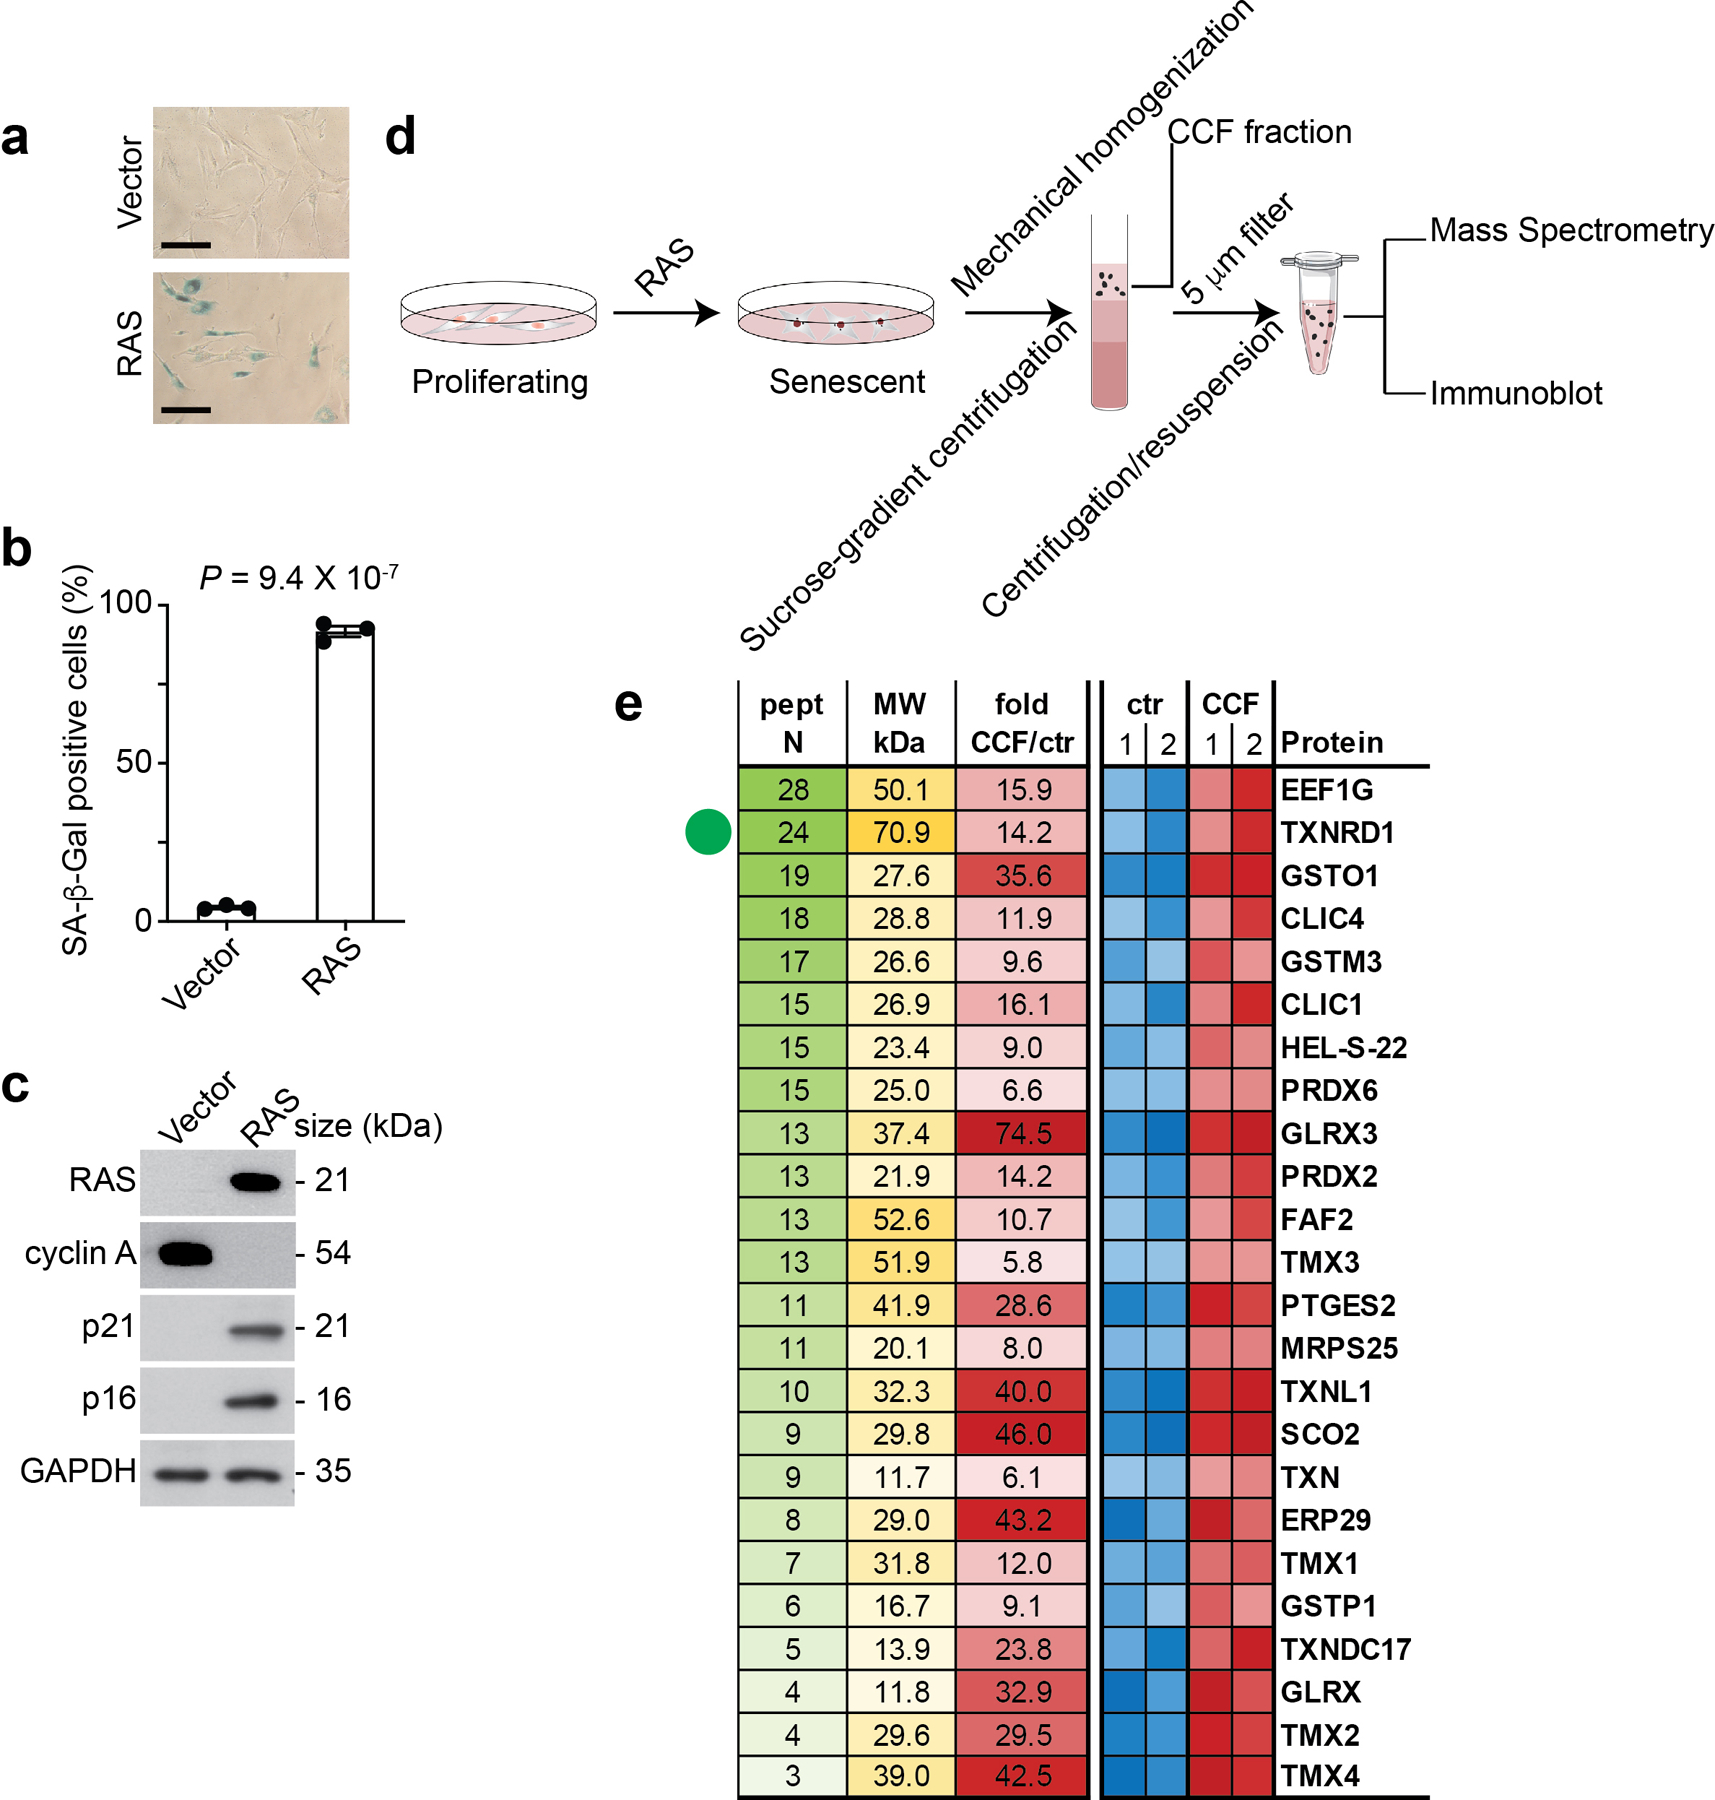
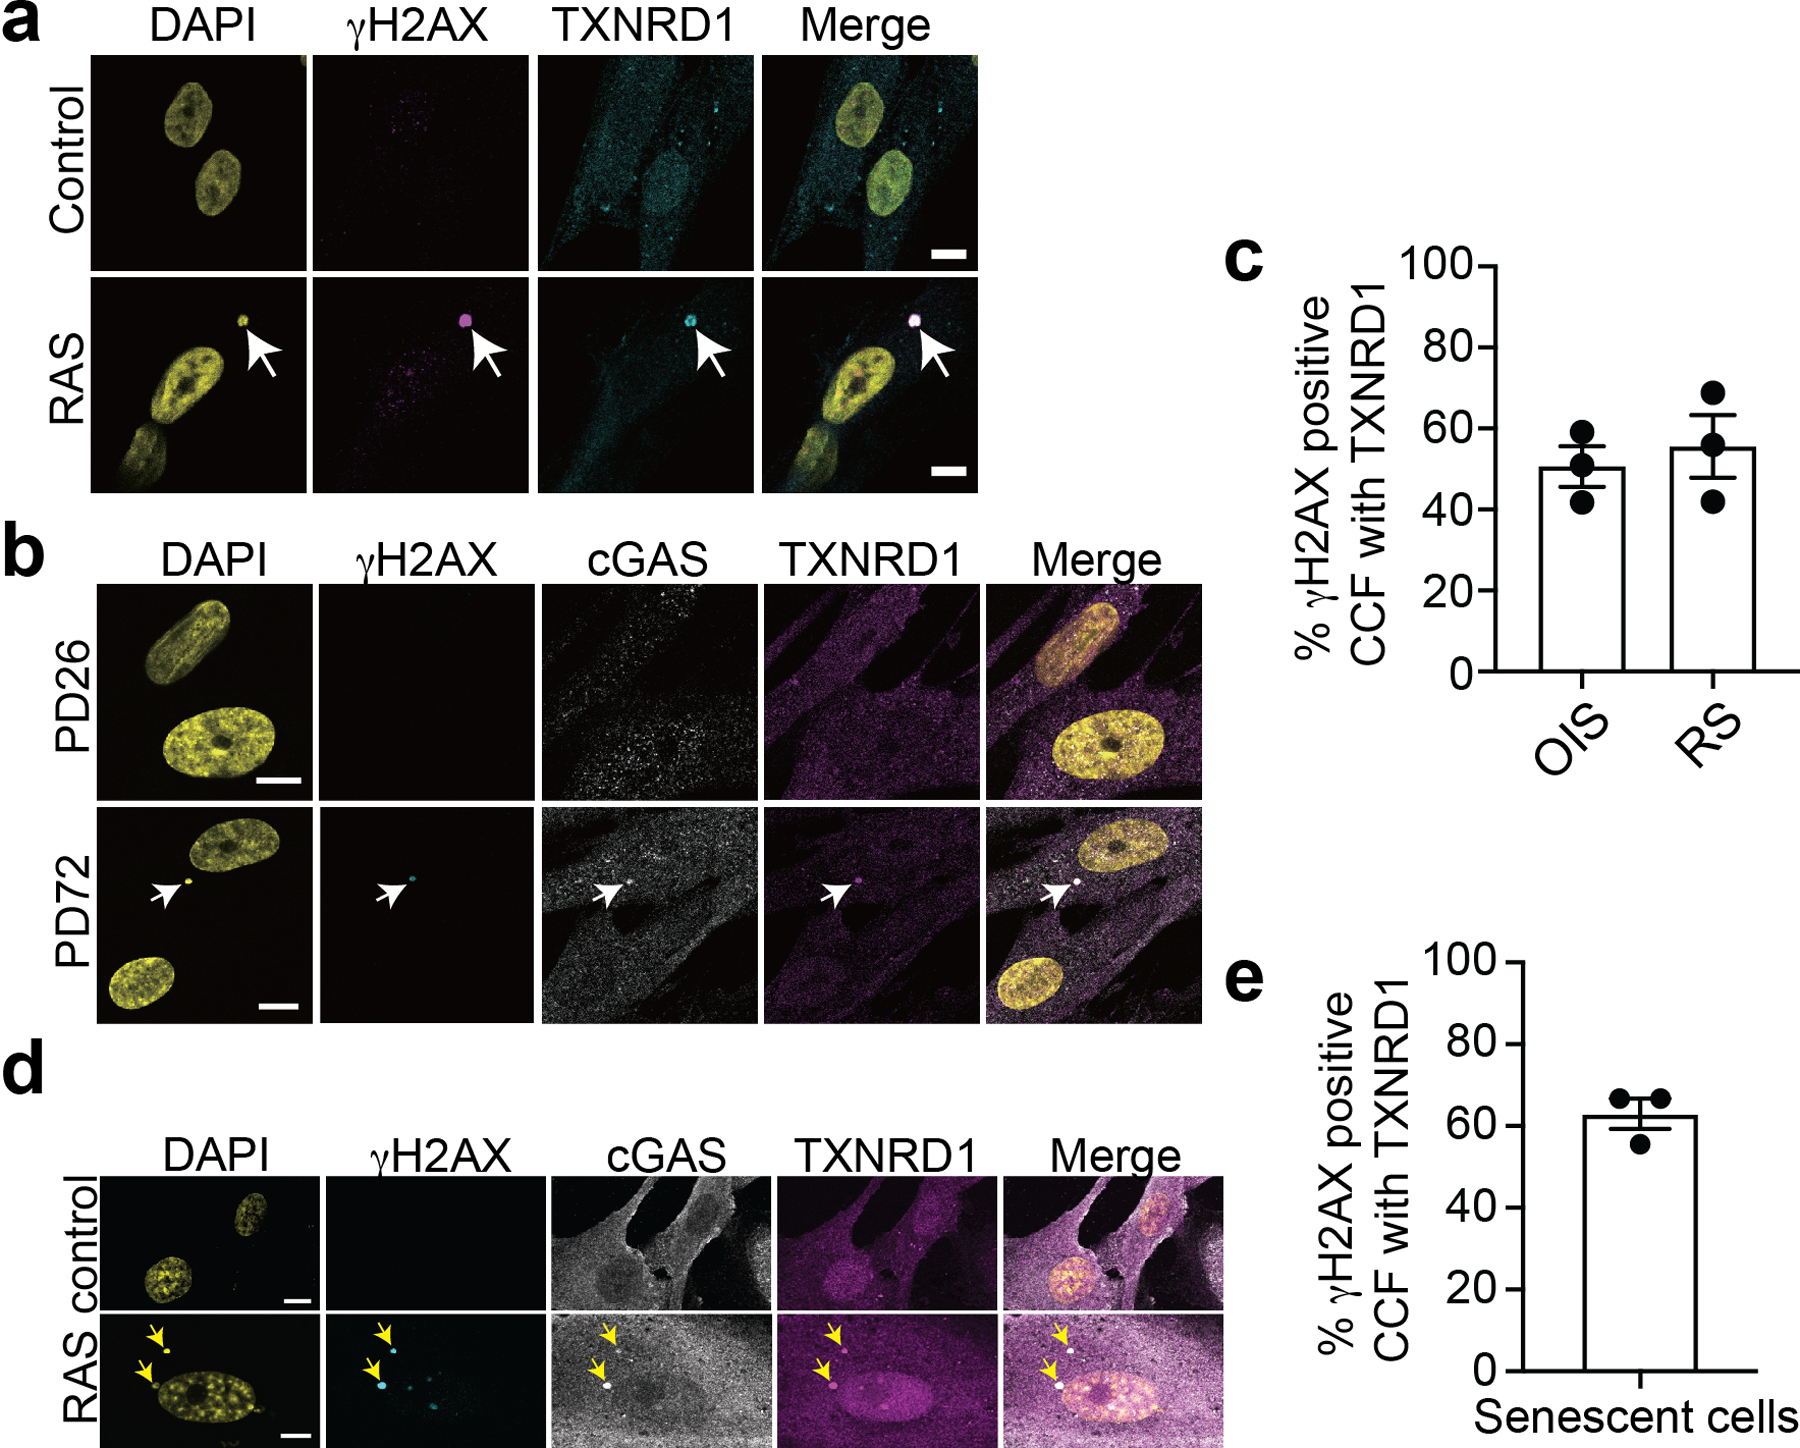
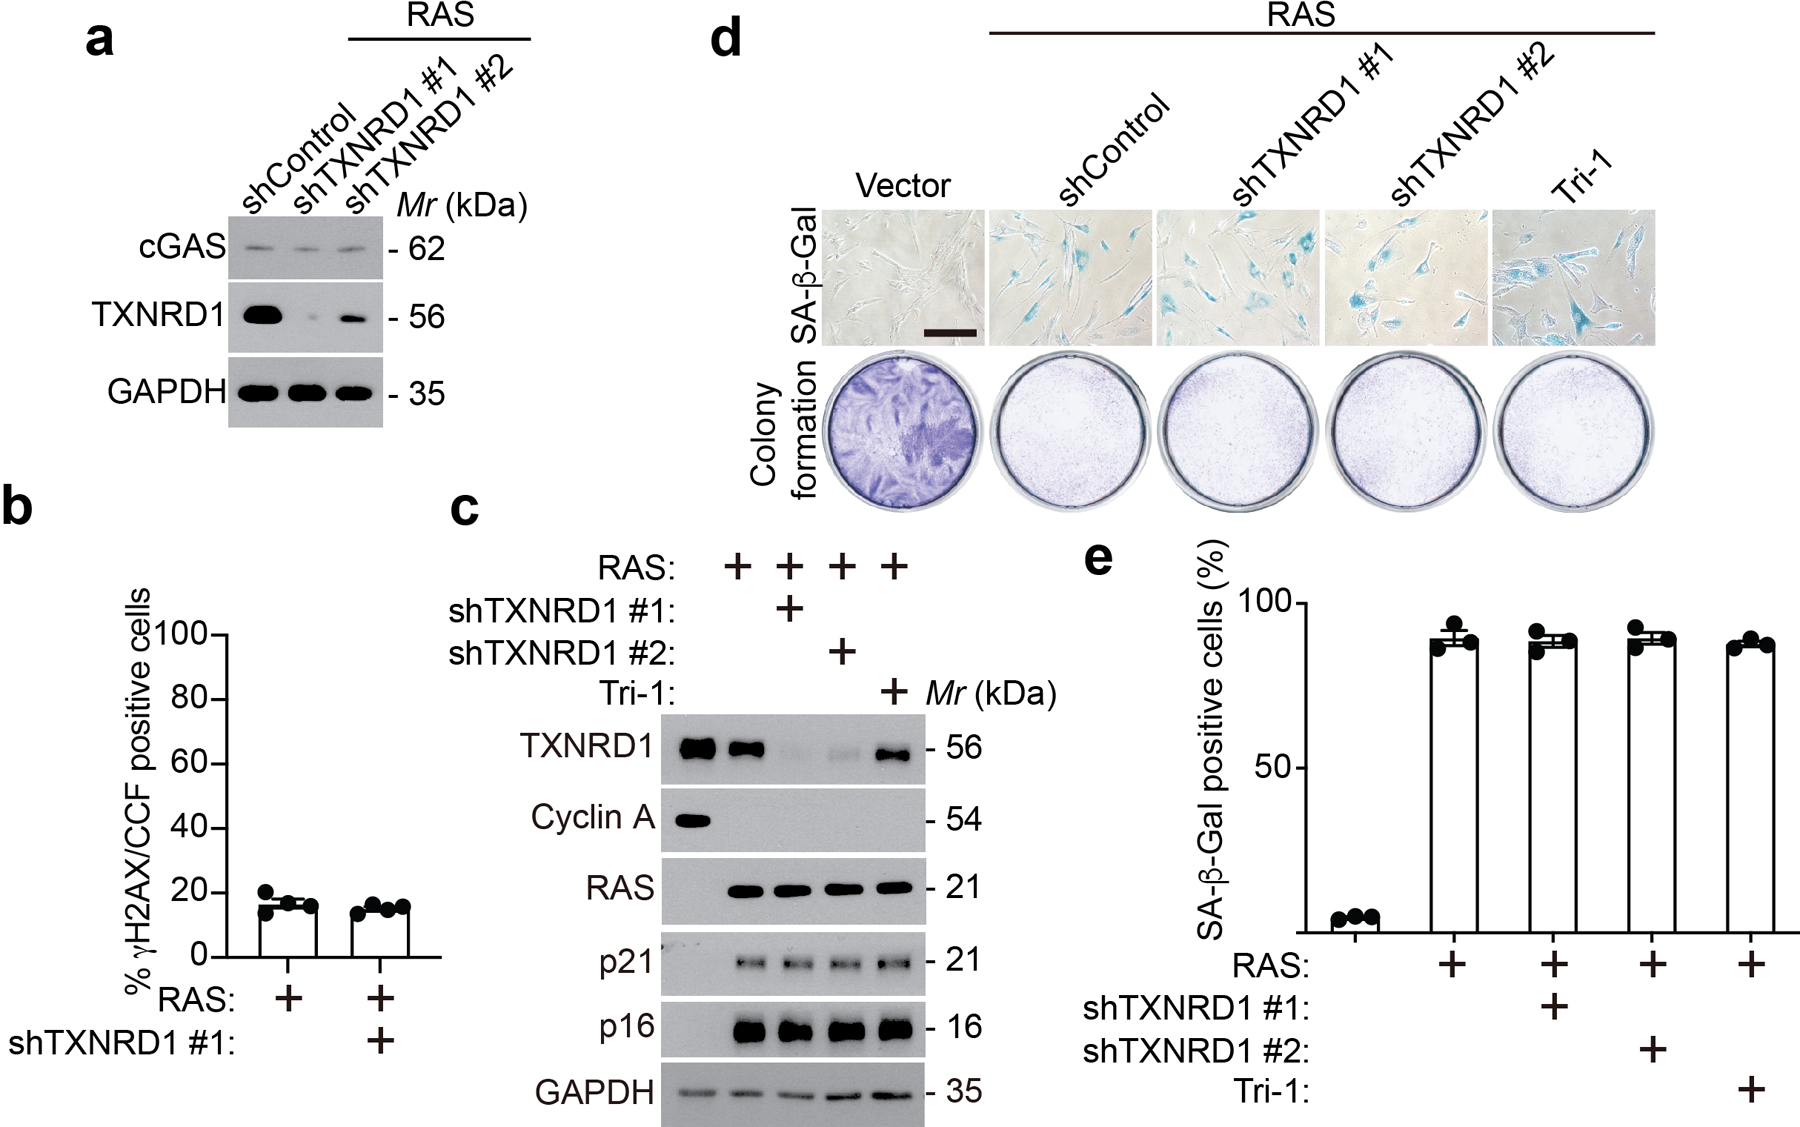
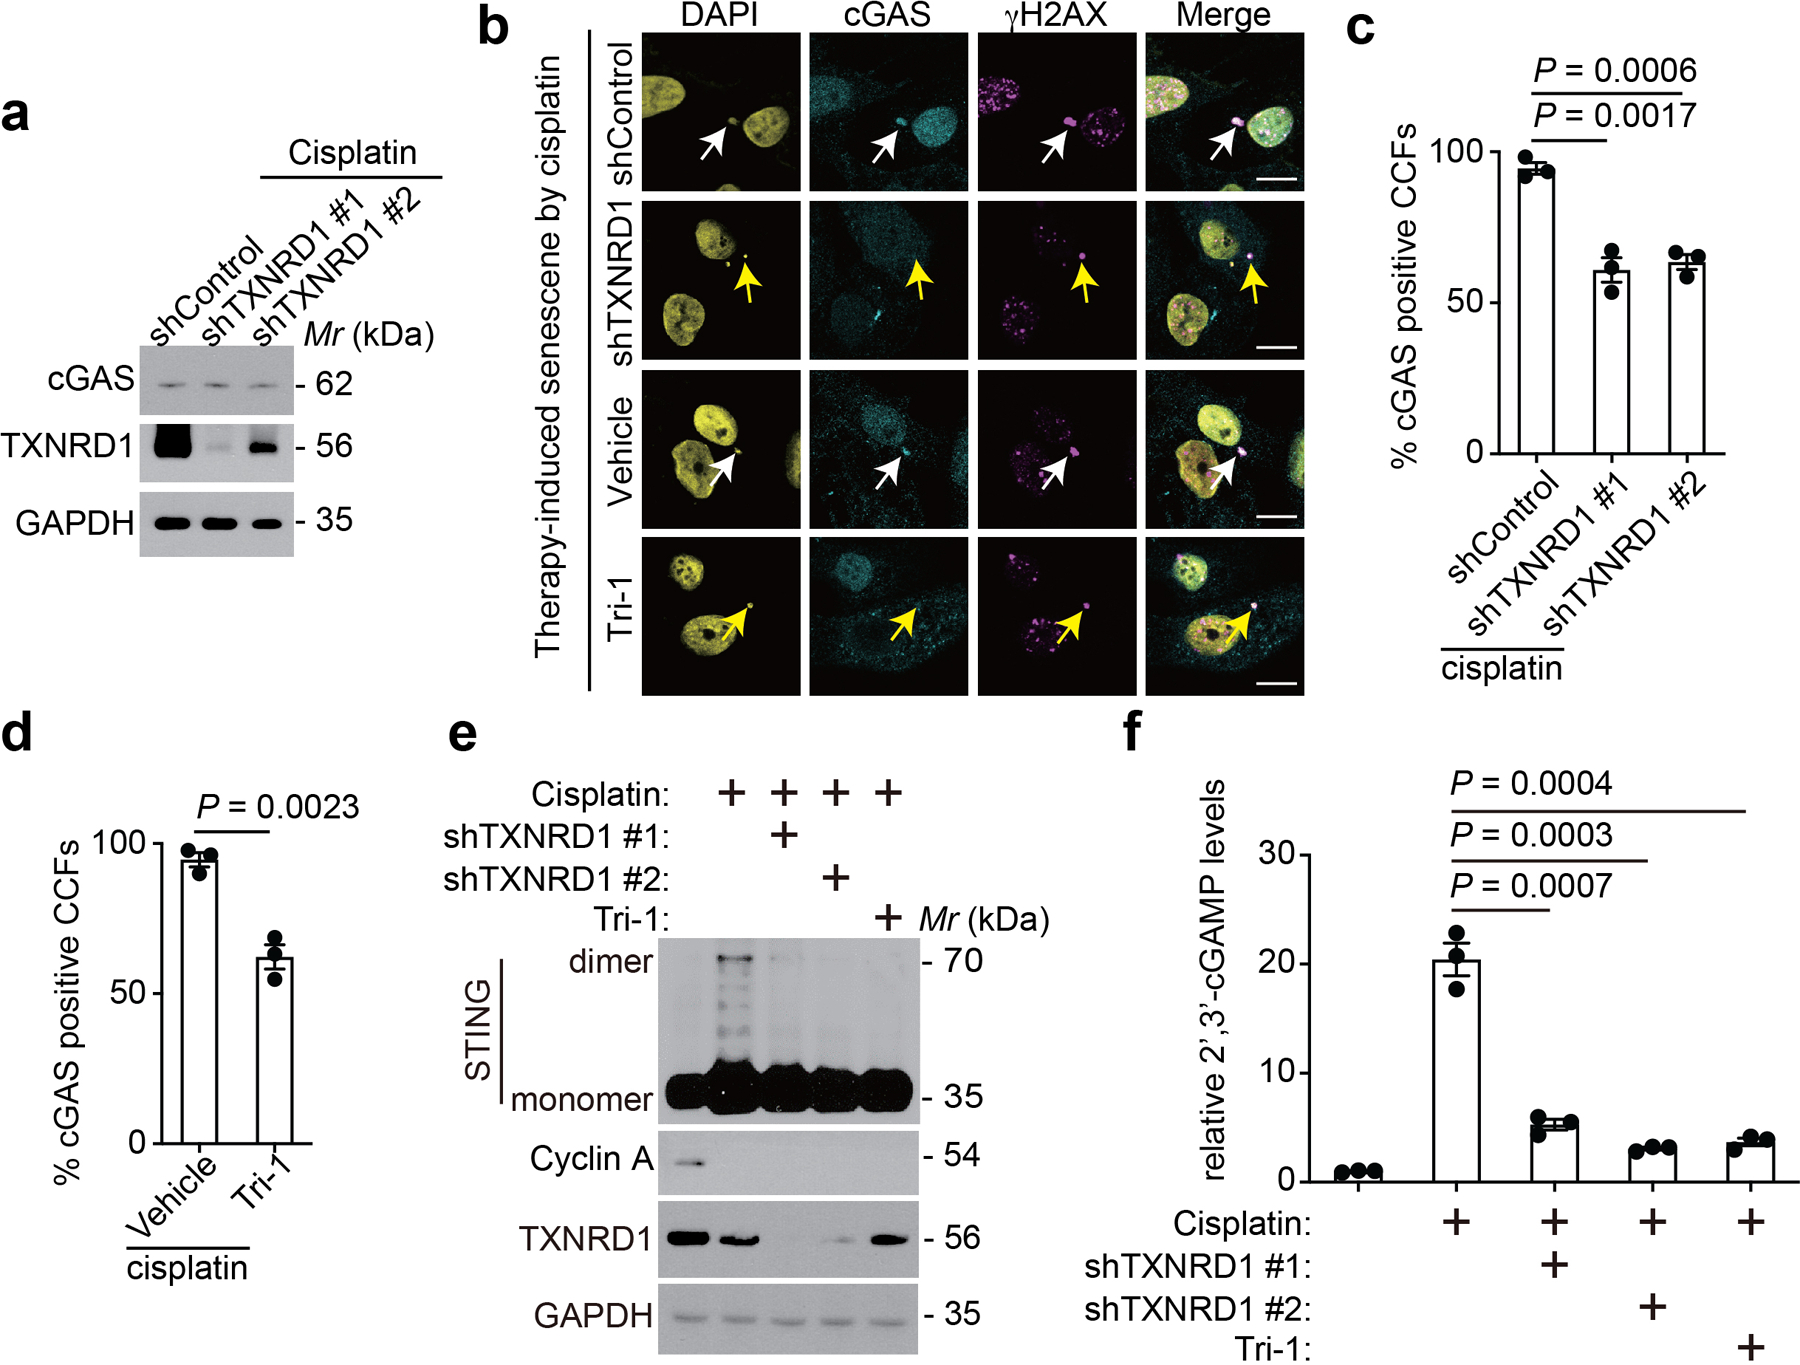
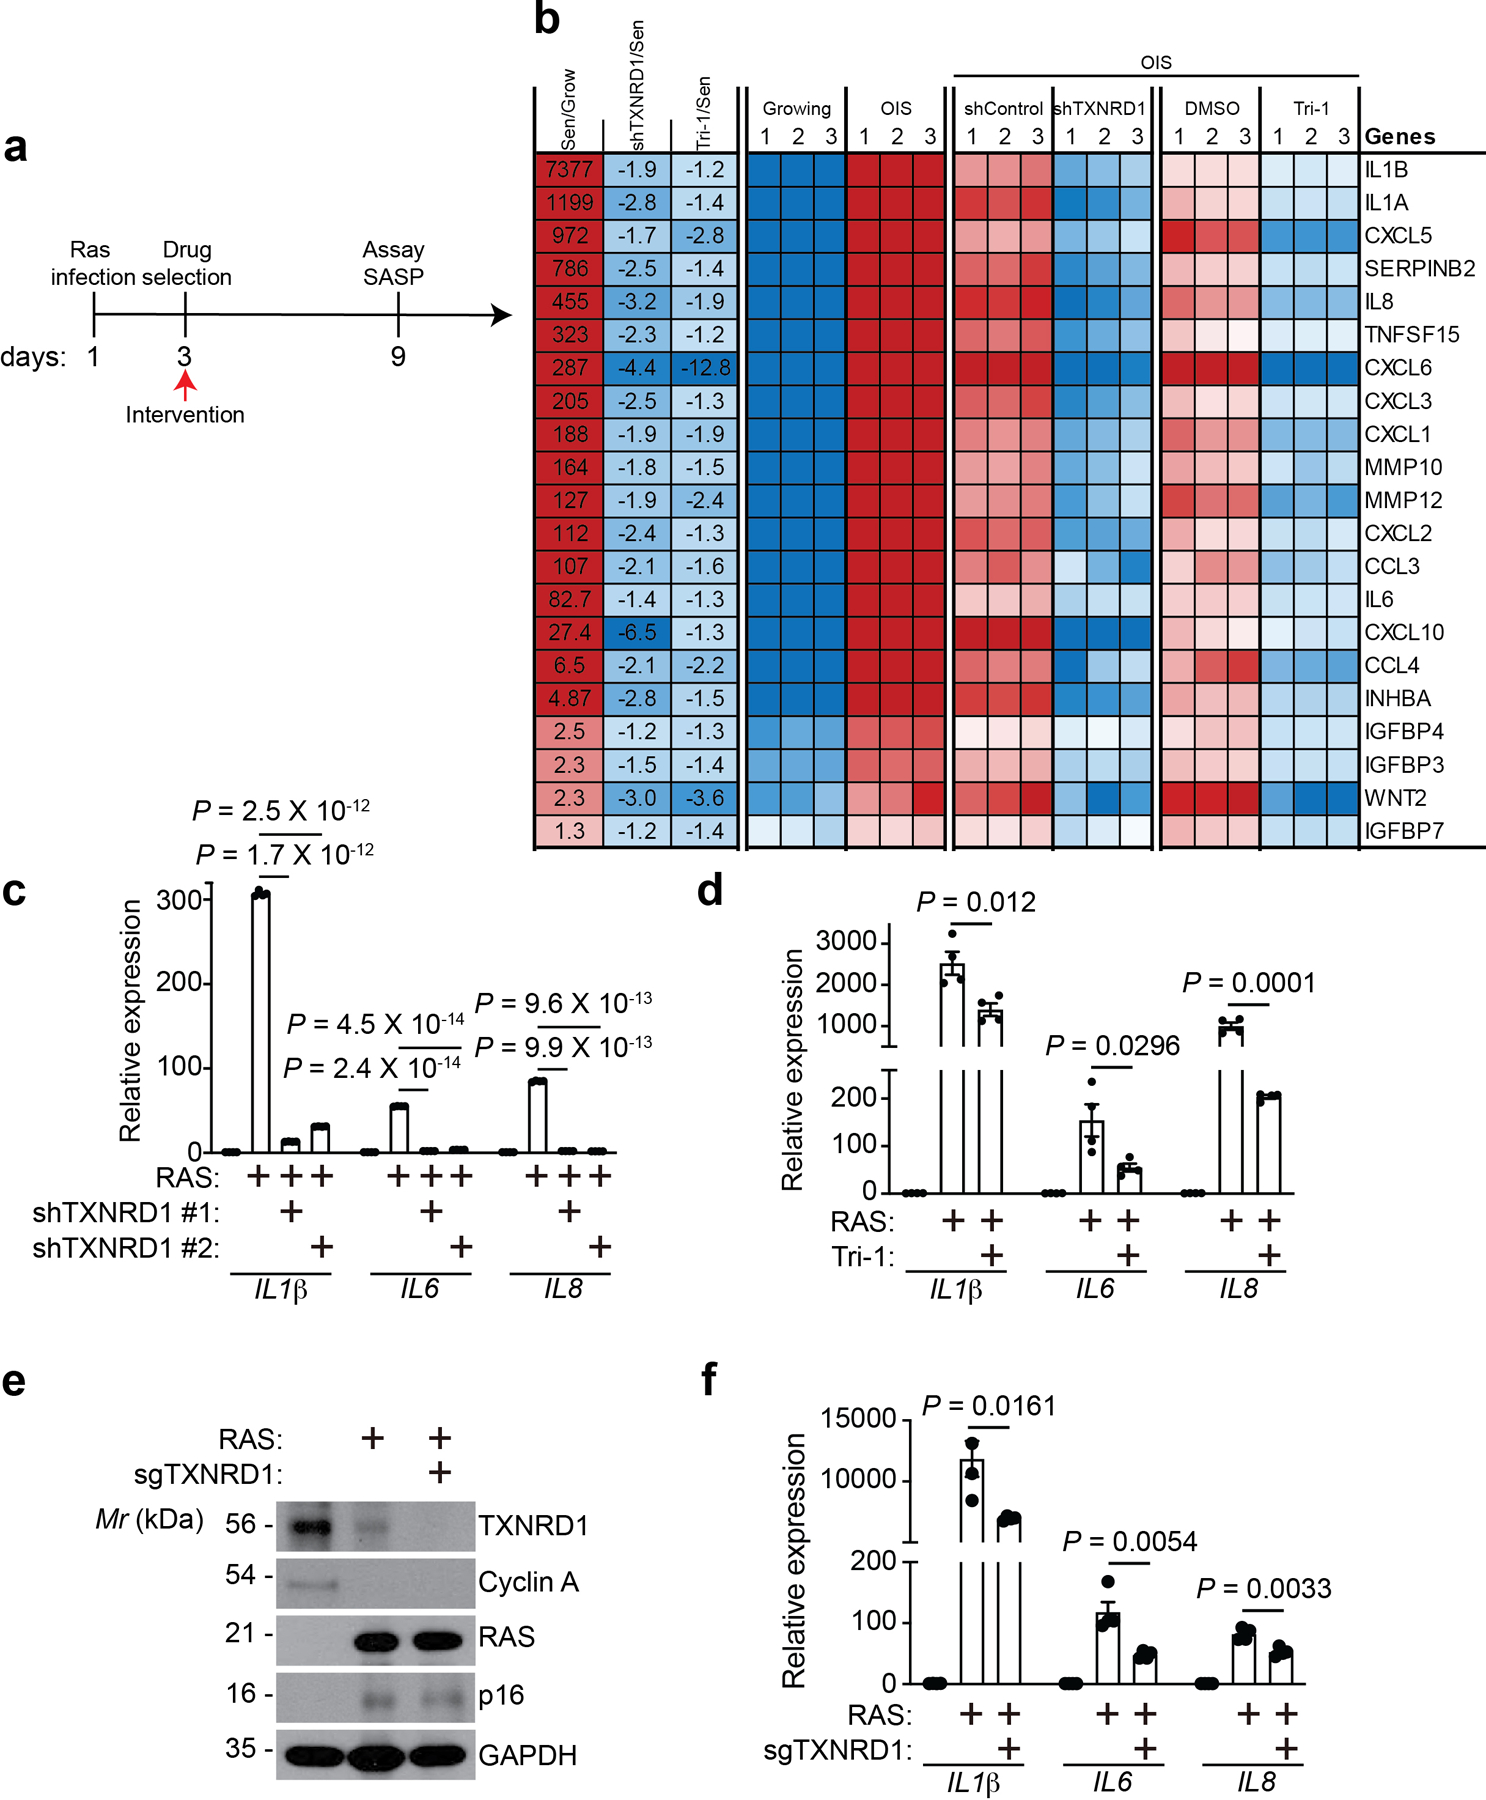
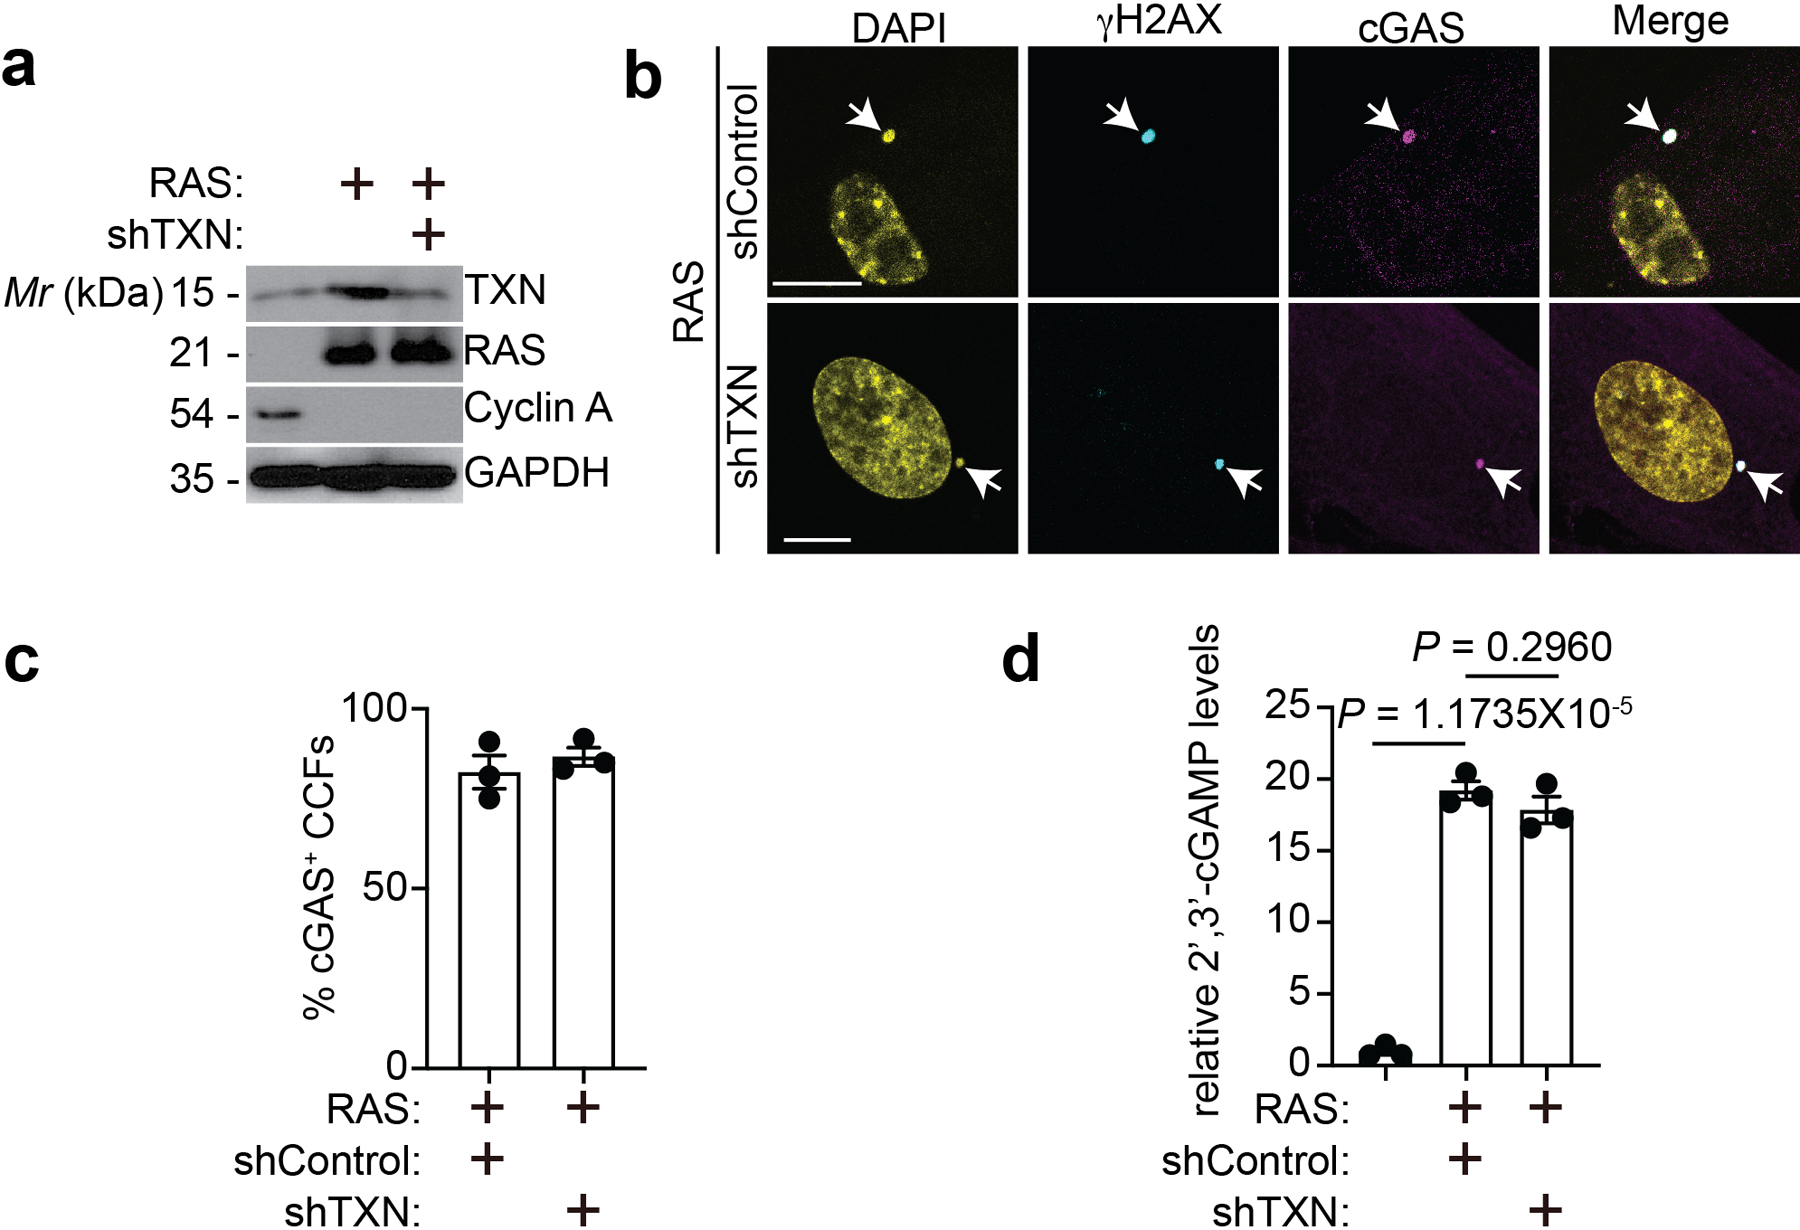
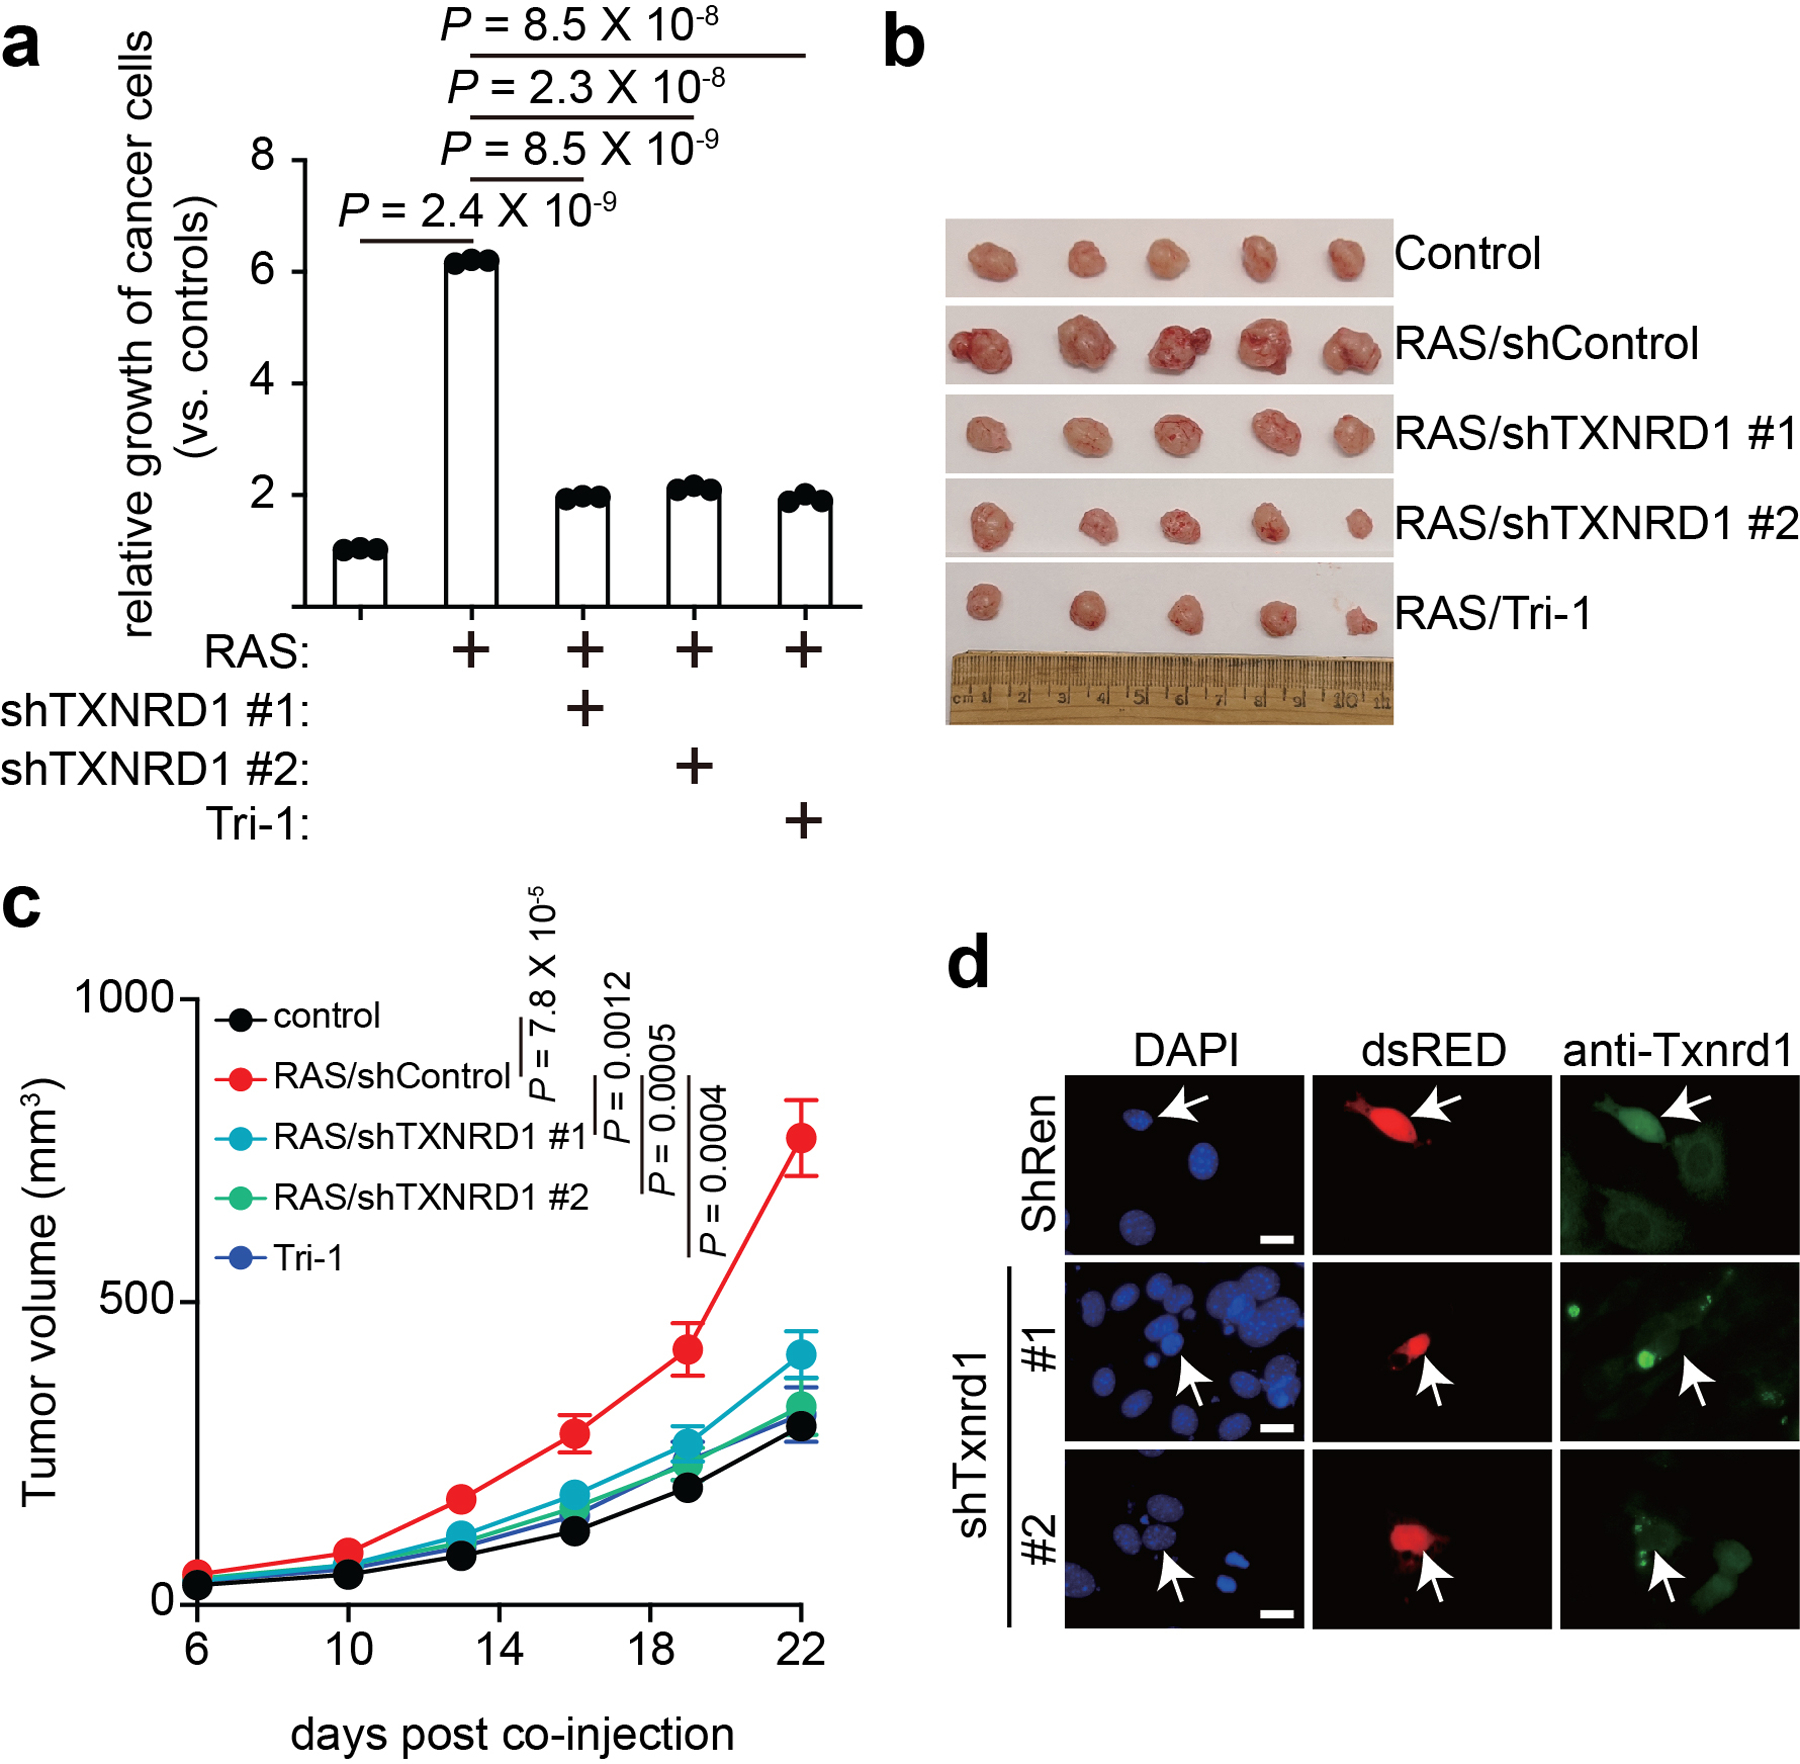
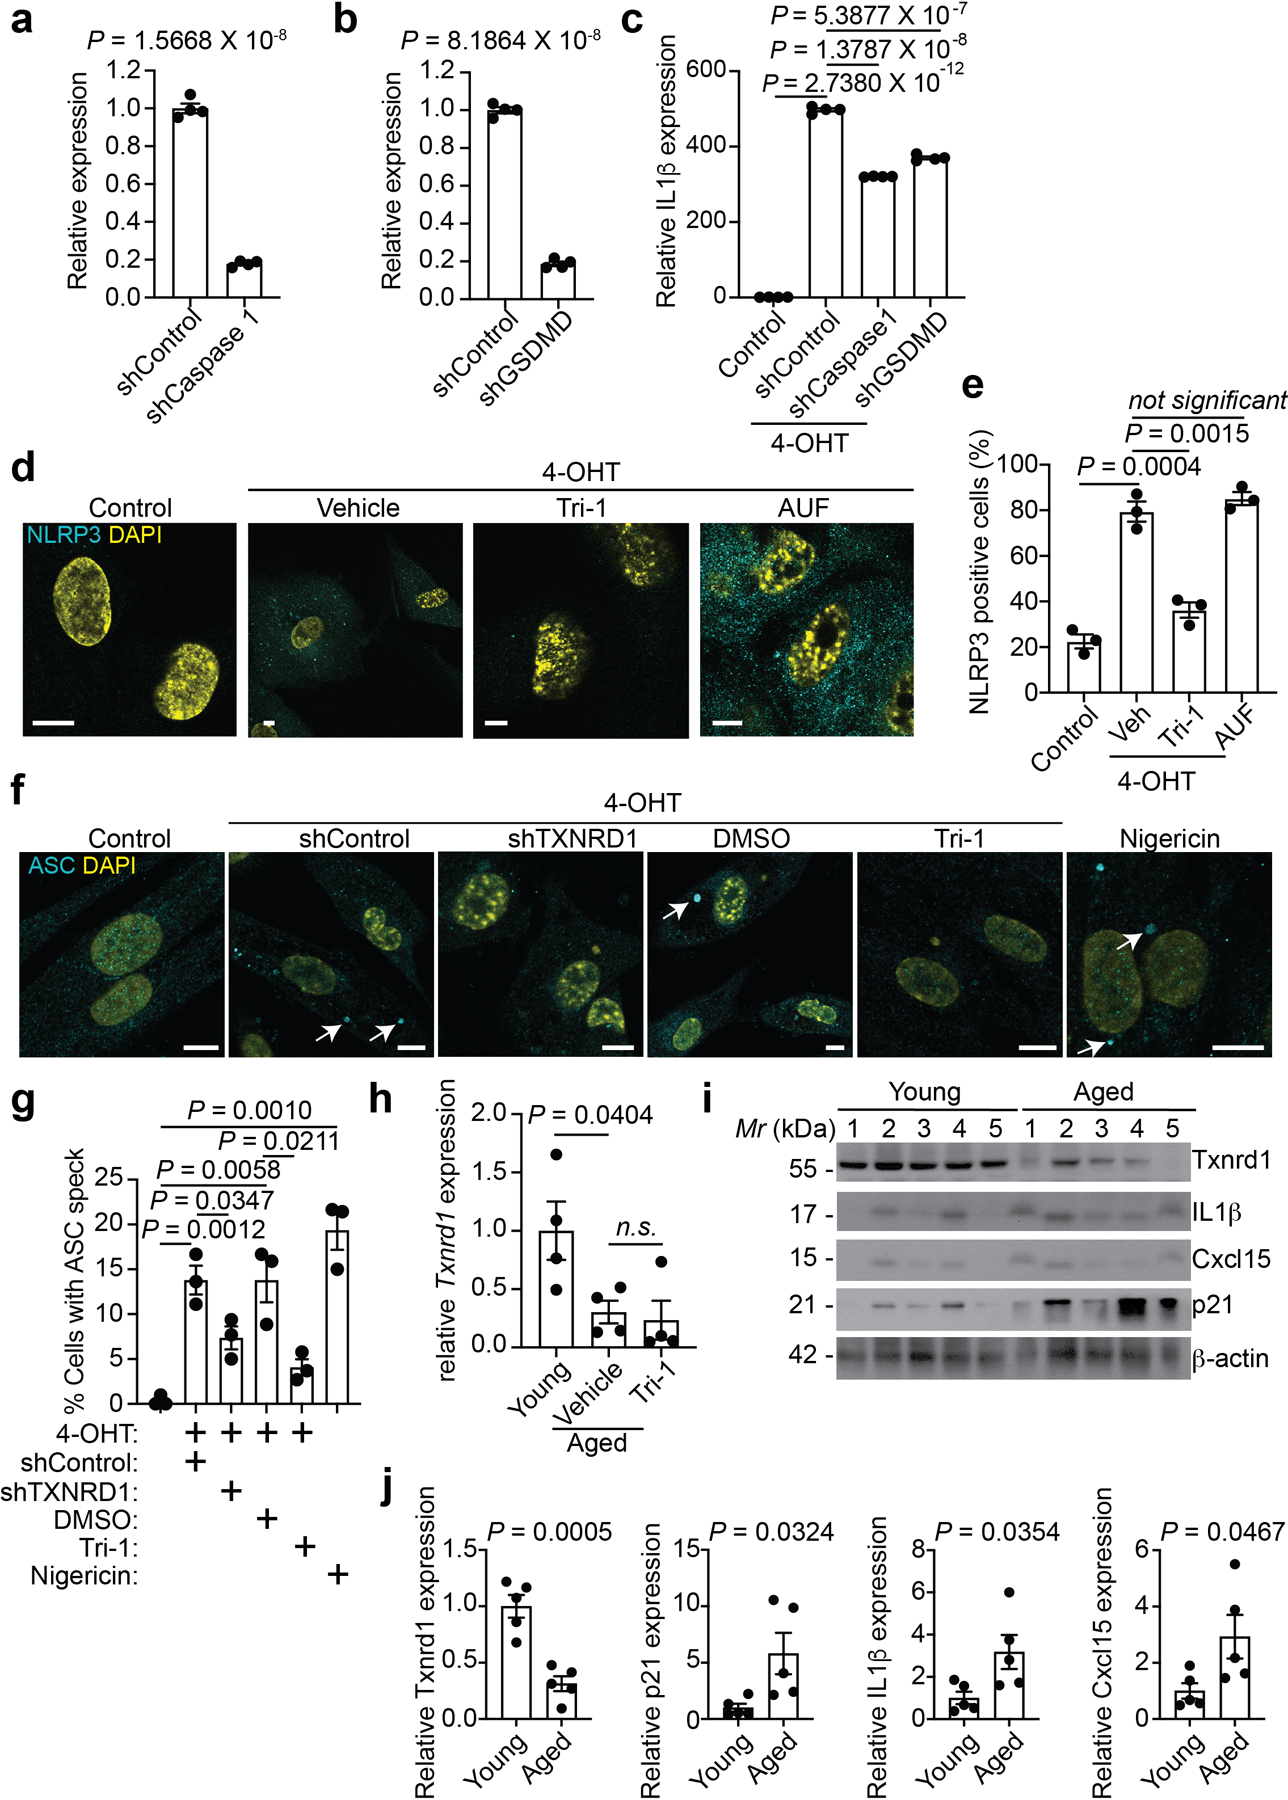
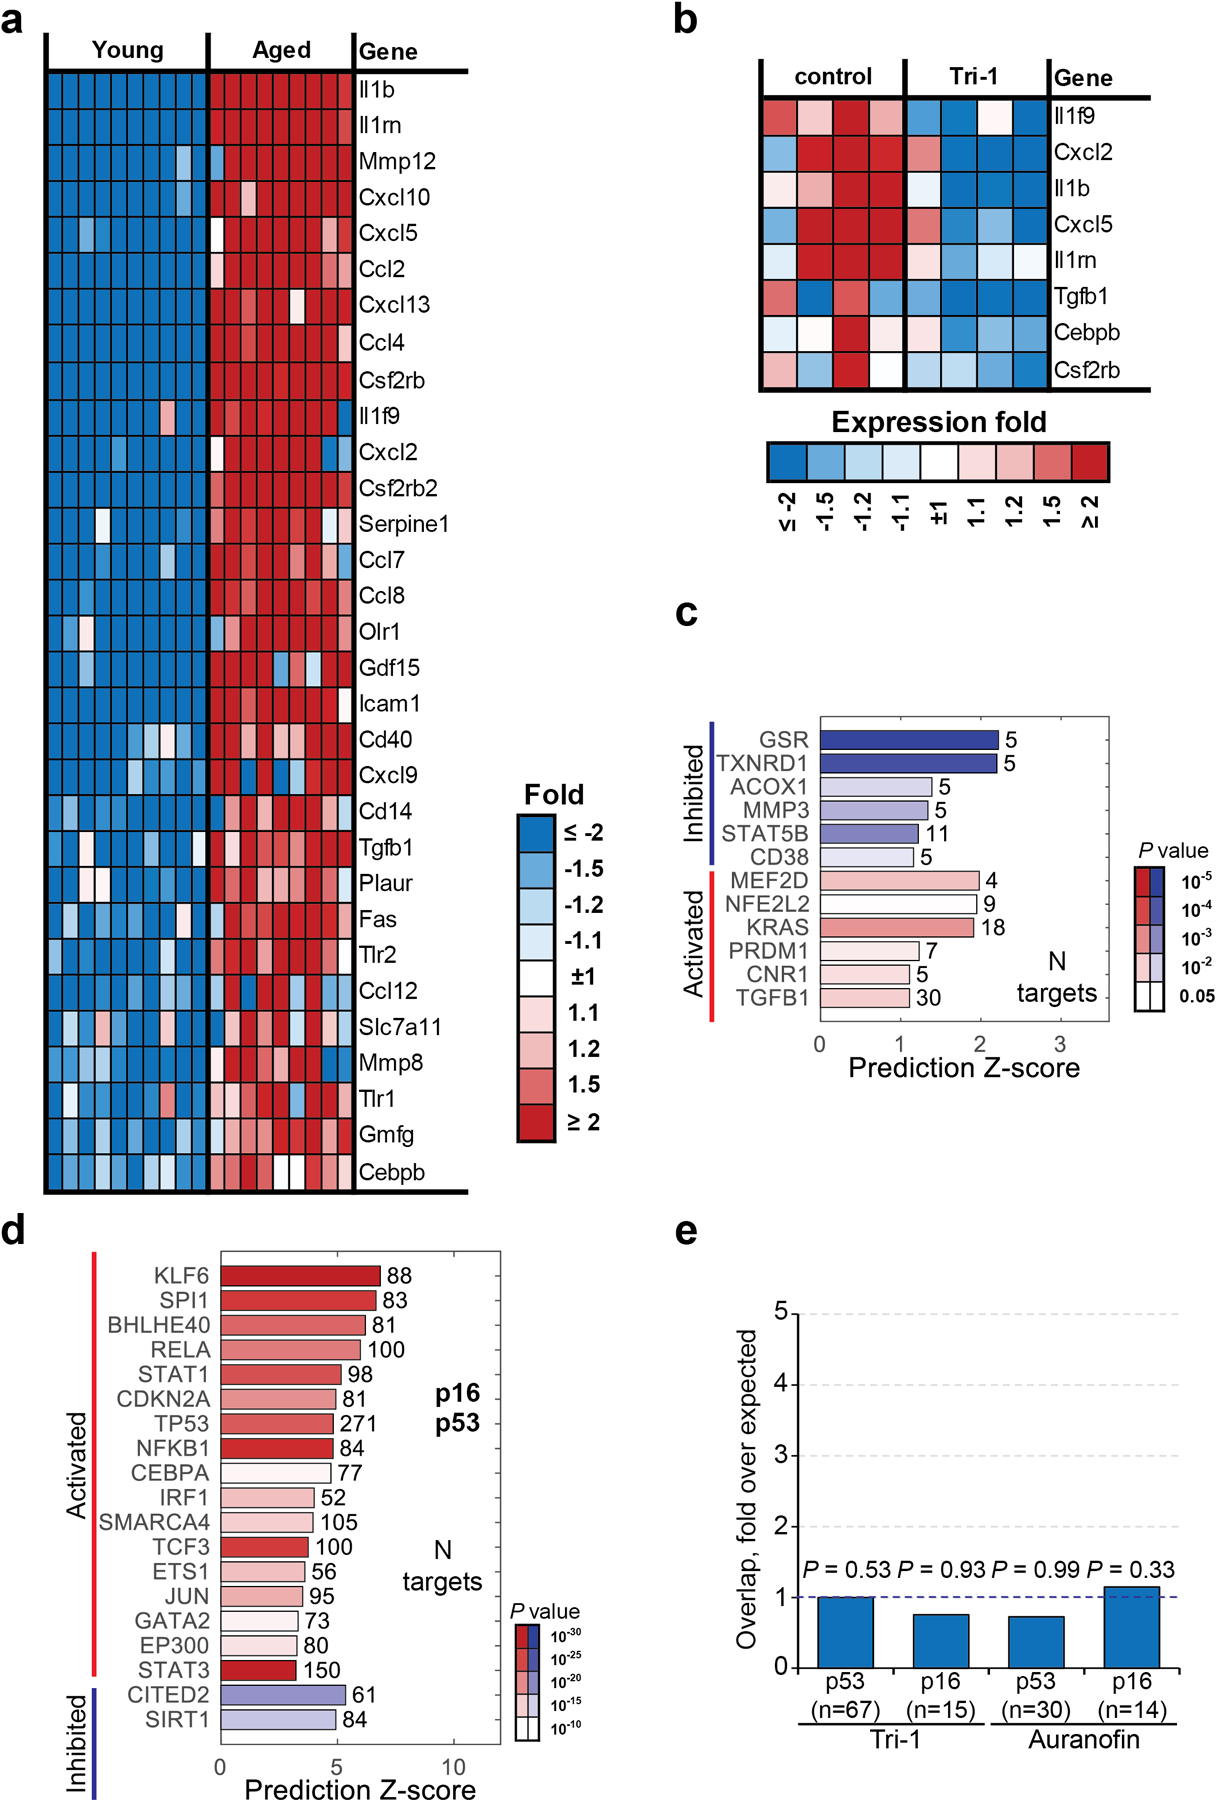
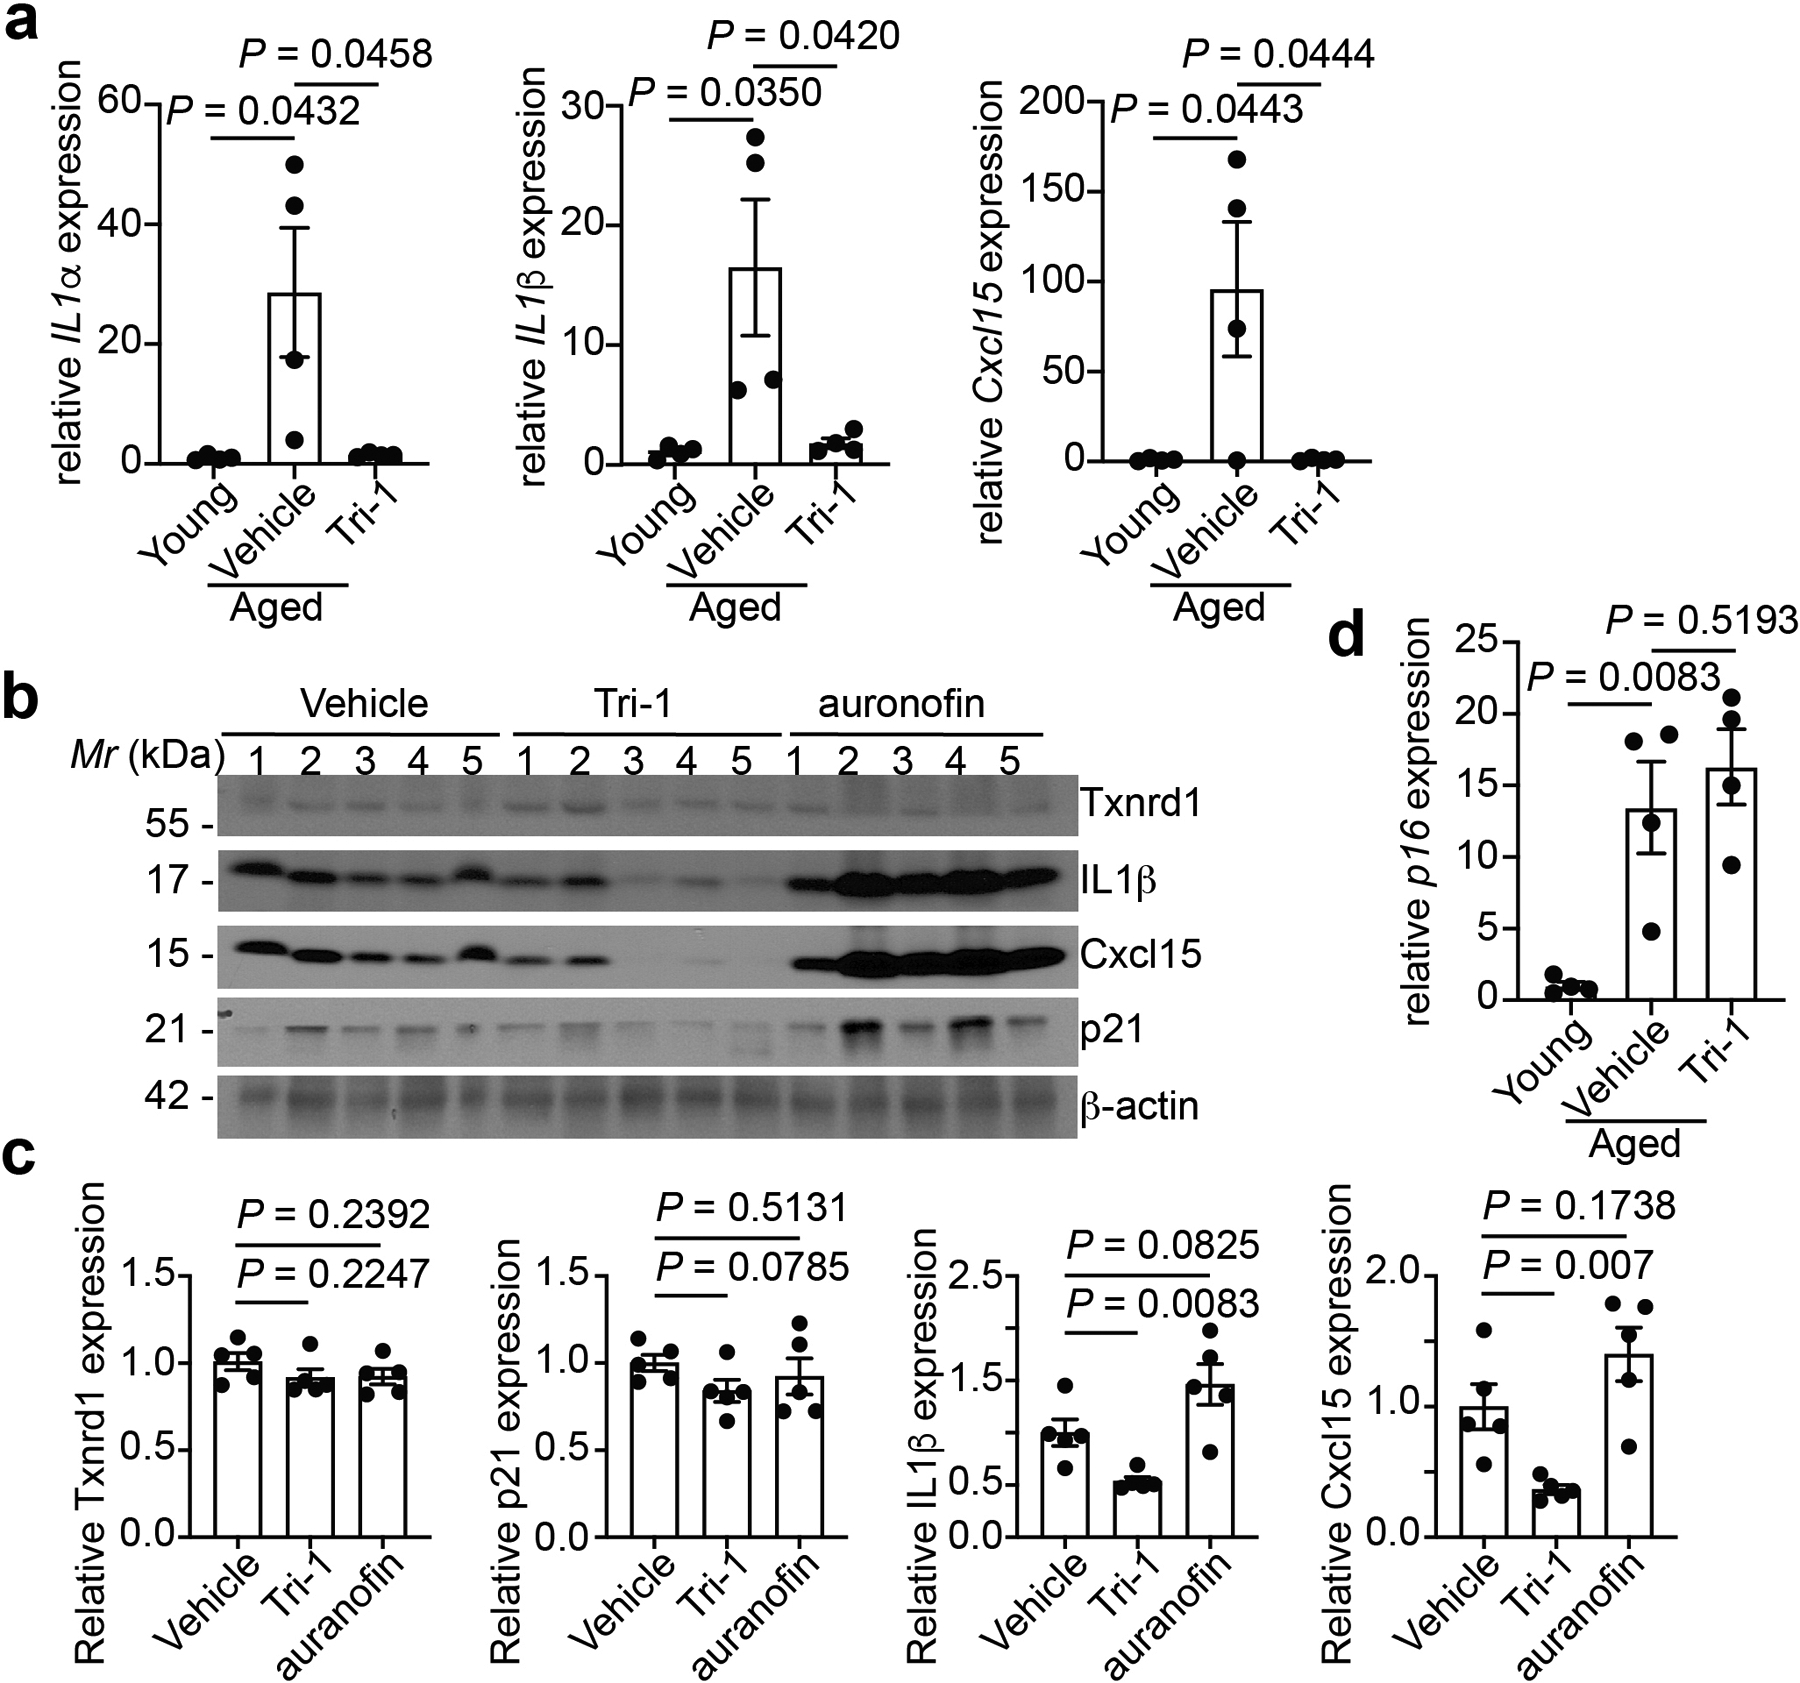
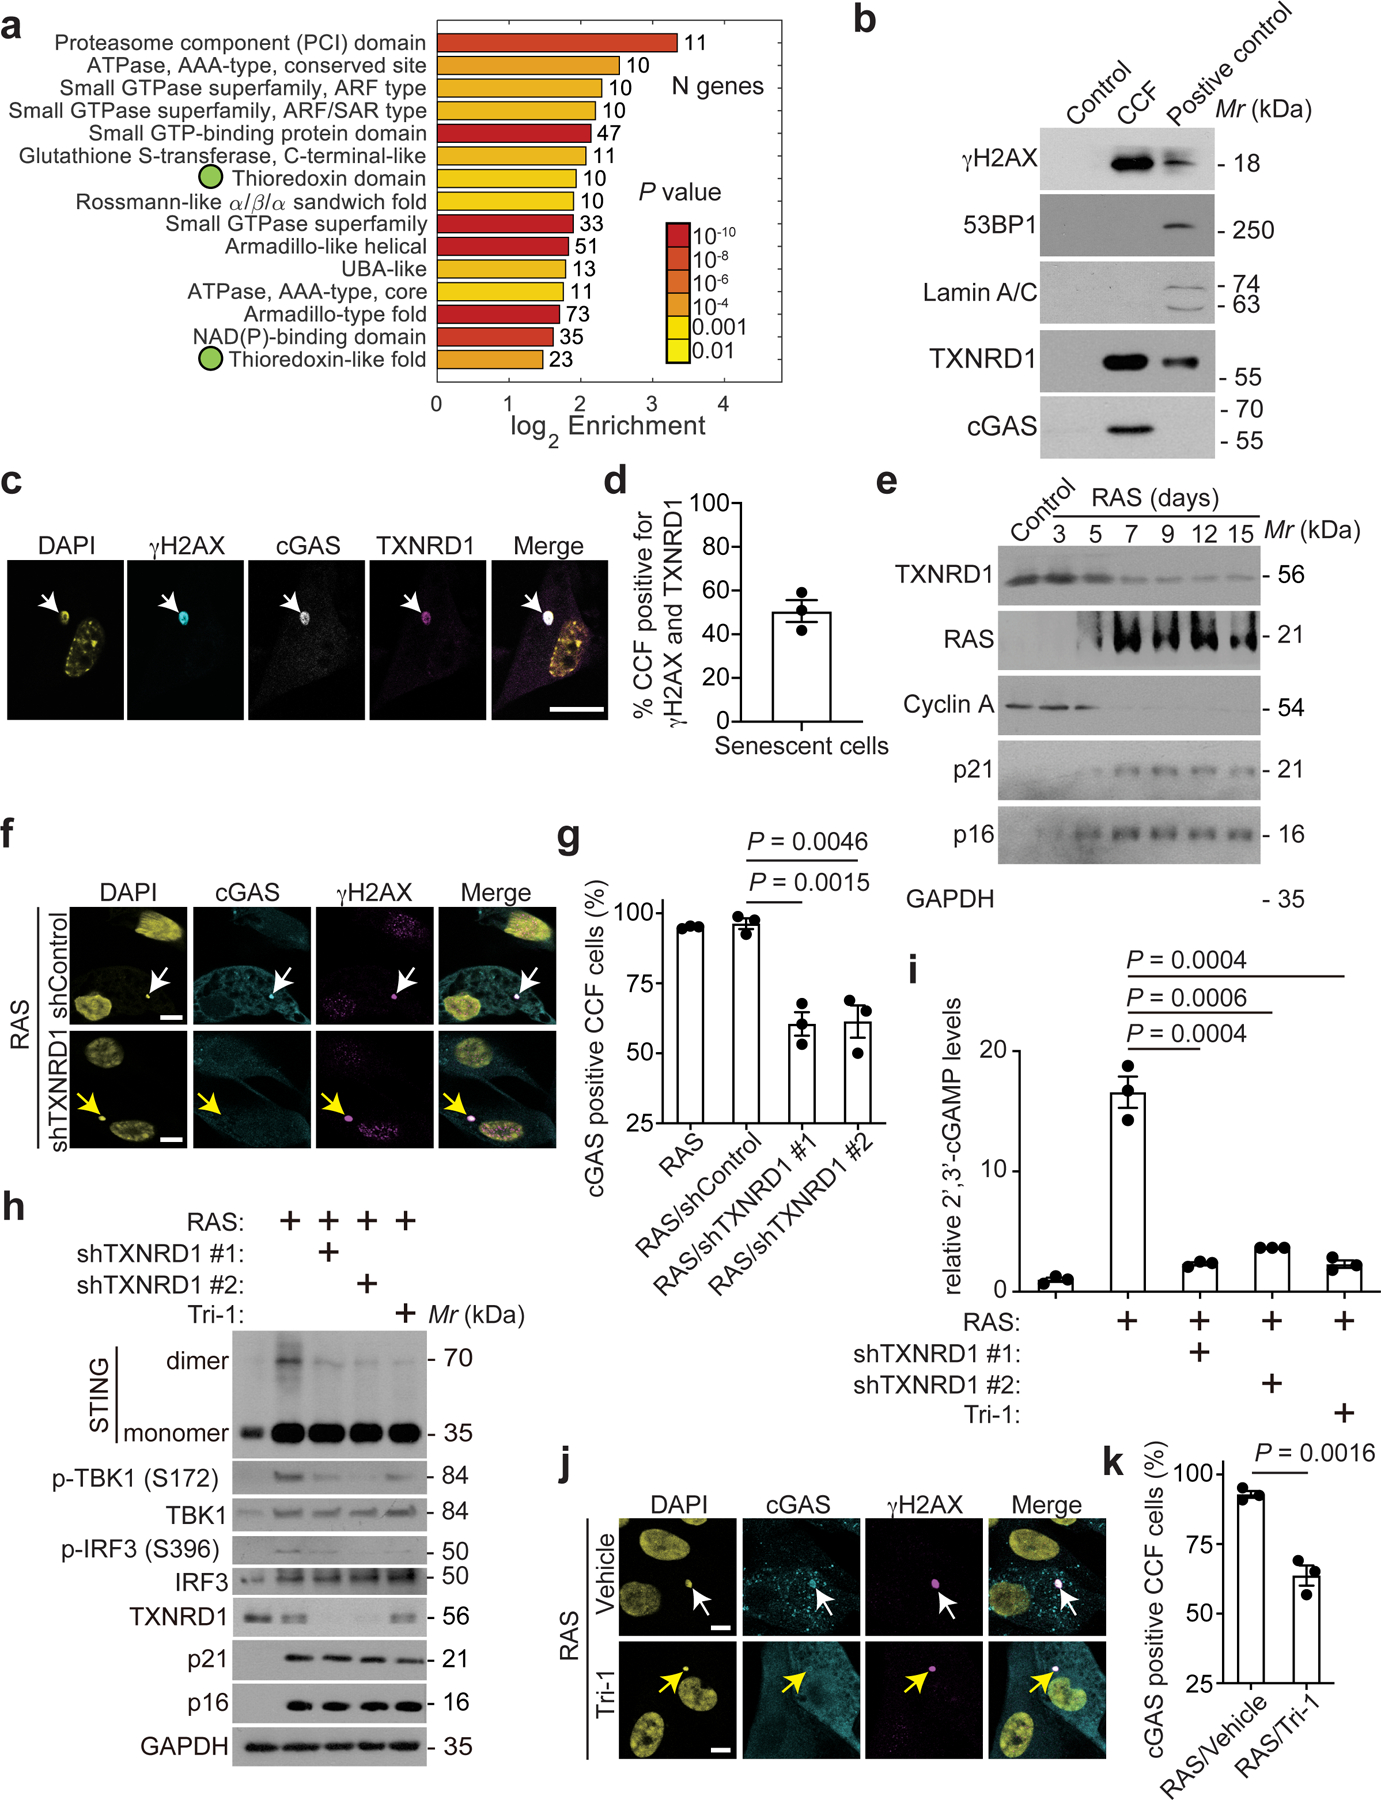
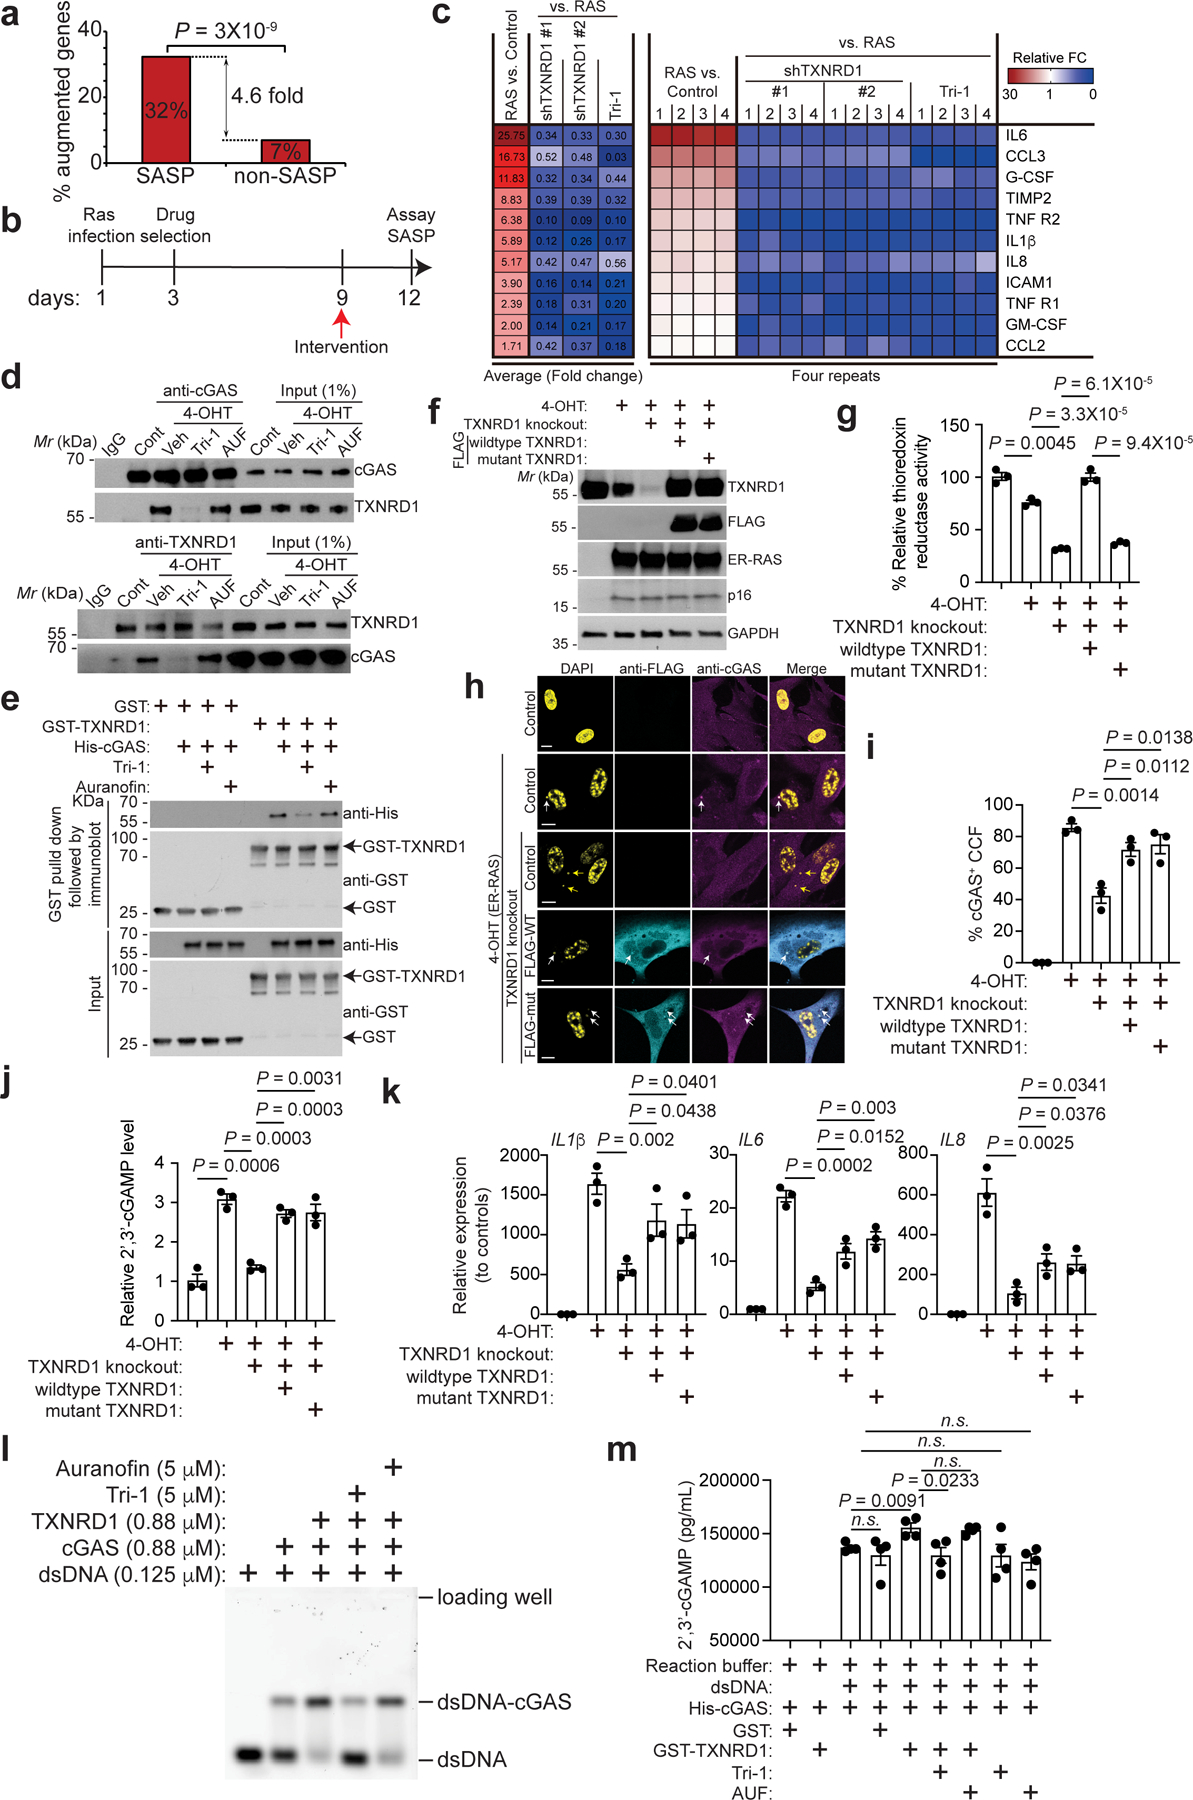
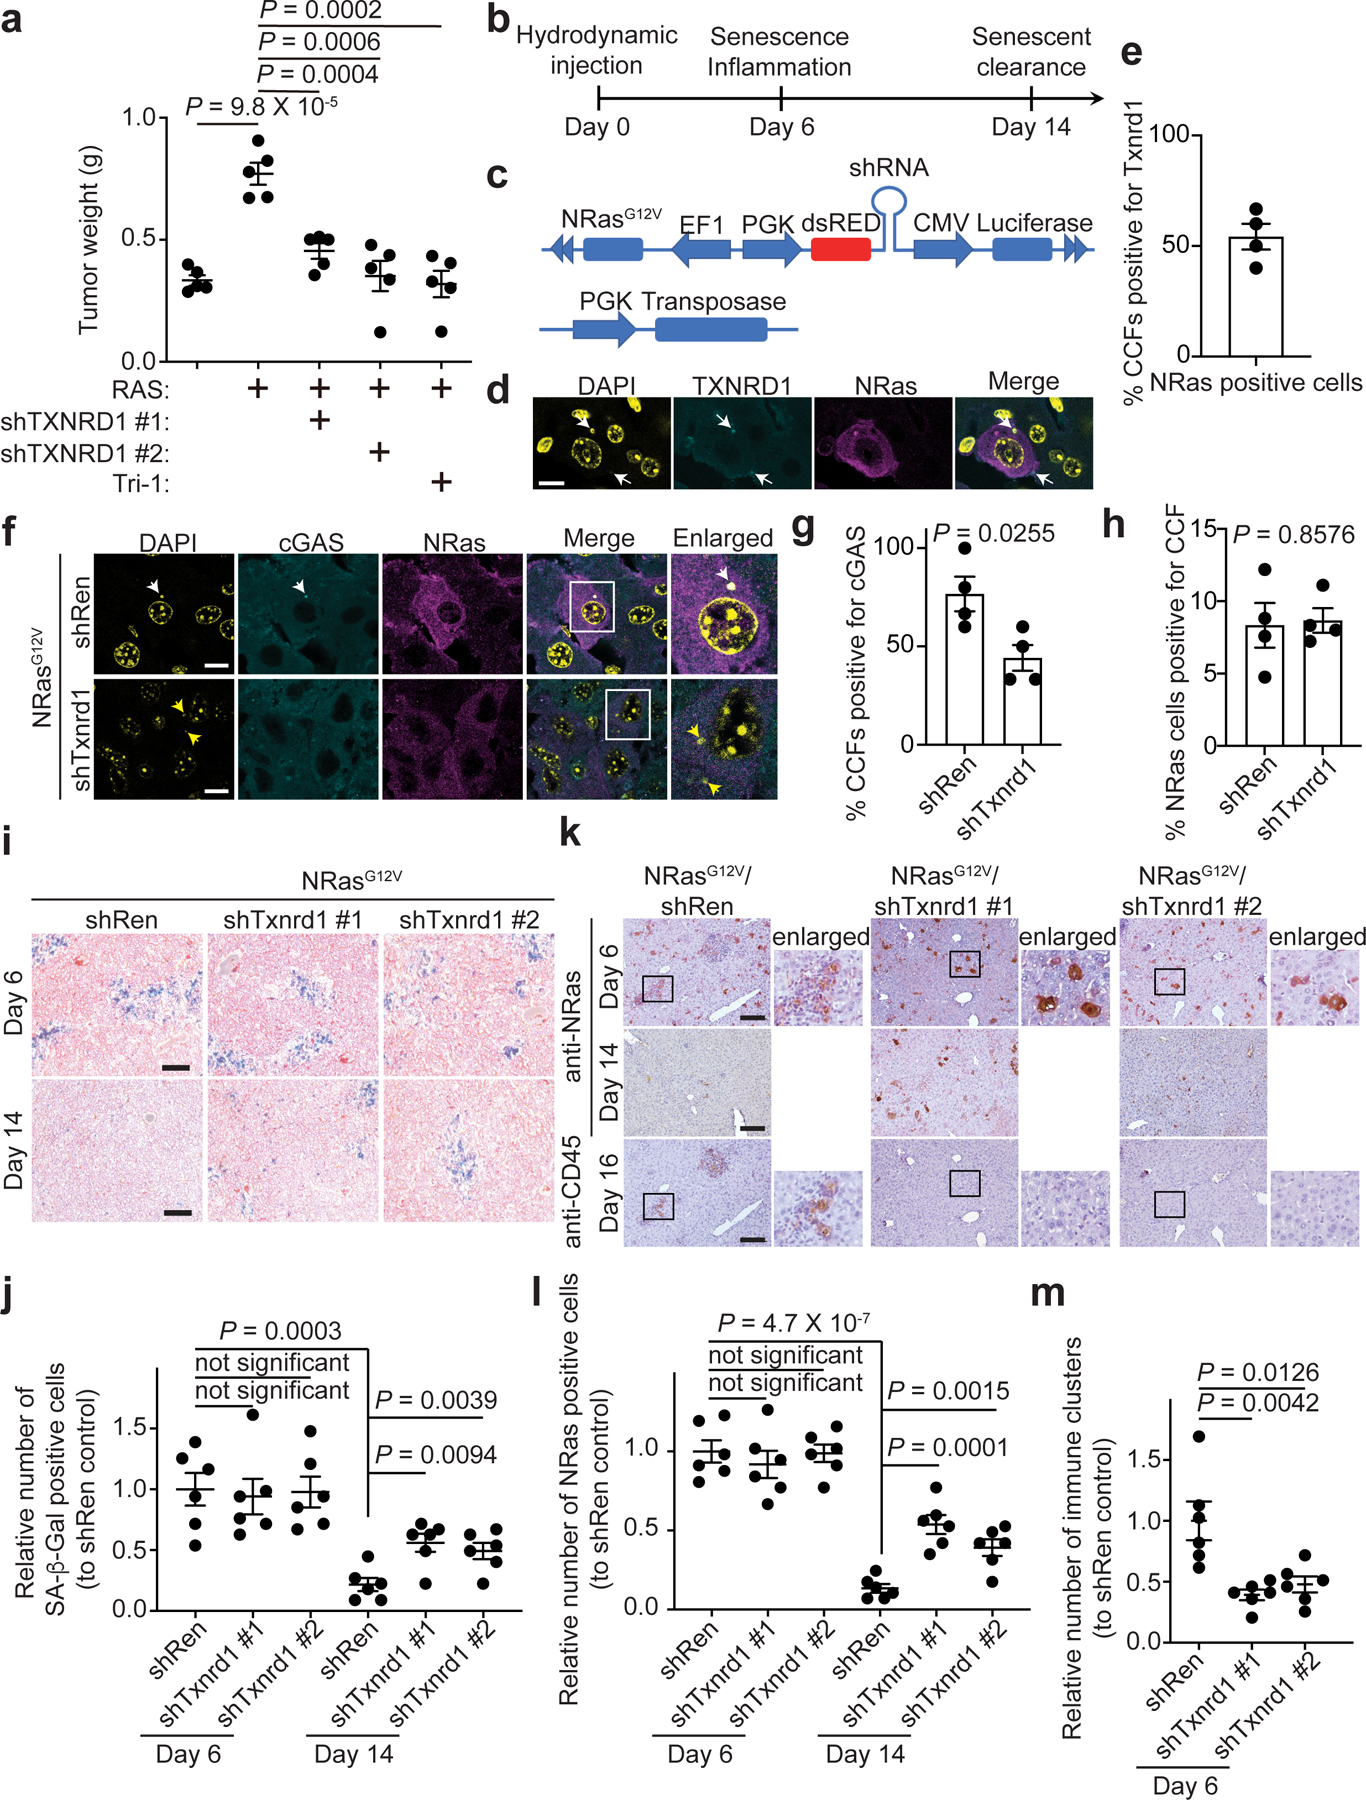
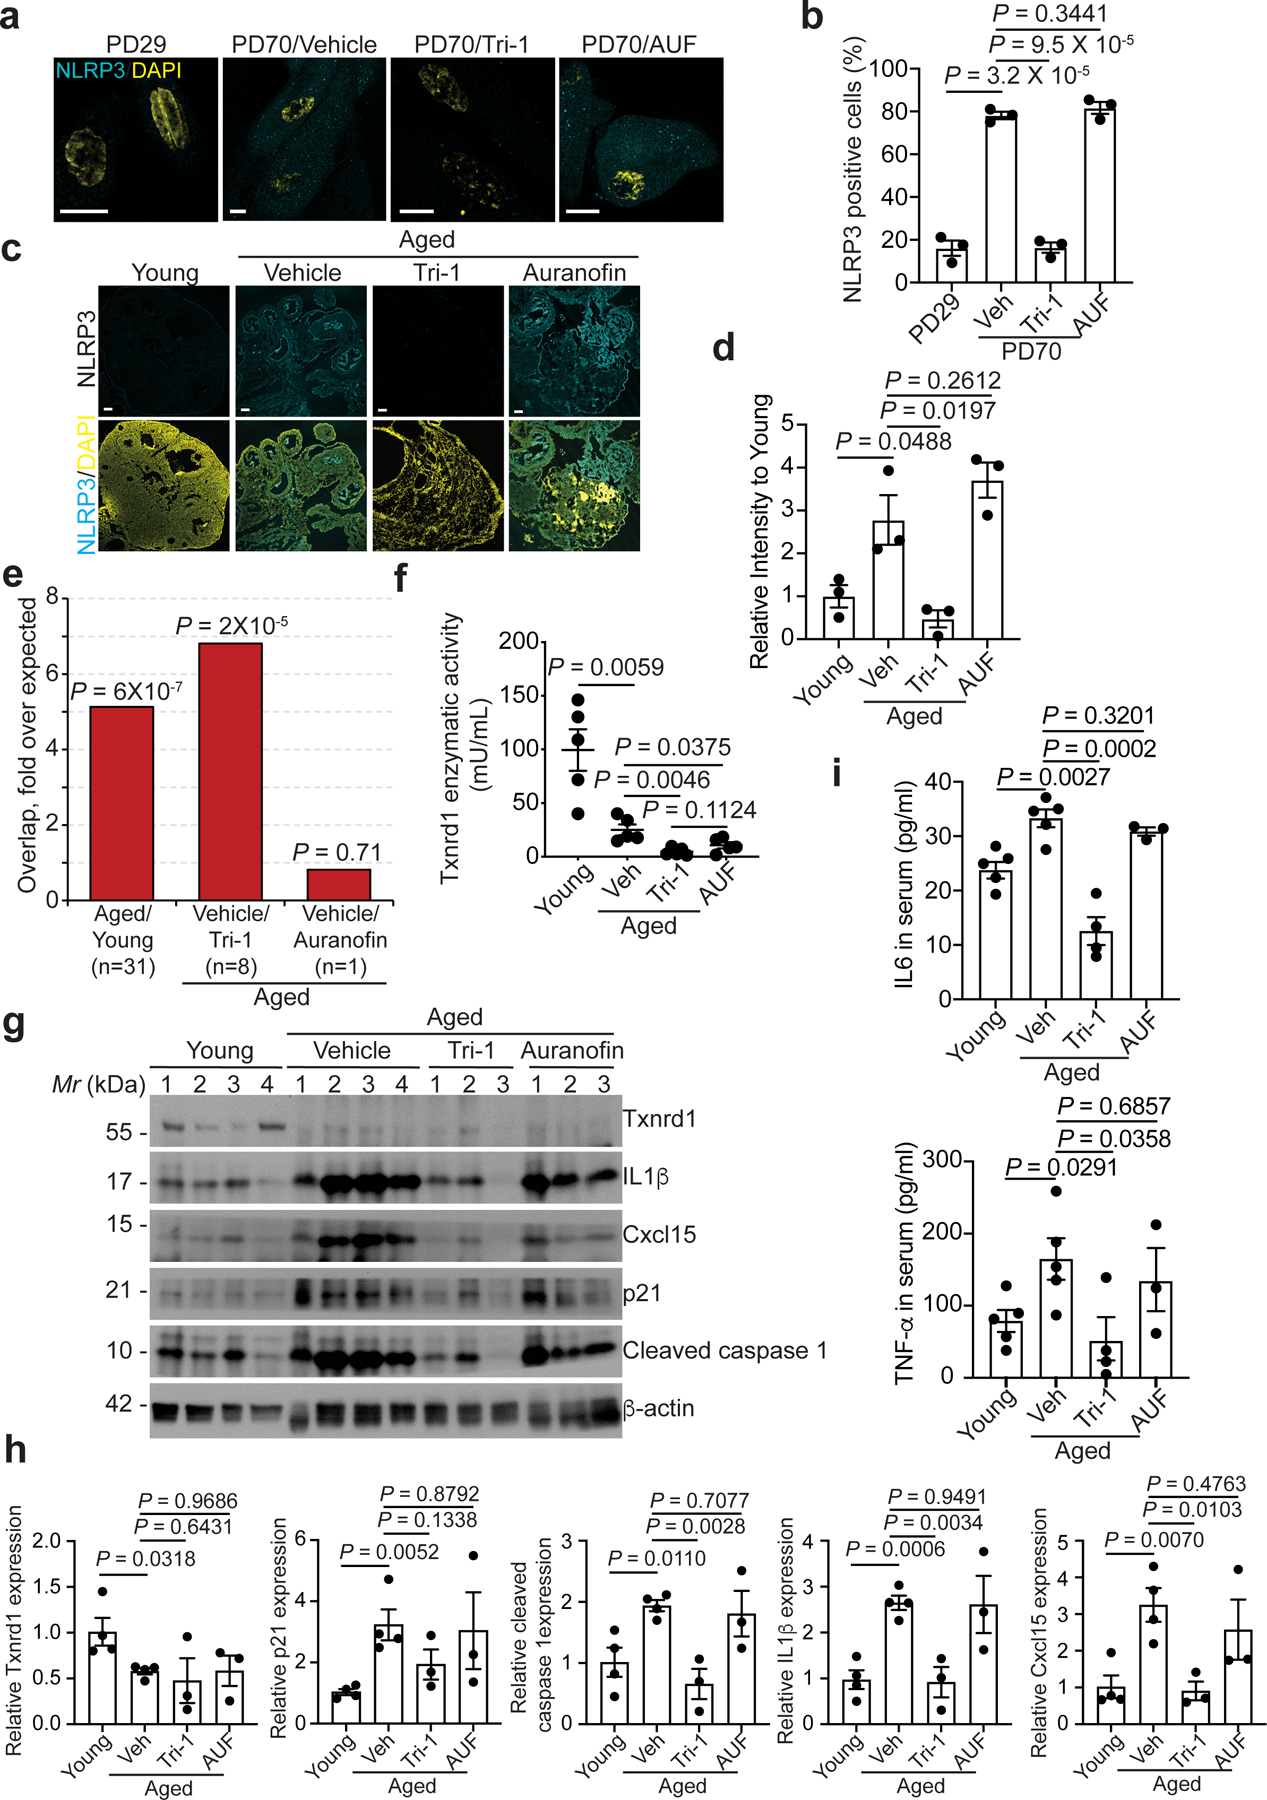
Sterile inflammation, also known as 'inflammaging', is a hallmark of tissue aging. Cellular senescence contributes to tissue aging, in part, through the secretion of proinflammatory factors collectively known as the senescence-associated secretory phenotype (SASP). The genetic variability of thioredoxin reductase 1 (TXNRD1) is associated with aging and age-associated phenotypes such as late-life survival, activity of daily living and physical performance in old age. TXNRD1's role in regulating tissue aging has been attributed to its enzymatic role in cellular redox regulation. Here, we show that TXNRD1 drives the SASP and inflammaging through the cyclic GMP-AMP synthase (cGAS)-stimulator of interferon genes (STING) innate immune response pathway independently of its enzymatic activity. TXNRD1 localizes to cytoplasmic chromatin fragments and interacts with cGAS in a senescence-status-dependent manner, which is necessary for the SASP. TXNRD1 enhances the enzymatic activity of cGAS. TXNRD1 is required for both the tumor-promoting and immune surveillance functions of senescent cells, which are mediated by the SASP in vivo in mouse models. Treatment of aged mice with a TXNRD1 inhibitor that disrupts its interaction with cGAS, but not with an inhibitor of its enzymatic activity alone, downregulated markers of inflammaging in several tissues. In summary, our results show that TXNRD1 promotes the SASP through the innate immune response, with implications for inflammaging. This suggests that the TXNRD1-cGAS interaction is a relevant target for selectively suppressing inflammaging.


Conflict of interest statement

Competing Interests Statement

The authors have no financial and non-financial competing interests.

Figures

Extended Data Figure 1:
Extended Data Figure 1:. Purification of CCFs from oncogene-induced senescent cells
a-c, IMR90 cells were induced into senesce by oncogenic H-RASG12V and were subjected to SA-β-gal staining (a). SA-β-gal positive cells were quantified in the indicated groups (b). Expression of the indicated proteins in the indicated control senescent cells was analyzed by immunoblot (c). Scale bar = 100 μm. d, Schematics of the protocol used for purification of CCFs. e, Intensity heatmap of the thioredoxin-related proteins enriched in CCFs. Sorted by number of the detected peptides with two independent biological repeats. Data represent mean ± s.e.m. n = 3 biologically independent experiments unless otherwise stated. P-values were calculated using a two-tailed t test.
Extended Data Figure 2:
Extended Data Figure 2:. TXNRD1 localizes into CCFs during senescence
a, Representative images of immunostaining for γH2AX and TXNRD1 in control and oncogenic RAS-induced senescent IMR90 cells. The arrow indicates an example of γH2AX and TXNRD1 positive CCFs in RAS-induced senescent cells. Scale bar = 10 μm b, Representative images of immunostaining for γH2AX, cGAS and TXNRD1 in young (PD26) and replicative senescent (PD72) IMR90 cells. The arrow indicates an example of γH2AX, cGAS and TXNRD1 positive CCFs in replicative senescent cells. Scale bar = 10 μm c, Quantification of (a) and (b). d,e, Representative images of immunostaining for γH2AX, cGAS and TXNRD1 in control and oncogenic RAS-induced senescent BJ human fibroblasts. The arrows indicate examples of γH2AX, cGAS and TXNRD1 positive CCFs in RAS-induced senescent cells (d). γH2AX-positive CCFs that are positive for TXNRD1 in senescent BJ cells were quantified (e). Scale bar = 10 μm Data represent mean ± s.e.m. n = 3 biologically independent experiments.
Extended Data Figure 3:
Extended Data Figure 3:. Inhibition of TXNRD1 doesn’t affect senescence-associated cell growth arrest
a, Immunoblot of the indicated proteins in oncogenic RAS-induced senescent IMR90 cells with or without TXNRD1 knockdown. b, γH2AX positive CCFs were quantified in oncogenic RAS-induced senescent IMR90 cells with or without TXNRD1 knockdown. n = 4 biologically independent experiments. c, Immunoblot of the indicated protein in control proliferating and oncogenic RAS-induced senescent IMR90 cells with or without TXNRD1 knockdown or treatment with a pharmacological TXNRD1 inhibitor Tri-1 (5 μM). d,e, Control and oncogenic RAS-induced senescent IMR90 cells with or without TXNRD1 knockdown or treatment with a pharmacological TXNRD1 inhibitor Tri-1 (5 μM) were subjected to SA-β-gal staining or colony formation assays (d). SA-β-gal positive cells were quantified in the indicated groups (e). Scale bar = 100 μm. n = 3 biologically independent experiments. Data represent mean ± s.e.m.
Extended Data Figure 4:
Extended Data Figure 4:. TXNRD1 is required for cGAS-STING activation during therapy-induced senescence.
a, Immunoblot of the indicated proteins in cisplatin-induced senescent PEO1 cells with or without TXNRD1 knockdown. b-d, Representative images of immunostaining for cGAS and γH2AX in cisplatin-induced senescent PEO1 cells with or without TXNRD1 knockdown or treatment with Tri-1 or vehicle control (b). White arrows indicate examples of cGAS and γH2AX positive CCFs in control cells, while the yellow arrows indicate examples of cGAS negative, γH2AX positive CCFs in TXNRD1 knockdown or Tri-1 treated cells. γH2AX-positive CCFs that are positive for cGAS from senescent PEO1 cells with or without TXNRD1 knockdown were quantified (c). γH2AX-positive CCFs that are positive for cGAS from senescent PEO1 cells with or without TXNRD1 inhibitor Tri-1 treatment were quantified (d). Scale bar = 10 μm. e,f, Immunoblot of the indicated protein in control and cisplatin-induced senescent PEO1 cells with or without TXNRD1 knockdown or treatment with a pharmacological TXNRD1 inhibitor Tri-1 (5 μM) (e). In addition, cellular 2’ 3’-cGAMP levels were measured in the indicated cells (f). Data represent mean ± s.e.m. n = 3 biologically independent experiments. P-values were calculated using a two-tailed t test.
Extended Data Figure 5:
Extended Data Figure 5:. TXNRD1 inhibition during senescence induction suppresses the SASP
a, Schematic of experimental design for determining the effects of TXNRD1 inhibition during induction of senescence in IMR90 cells. b, Heatmap of the SASP genes that were significantly suppressed by both TXNRD1 knockdown and Tri-1 treatment based on RNA-seq analysis. The relative expression levels per replicate and average fold change differences are shown (n = 3 biologically independent experiments). c,d, Expression of the indicated SASP genes in control and oncogenic RAS-induced senescent IMR90 cells with or without TXNRD1 knockdown (c) or Tri-1 treatment (d) was determined by RT-qPCR. n = 4 biologically independent experiments. e,f, Expression of the indicated proteins in oncogenic RAS-induced senescent IMR90 cells with or without TXNRD1 knockout was determined by immunoblot (e), and expression of the indicated SASP genes was determined by RT-qPCR (f). Data represent mean ± s.e.m. n = 3 biologically independent experiments unless otherwise stated. P-values were calculated using a two-tailed t test.
Extended Data Figure 6:
Extended Data Figure 6:. TXN knockdown does not affect cGAS localization and activity.
a-d, Expression of the indicated proteins in IMR90 cells induced to undergo senescence by oncogenic RAS expressing shControl or shTXN (a). The indicated cells were stained for γH2AX and cGAS. DAPI counter staining was used to visualized nuclei. Arrows point to examples of cGAS positive CCFs (b), which was quantified (c). Further, 2’3’-cGAMP levels in the indicated cells were quantified (d). Scale bar = 10 μm Data represent mean ± s.e.m. n = 3 biologically independent experiments.
Extended Data Figure 7:
Extended Data Figure 7:. TXNRD1 is required for SASP function in vivo.
a, TOV21G ovarian cancer cell growth in conditioned medium collected from control and senescent IMR90 cells with or without TXNRD1 knockdown or Tri-1 treatment. After 7 days of incubation, the cell numbers were determined and normalized to the numbers of the cells cultured in conditioned media collected from control proliferating IMR90 cells. Data represent mean ± s.e.m. n = 3 biologically independent experiments unless otherwise stated. P-values were calculated using a two-tailed t test. b,c, TOV21G and oncogene-induced senescent IMR90 cells with or without TXNRD1 inhibition were subcutaneously co-injected into the right dorsal flank of 6–8-week-old NSG female mice (n = 5 biologically independent mice per group). Shown are images of tumors dissected in the indicated groups at the end of experiments (b). Tumor growth in the indicated treatment groups was measured at the indicated time points (c). Data represent mean ± s.e.m. d, Validation of Txnrd1 knockdown by immunostaining in mouse NIH 3T3 cells. Arrows point to dsRed-expressing shRen control, shTxnrd1 #1 and shTxnrd1 #2. Scale bars = 10 μm. The experiment was repeated twice with similar results.
Extended Data Figure 8:
Extended Data Figure 8:. Tri-1 suppresses NLRP3 positivity in replicative senescent cells
a, b, Knockdown of Caspase 1 (a) and GSDMD (b) in senescent IMR90 cells was validated by RT-qPCR. n = 4 biologically independent experiments. c, Expression of IL1β in ER-RAS induced (by 4-OHT) senescent IMR90 cells with or without the knockdown of GSDMD or Caspase 1 was determined by RT-qPCR analysis. n = 3 biologically independent experiments. d,e, Representative images of immunostaining for NLRP3 in ER-RAS induced (by 4-OHT) senescent IMR90 cells with or without the indicated treatments (d). NLRP3 positive cells were quantified (e). n = 3 biologically independent experiments. Scale bars = 10 μm. f,g, Representative images of immunostaining for ASC to visualize inflammasome formation in the indicated control and ER-RAS induced (by 4-OHT) senescent IMR90 cells (f). ASC speck positive cells were quantified (g). n = 3 biologically independent experiments. Nigericin, a known inducer of inflammasome formation, was used as a positive control (10 μM for 4 hours). Scale bars = 10 μm. h, Expression of Txnrd1 in young (4 months) and aged mice (22 months) with or without Tri-1 treatment was determined by RT-qPCR analysis. n = 4 biologically independent mice per group. i,j, Immunoblot of the indicated proteins in the ovary tissues harvested from young (4 months) and aged mice (22 months) (i). The intensity of the indicated proteins was quantified by NIH ImageJ software and normalized against a loading control β-actin expression (j). n = 5 biologically independent mice per group. Data represent mean ± s.e.m. P-values were calculated using a two-tailed t test.
Extended Data Figure 9:
Extended Data Figure 9:. Tri-1 and auranofin do not affect p16 and p53 signatures in aged mouse ovaries.
a, Heatmap of the SASP genes that were significantly upregulated in ovaries from aged mice (22 months) compared with young mice (4 months) (n = 10 biologically independent mice in young group, n = 9 biologically independent mice in aged group). b, Heatmap of the SASP genes that were significantly suppressed by Tri-1 treatment in aged mouse ovaries (n = 4 biologically independent mice per group) c-e, Ingenuity Pathway Analysis of the 1920 genes that were significantly different in aged vs young mice ovaries. Common gene expression changes induced by Tri-1 and auranofin treatments showed expected common inhibition of GSR and TXNRD1 regulators (c). Transcription factors with altered activity were listed with p53 and p16 among them (d). P values were calculated by a Fisher Exact Test estimated by Ingenuity Pathway Analysis Software. Both these two age-associated signatures were not affected with either Tri-1 or auranofin treatment in the aged mice (e). P values were calculated by hypergeometrical test.
Extended Data Figure 10:
Extended Data Figure 10:. Suppression of SASP by Tri-1 treatment in aged mouse ovary.
a,b, Expression of the indicated SASP genes in ovaries from young (4 months) or aged (22 months) mice treated with Tri-1 or vehicle control was determined by RT-qPCR. n = 4 biologically independent mice per group. b,c, Immunoblot of the indicated proteins in the ovary tissues harvested from aged mice (22 months) with or without Tri-1 or auranofin treatments (b). The intensity of the indicated proteins was quantified by NIH ImageJ software and normalized against a loading control β-actin expression (c). n = 5 biologically independent mice per group. d, Expression of p16 in ovaries from young (4 months) or aged (22 months) mice treated with Tri-1 or vehicle control was determined by RT-qPCR. n = 4 biologically independent mice per group. Data represent mean ± s.e.m. P-values were calculated using a two-tailed t test.
Figure 1:
Figure 1:. TXNRD1 localizes into CCFs and is required for cGAS-STING activation during senescence.
a, The top 15 domains enriched by CCFs proteins isolated from oncogenic RAS-induced senescent IMR90 cells. Two green dots indicate thioredoxin-related domains. b, Immunoblot of the indicated proteins in CCFs isolated from oncogenic RAS-induced IMR90 cells. Proliferating cells having gone through the same purification procedure was used as a negative control. Whole cell lysate from etoposide induced senescent IMR90 cells was used as a positive control. c,d, Immunostaining of the indicated proteins in oncogenic RAS-induced senescent IMR90 cells (c). The arrow indicates an example of γH2AX, cGAS and TXNRD1 co-localized CCFs. CCFs that are positive for γH2AX and also positive for TXNRD1 were quantified (d). Scale bar = 10 μm. e, Immunoblot of the indicated proteins in control proliferating and oncogenic RAS-induced senescent cells IMR90 cells harvested at the indicated time points. f,g, Immunostaining for cGAS and γH2AX in oncogenic RAS-induced senescent IMR90 cells with or without TXNRD1 knockdown (f). White arrow indicates an example of cGAS and γH2AX positive CCFs in control cells, while the yellow arrow indicates an example of cGAS negative, γH2AX positive CCFs in TXNRD1 knockdown cells. γH2AX-positive CCFs that are positive for cGAS from the indicated groups were quantified (g). Scale bar = 10 μm. h,i, Immunoblot of the indicated protein in control proliferating and oncogenic RAS-induced senescent IMR90 cells with or without TXNRD1 knockdown or treatment with a pharmacological TXNRD1 inhibitor Tri-1 (5 μM) (h). In addition, cellular 2’ 3’-cGAMP levels were measured in the indicated cells (i). j,k, Immunostaining for cGAS and γH2AX in oncogenic RAS-induced senescent IMR90 cells treated with vehicle control or TXNRD1 inhibitor Tri-1 (5 μM) (j). White arrow indicates an example of cGAS and γH2AX positive CCFs in control cells, while the yellow arrow indicates an example of cGAS negative, γH2AX positive CCFs in Tri-1 treated cells. γH2AX-positive CCFs that are positive for cGAS from the indicated groups were quantified (k). Scale bar = 10 μm. Data represent mean ± s.e.m. n = 3 biologically independent experiments unless otherwise stated. P-values were calculated using a two-tailed t test.
Figure 2:
Figure 2:. TXNRD1 regulates SASP independently of its enzymatic activity.
a, Enrichment of the SASP genes among genes that were significantly downregulated by both TXNRD1 knockdown and TXNRD1 inhibitor Tri-1 treatment in oncogenic RAS-induced senescent IMR90 cells determined by RNA-seq analysis. b, Schematic of experimental design for determining the effects of TXNRD1 inhibition in fully established senescent IMR90 cells. c, The secretion of soluble factors under the indicated conditions were detected by antibody arrays. The heatmap indicates the fold change (FC) in comparison to the control or RAS-induced senescent condition. The relative expression levels per replicate and average fold change differences are shown (n = 4 biologically independent experiments). d, Co-immunoprecipitation analysis of TXNRD1 and cGAS was performed in control proliferating and oncogenic RAS-induced senescent IMR90 cells with or without the indicated TXNRD1 inhibitors treatments. e, GST pull-down assay using purified His-cGAS and GST-TXNRD1 with or without Tri-1 or auranofin in the reaction. GST was used a negative control. f-k, Immunoblot of the indicated proteins in ER-RAS inducible IMR90 cells (by 4-OHT treatment) with or without endogenous TXNRD1 knockout, and rescued by ectopic expression of FLAG-tagged wild-type or C59S/C54S mutant TXNRD1 (f). And thioredoxin reductase activity was measured in the indicated cells (g). Images of immunostaining for FLAG and cGAS in the indicated cells (h). White arrows indicate examples of cGAS positive CCFs, while yellow arrows indicate examples of cGAS negative CCFs. Notably, both wildtype and C59S/C54S mutant TXNRD1 localize into CCFs as determined by FLAG staining. cGAS-positive CCFs from the indicated groups were quantified (i). 2’ 3’-cGAMP levels in the indicated cells were measured (j). Expression of the indicated SASP genes was determined by qRT-PCR in the indicated cells (k). Scale bars = 10 μm. l, Electrophoretic mobility shift analysis of cGAS binding to dsDNA with the indicated treatments. m, 2’ 3’-cGAMP production in the indicated groups was measured by ELISA. n = 4 biologically independent experiments. Data represent mean ± s.e.m. n = 3 biologically independent experiments unless otherwise stated. P-values were calculated using a two-tailed t test.
Figure 3:
Figure 3:. TXNRD1 is required for the pro-tumorigenic and immune surveillance function of the SASP.
a, Tumor growth stimulated by co-injected senescent IMR90 fibroblasts in a xenograft mouse model was inhibited by TXNRD1 knockdown or Tri-1 treatment. TOV21G cells were subcutaneously injected with the indicated senescent IMR90 cells into NSG female mice. The tumor weight was measured at the end of the experiment (n = 5 biologically independent mice per group). b,c, Schematic of the experimental design (b) and the transposon-based constructs (c) for hydrodynamic tail vein injection mouse model. d,e, Immunostaining for Txnrd1 and NRas in mouse livers in the hydrodynamic tail vein injection model. DAPI counter staining was used to visualize the nuclei. The arrows indicate examples of Txnrd1 positive CCFs in NRas-expressing hepatocytes (d). Percentages of CCFs positive for Txnrd1 were quantified from 4 biologically independent mice (e). Scale bars = 10 μm. f-h, Immunostaining for cGAS and NRas in mouse livers from indicated groups. DAPI counter staining was used to visualize the nuclei. The white arrow indicates an example of a cGAS positive CCFs, while yellow arrows indicate examples of cGAS negative CCF in NRas-expressing hepatocytes (f). Percentages of CCFs positive for cGAS (g) and percentages of NRas-expressing cells positive for CCFs (h) were quantified from 4 biologically independent mice. Scale bars = 10 μm. i,j, Images of SA-β-gal staining of the liver tissues from the indicated groups at day 6 and 14 post injection (i), and the number of SA-β-gal-positive cells in the indicated groups was quantified (j). n = 6 biologically independent mice per group. Scale bars = 100 μm. k-m, Images of immunohistochemical staining for NRas and CD45 expression in each of the indicated groups at the indicated time points. Magnified views of the region in the black square are shown (k). Comparison of the NRas-positive cells at day 6 and the remaining NRas-positive cells at day 14 indicated immune clearance (l). Number of clusters of immune cells at day 6 was quantified in the indicated groups(m). n = 6 biologically independent mice per group. Scale bars = 50 μm. Data represent mean ± s.e.m. P-values were calculated using a two-tailed t test.
Figure 4:
Figure 4:. Pharmacological intervention of TXNRD1-cGAS interaction suppresses age-associated inflammation.
a,b, Images of immunostaining for NLRP3 in young (PD29) and replicative senescent (PD70) IMR90 cells (a). The number of cells positive for NLRP3 staining was quantified (b). n = 3 biologically independent experiments. Scale bars = 10 μm. c,d, Images of immunostaining for NLRP3 in the ovary tissues from young (4 months) and aged mice (22 months) with or without Tri-1 and auranofin treatments (c). The intensity of NLRP3 staining in the indicated groups was quantified using NIS elements Ar software (d). n = 3 biologically independent mice per group. Scale bars = 100 μm. e, Genes that were significantly upregulated in ovary tissues from aged mice compared with young mice are enriched for the SASP genes. In addition, genes that were significantly suppressed by Tri-1, but not auranofin, treatment in ovary tissues from aged mice are enriched for the SASP genes. n indicates number of SASP genes changed in the indicated conditions. f, Inhibition of the Txnrd enzymatic activity by Tri-1 and auranofin in the ovary tissues of aged mice (22 months). n = 5 biologically independent mice per group. g,h, Immunoblot of the indicated proteins in the ovary tissues harvested from young mice (4 months), and aged mice (22 months) with or without Tri-1 or auranofin treatments (h). The intensity of the indicated proteins was quantified by NIH ImageJ software and normalized against a loading control β-actin expression (i). n = 4 biologically independent mice per group in young and aged control groups, n = 3 biologically independent mice per group in treated aged groups. i, Serum levels of IL6 and TNF-α from the indicated young (4 months) or aged mice (22 months) treated with or without Tri-1 or auranofin were determined by ELISA. n=5 young, 5 aged/veh, 4 aged/Tri-1, and 3 aged/AUF biologically independent mice. Data represent mean ± s.e.m. P-values were calculated using a two-tailed t test.

References

    1. Munoz-Espin D & Serrano M Cellular senescence: from physiology to pathology. Nat Rev Mol Cell Biol 15, 482–496 (2014). 10.1038/nrm3823 - DOI - PubMed
    1. Hao X, Wang C & Zhang R Chromatin basis of the senescence-associated secretory phenotype. Trends Cell Biol (2022). 10.1016/j.tcb.2021.12.003 - DOI - PMC - PubMed
    1. Dou Z et al. Cytoplasmic chromatin triggers inflammation in senescence and cancer. Nature 550, 402–406 (2017). 10.1038/nature24050 - DOI - PMC - PubMed
    1. Gluck S et al. Innate immune sensing of cytosolic chromatin fragments through cGAS promotes senescence. Nat Cell Biol 19, 1061–1070 (2017). 10.1038/ncb3586 - DOI - PMC - PubMed
    1. Yang H, Wang H, Ren J, Chen Q & Chen ZJ cGAS is essential for cellular senescence. Proc Natl Acad Sci U S A 114, E4612–E4620 (2017). 10.1073/pnas.1705499114 - DOI - PMC - PubMed

LinkOut - more resources