. 2024 Mar;4(3):336-349.
doi: 10.1038/s43587-023-00560-5. Epub 2024 Jan 24.

Prophylactic and long-lasting efficacy of senolytic CAR T cells against age-related metabolic dysfunction

Affiliations

Prophylactic and long-lasting efficacy of senolytic CAR T cells against age-related metabolic dysfunction

Corina Amor et al. Nat Aging. 2024 Mar.

Abstract

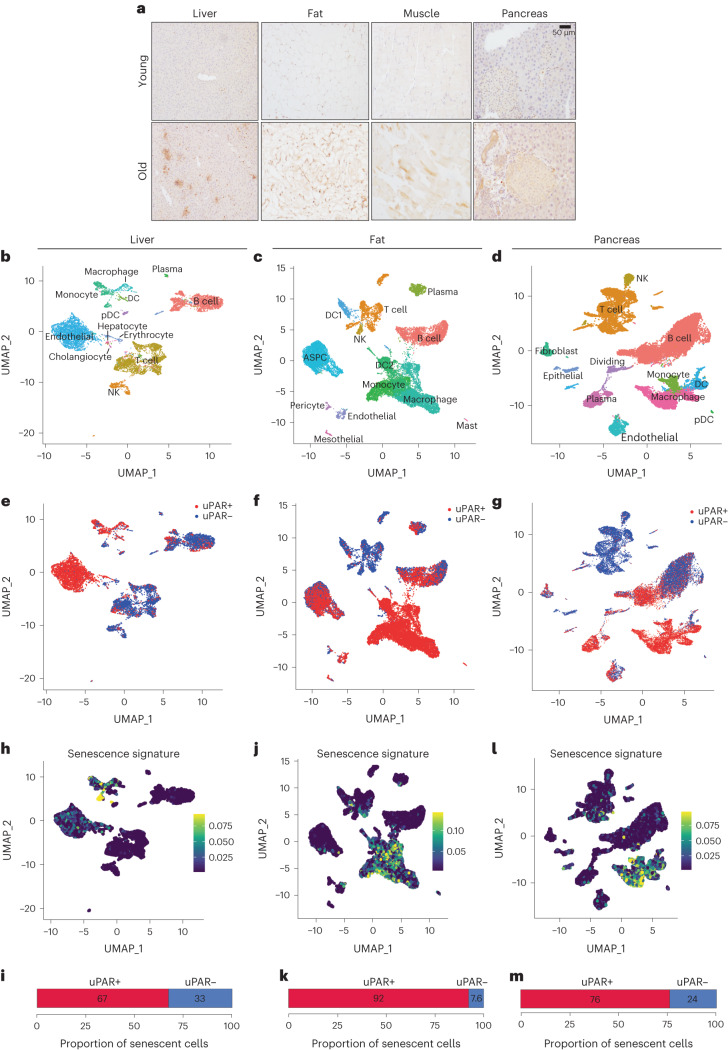
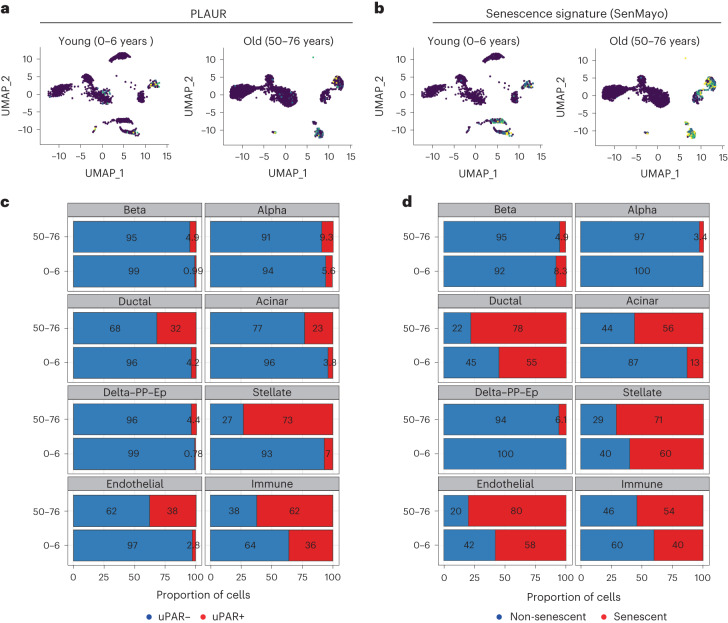
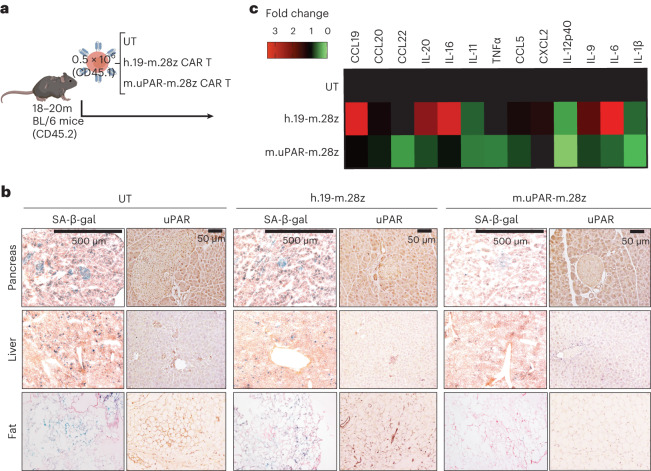
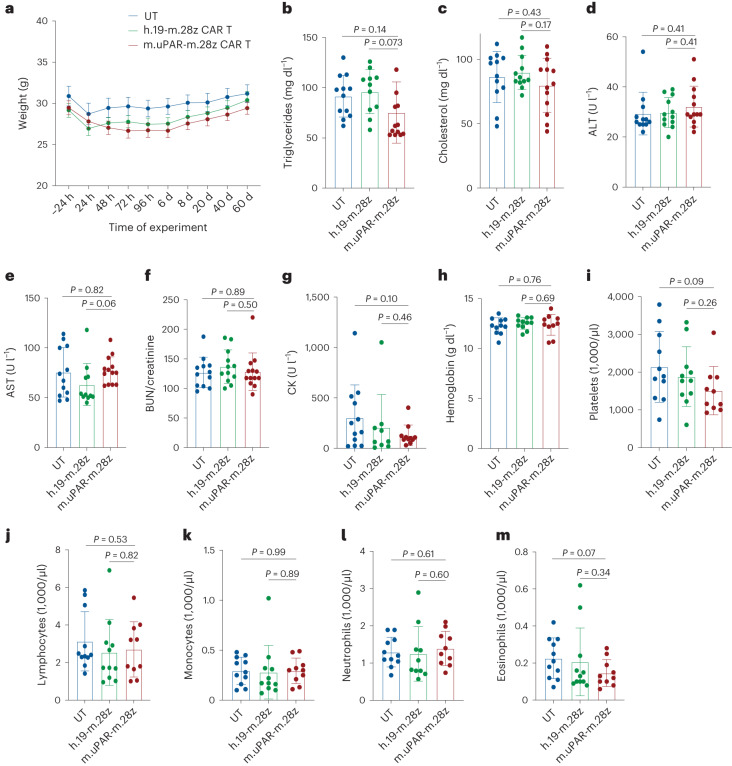
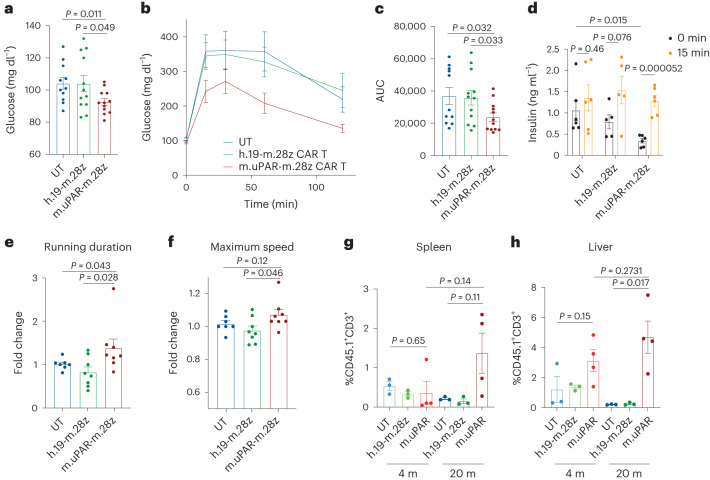
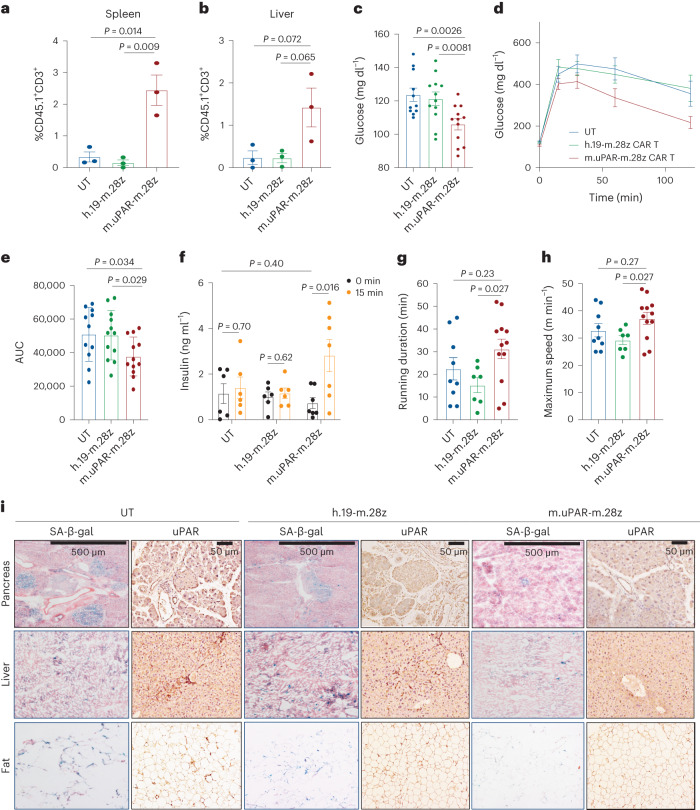
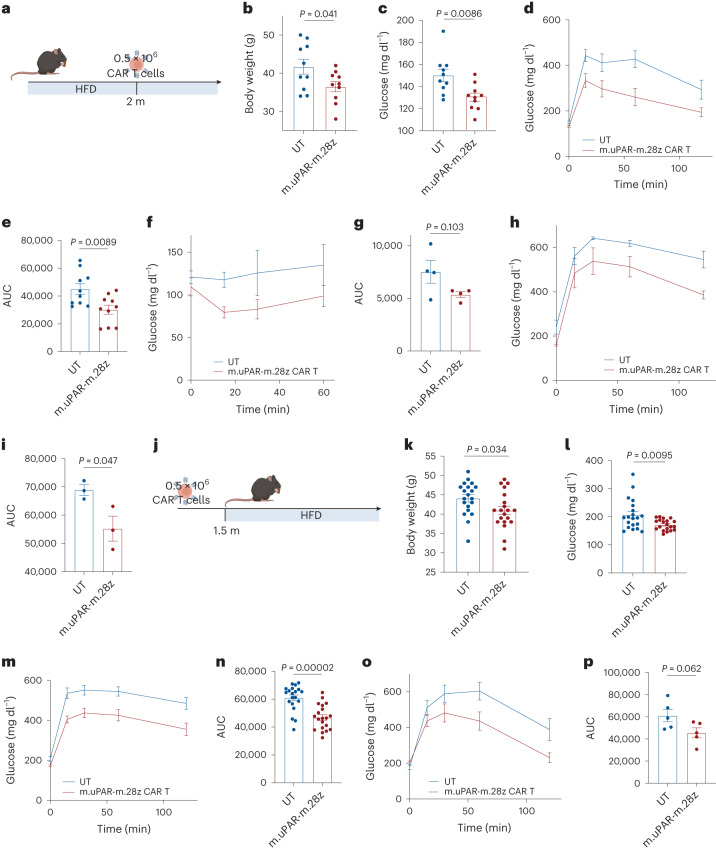
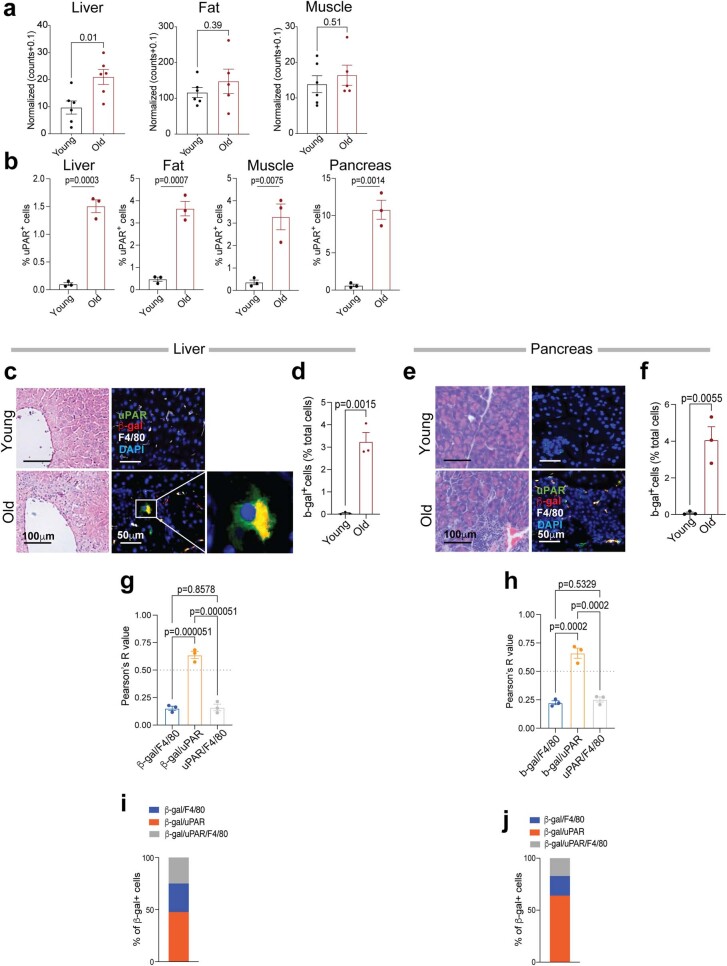
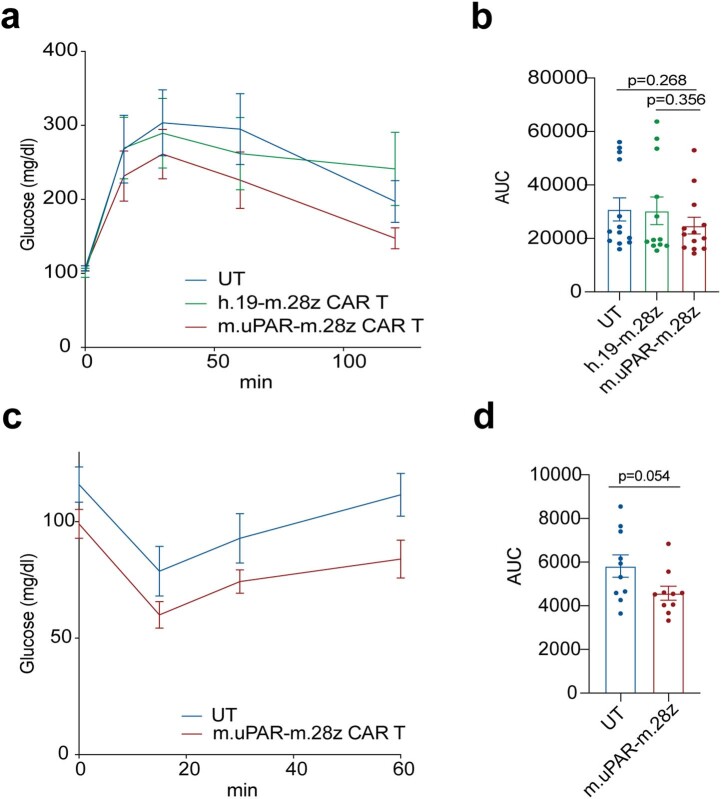
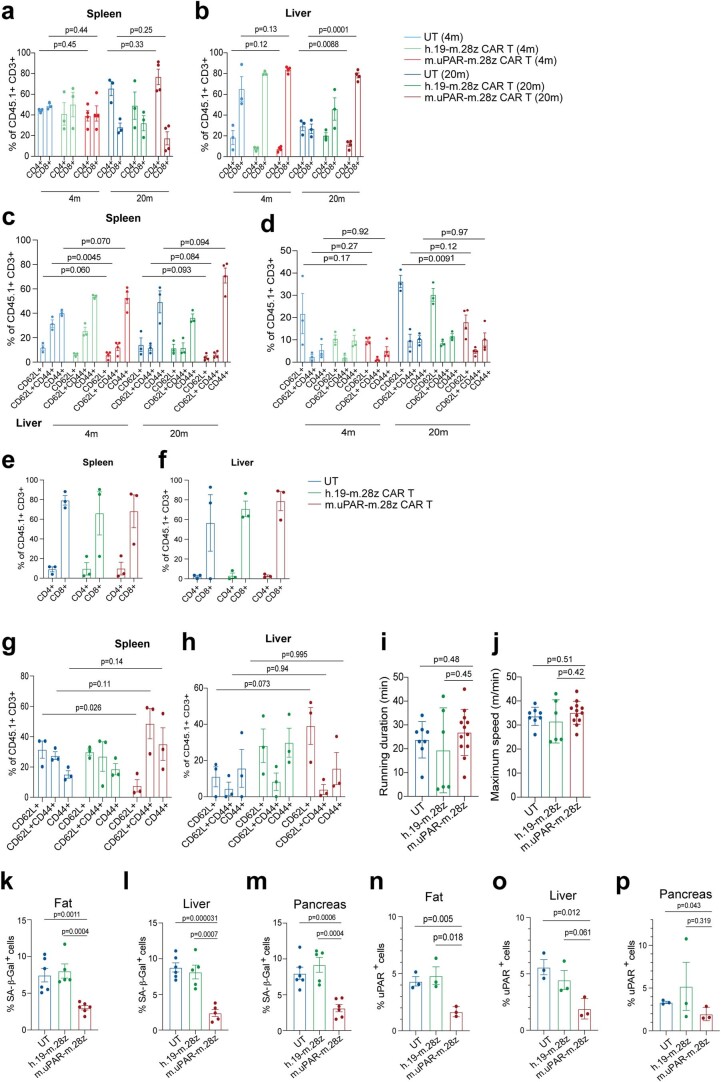
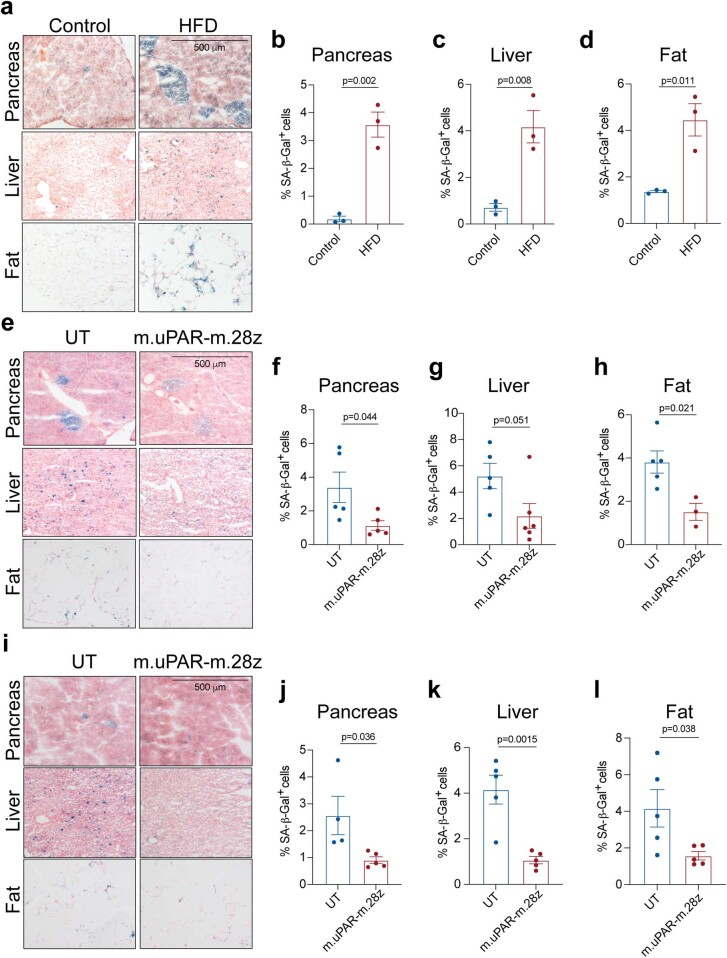
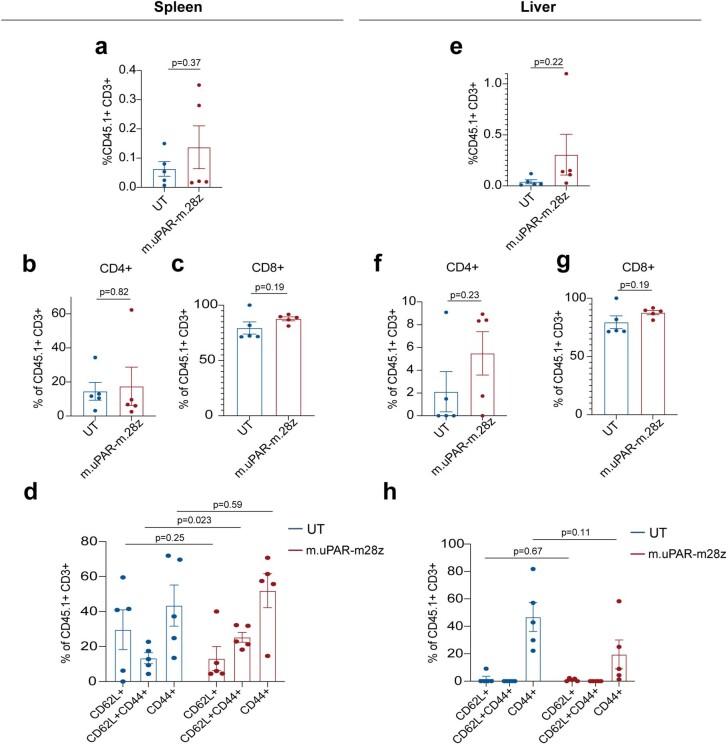
Senescent cells, which accumulate in organisms over time, contribute to age-related tissue decline. Genetic ablation of senescent cells can ameliorate various age-related pathologies, including metabolic dysfunction and decreased physical fitness. While small-molecule drugs that eliminate senescent cells ('senolytics') partially replicate these phenotypes, they require continuous administration. We have developed a senolytic therapy based on chimeric antigen receptor (CAR) T cells targeting the senescence-associated protein urokinase plasminogen activator receptor (uPAR), and we previously showed these can safely eliminate senescent cells in young animals. We now show that uPAR-positive senescent cells accumulate during aging and that they can be safely targeted with senolytic CAR T cells. Treatment with anti-uPAR CAR T cells improves exercise capacity in physiological aging, and it ameliorates metabolic dysfunction (for example, improving glucose tolerance) in aged mice and in mice on a high-fat diet. Importantly, a single administration of these senolytic CAR T cells is sufficient to achieve long-term therapeutic and preventive effects.


Conflict of interest statement

C.A., J.F., M.S. and S.W.L. are listed as the inventors of several patent applications (62/800,188; 63/174,277; 63/209,941; 63/209,940; 63/209,915; 63/209,924; 17/426,728; 3,128,368; 20748891.7; 2020216486) related to senolytic CAR T cells. M.S. holds other unrelated patents on CAR technologies. C.A. is also an inventor in the patent application 63/510,997. C.A., M.S. and S.W.L. are advisors for Fate Therapeutics. M.S. also receives research support from Fate Therapeutics, is an advisor and has equity in Senecea Therapeutics, and holds other unrelated patents on CAR technologies. S.W.L. is on the scientific advisory board and has equity in ORIC Pharmaceuticals, Blueprint Medicines, Mirimus, Senecea Therapeutics, Faeth Therapeutics and PMV Pharmaceuticals. D.A.T. is a scientific cofounder and scientific advisory board of Mestag Therapeutics and is a member of the Scientific Advisory Board and receives stock options from Leap Therapeutics, Dunad Therapeutics, Cygnal Therapeutics and Mestag Therapeutics outside the submitted work. D.A.T. has received unrelated research grant support from Fibrogen, Mestag and ONO Therapeutics. None of these activities are related to the current publication. R.L.L. is on the supervisory board of Qiagen and is a scientific advisor to Imago, Mission Bio, Zentalis, Ajax, Auron, Prelude, C4 Therapeutics and Isoplexis. R.L.L. receives research support from Ajax, Zentalis and Abbvie and has consulted for Incyte, Janssen and AstraZeneca and has received honoraria from AstraZeneca for invited lectures. L.W.J. owns stock in Pacyclex and Illuminosonics. The other authors declare no competing interests.

Figures

Fig. 1
Fig. 1. uPAR is upregulated on senescent cells in physiological aging.
a, Immunohistochemical staining of mouse uPAR in liver, adipose tissue, muscle and pancreas from young (age 3 months) or old (age 20 months) mice (n = 3 per age). bm, Single-cell analysis of uPAR expression and senescence. uPAR-positive and uPAR-negative cells were sorted from the liver, adipose tissue and pancreas of 20-month-old mice and subjected to single-cell RNA-seq by 10x chromium protocol (n = the sequencing of four mice where two females were combined into one replicate and two males were combined into another replicate). b, Uniform manifold approximation and projection (UMAP) visualization of liver cell types. c, UMAP visualization of adipose tissue cell types. d, UMAP visualization of pancreas cell types. e, UMAP visualization of hepatic uPAR-negative and uPAR-positive cell types. f, UMAP visualization of adipose uPAR-negative and uPAR-positive cell types. g, UMAP visualization of pancreatic uPAR-negative and uPAR-positive cell types. h,j,l, UMAP visualizations with senescence signature scores in each cell indicated by the color scale. i,k,m, Quantification of the proportion of uPAR-positive and uPAR-negative cells contributing to the respective senescence signature. h,i, Liver; j,k, adipose tissue; l,m, pancreas. Results are from one independent experiment (am). DC, dendritic cell; NK, natural killer; pDC, plasmacytoid dendritic cell; ASPC, adipose progenitor and stem cells.
Fig. 2
Fig. 2. Upregulation of uPAR and senescence signatures in aged human pancreas.
scRNA-seq data of human pancreas of different ages from ref. were analyzed. a, UMAP visualization of Plaur expression across pancreas cell types in young humans (0–6 years old) and old humans (50–76 years old). b, UMAP visualization of senescence signature expression across pancreas cell types in young humans (0–6 years old) and old humans (50–76 years old). c, Quantification of the proportion of uPAR-positive and uPAR-negative cells by cell type and age. d, Quantification of the proportion of cells expressing senescence signature or not expressing senescence signature by cell type and age.
Fig. 3
Fig. 3. uPAR CAR T cells eliminate senescent cells in old mice.
a, Experimental scheme for Figs. 3–5. C57BL/6N mice (18 to 20 months old) were injected with 0.5 × 106 m.uPAR-m.28z CAR T cells, h.19-m.28z CAR T cells or UT cells generated from CD45.1 mice 16 h after administration of cyclophosphamide (200 mg per kg body weight). Mice were harvested 20 d later and/or monitored over time. Schematic created with BioRender.com. b, Representative SA-β-gal and uPAR staining 20 d after cell infusion. c, Heat map depicting fold change in the levels of SASP cytokines compared to UT-treated mice (n = 3 for UT cells; n = 3 for h.19-m.28z; n = 4 for m.uPAR-m.28z). Results are from one experiment (b and c). Source data
Fig. 4
Fig. 4. Safety of uPAR CAR T cells in aged mice.
Mice were treated with m.uPAR-m.28z CAR T cells, h.19-m.28z CAR T cells or UT cells as schematized in Fig. 3a. a, Body weight 24 h before and at various times after cell infusion (n = 12 mice for UT; n = 11 for h.19-m.28z; n = 12 for m.uPAR-m.28z). b, Triglyceride levels 20 d after cell infusion (n = 12 mice for UT; n = 11 for h.19-m.28z; n = 13 for m.uPAR-m.28z). c, Cholesterol levels 20 d after cell infusion (n = 12 for UT and for h.19-m.28z; n = 13 for m.uPAR-m.28z). d, Alanine transaminase (ALT) levels 20 d after cell infusion (sample sizes as in c). e, Aspartate aminotransferase (AST) levels 20 d after cell infusion (n = 12 for UT; n = 11 for h.19-m.28z; n = 13 for m.uPAR-m.28z). f, BUN/creatinine ratio 20 d after cell infusion (sample sizes as in c). g, Creatine kinase (CK) 20 d after cell infusion (n = 12 for UT; n = 9 for h.19-m.28z; n = 11 for m.uPAR-m.28z). h, Hemoglobin levels 20 d after cell infusion (n = 11 for UT; n = 11 for h.19-m.28z; n = 10 for m.uPAR-m.28z). i, Platelet numbers 20 d after cell infusion (n = 11 for UT; n = 11 for h.19-m.28z; n = 10 for m.uPAR-m.28z). j, Lymphocyte numbers 20 d after cell infusion (n = 11 for UT; n = 11 for h.19-m.28z; n = 10 for m.uPAR-m.28z). k, Monocyte numbers 20 d after cell infusion (n = 11 for UT; n = 11 for h.19-m.28z; n = 10 for m.uPAR-m.28z). l, Neutrophil numbers 20 d after cell infusion (n = 11 for UT; n = 10 for h.19-m.28z; n = 10 for m.uPAR-m.28z). m, Eosinophil numbers 20 d after cell infusion (n = 11 for UT; n = 11 for h.19-m.28z; n = 10 for m.uPAR-m.28z). Results are from two independent experiments. Data are the mean ± s.e.m.; P values from two-tailed unpaired Student’s t-test (bm). Source data
Fig. 5
Fig. 5. uPAR CAR T cells revert natural age-associated phenotypes.
Mice were treated with m.uPAR-m.28z CAR T cells, h.19-m.28z CAR T cells or UT cells as schematized in Fig. 3a. a, Levels of basal glucose (mg ml−1) after starvation 2.5 months after cell infusion (n = 11 mice for UT; n = 12 for h.19-m.28z and for m.uPAR-m.28z). b, Levels of glucose before (0 min) and after intraperitoneal administration of glucose (2 g per kg body weight) 2.5 months after cell infusion (samples sizes as in a). c, Area under the curve (AUC) representing the results from b. Each point represents a single mouse. d, Levels of insulin before and 15 min after intraperitoneal glucose administration (2 g per kg body weight) 2.5 months after cell infusion (n = 6 for UT; n = 5 for h.19-m.28z; n = 6 for m.uPAR-m.28z). e, Fold change in time to exhaustion in exercise capacity testing before cell infusion and 2.5 months after it (n = 7 for UT; n = 8 for h.19-m.28z and n = 8 for m.uPAR-m.28z). f, Fold change in maximum speed in capacity testing before cell infusion and 2.5 months after it (sample sizes as in e). g,h, Percentage of CD45.1+ T cells in the spleen (g) or liver (h) of 4-month-old or 20-month-old mice 20 d after cell infusion (n = 3 mice per age group for UT and for h.19-m.28z; n = 4 for m.uPAR-m.28z). The corresponding flow cytometry gating is shown in Extended Data Fig. 10. Results are from two independent experiments (ac, e and f) or one experiment (d, g and h). Data are the mean ± s.e.m.; P values from two-tailed unpaired Student’s t-test (a, c, d, g and h) or two-tailed Mann–Whitney test (e and f). Source data
Fig. 6
Fig. 6. uPAR CAR T cells prevent natural age-associated phenotypes.
Three- to four-month-old C57BL/6N mice were injected with 0.5 × 106 m.uPAR-m.28z CAR T cells, h.19-m.28z CAR T cells or UT cells generated from CD45.1 mice 16 h after administration of cyclophosphamide (200 mg per kg body weight). Mice were monitored over time and/or harvested at 15 months of age. a,b, Percentage of CD45.1+ T cells in the spleen (a) or liver (b) of 15-month-old mice 12 months after cell infusion (n = 3 mice per group). c, Levels of basal glucose after starvation 15–18 months after cell infusion (n = 11 mice for UT cells; n = 12 for h.19-m.28z and for m.uPAR-m.28z). d, Levels of glucose before (0 min) and after intraperitoneal administration of glucose (2 g per kg body weight) 15–18 months after cell infusion (sample sizes as in c). e, AUC representing the results from d. Each point represents a single mouse. f, Levels of insulin (ng ml−1) before and 15 min after intraperitoneal glucose (2 g per kg body weight) 15 months after cell infusion (n = 6 for UT cells; n = 6 for h.19-m.28z; n = 7 for m.uPAR-m.28z). g, Time to exhaustion in exercise capacity testing 6 months after cell infusion (n = 9 for UT cells; n = 7 for h.19-m.28z; n = 12 for m.uPAR-m.28z). h, Maximum speed (m min−1) in capacity testing 6 months after cell infusion (sample sizes as in g). i, Representative staining of SA-β-gal and uPAR 15 months after cell infusion. Results are from one independent experiment (a, b, f and i) or two independent experiments (ce, g and h). Data are the mean ± s.e.m.; P values from two-tailed unpaired Student’s t-test (ac, e and f) or two-tailed Mann–Whitney test (g and h). Source data
Fig. 7
Fig. 7. uPAR CAR T cells are therapeutic and preventive in metabolic syndrome.
a, Experimental scheme for bi. Three-month-old C57BL/6N mice were treated with an HFD for 2 months followed by intravenous infusion with 0.5 × 106 m.uPAR-m.28z or UT cells 16 h after administration of cyclophosphamide (200 mg per kg body weight). Mice were euthanized 1 month later or monitored over time. b, Body weight 1 month after cell infusion (n = 10 mice per group). c, Basal glucose levels after starvation at 1 month after cell infusion (n = 10 mice per group). d, Glucose levels before (0 min) and after intraperitoneal administration of glucose (1 g per kg body weight) 1 month after cell infusion (n = 10 mice per group). e, AUC representing the results from d. f, Glucose levels before (0 min) and after intraperitoneal administration of insulin (0.5 units per kg body weight) 1 month after cell infusion (n = 4 mice per group). g, AUC representing the results from f. Each point represents a single mouse. h, Glucose levels before (0 min) and after intraperitoneal glucose administration (1 g per kg body weight) 2.5 months after cell infusion (n = 3 mice per group). i, AUC representing the results from h. Each point represents a single mouse. j, Experimental scheme for kp. Three-month-old C57BL/6N mice were intravenously infused with 0.5 × 106 m.uPAR-m.28z or UT cells 16 h after administration of cyclophosphamide (200 mg per kg body weight). At 1.5 months after infusion, mice were placed on an HFD, then euthanized 2 months later or monitored over time. k, Body weight at 3.5 months after cell infusion (n = 20 mice per group). l, Basal glucose levels after starvation 3.5 months after cell infusion (n = 20 mice per group). m, Levels of glucose before (0 min) and after intraperitoneal administration of glucose (1 g per kg body weight) 1 month after cell infusion (n = 20 mice per group). n, AUC representing the results from m. o, Glucose levels before (0 min) and after intraperitoneal glucose administration (1 g per kg body weight) 5.5 months after cell infusion (n = 5 mice per group). p, AUC representing the results from o. Each point represents a single mouse (ap). Results are from two independent experiments (be and kn) or one independent experiment (fi, o and p). Data are the mean ± s.e.m.; P values derived from two-tailed unpaired Student’s t-test (b, c, e, g, i, k, l, n and p). Schematics were created with BioRender.com. Source data
Extended Data Fig. 1
Extended Data Fig. 1. Characterization of uPAR-positive cells in aging.
a, RNA expression of Plaur in liver, adipose tissue (fat) and muscle of young (3 months) or old (21 months) mice. Data obtained from the Tabula Muris Senis project. b, Quantification of immunohistochemical staining of mouse uPAR in liver, adipose tissue, muscle and pancreas from young (age 3 months) or old (age 20 months) mice (n = 3 per age). c, Hematoxylin and eosin staining and immunofluorescence staining of young (age 3 months n = 3 mice) or old (age 18–20 months n = 3 mice) livers. uPAR (green), β-gal (red), F4/80 (white), DAPI (blue). d, Percentage of SA-b-gal positive cells in young and aged livers in c. e, Hematoxylin and eosin staining and immunofluorescence staining of young (age 3 months n = 3 mice) or old (age 18–20 months n = 3 mice) pancreas. uPAR (green), β-gal (red), F4/80 (white), DAPI (blue). f, Percentage of SA-b-gal positive cells in young and aged livers in e. g,h, Correlation (Pearson’s R value) of β-gal and F4/80 co-staining, β-gal and uPAR co-staining or uPAR and F4/80 co-staining in aged livers (g) and aged pancreas (h). i,j, Percentage of β-gal positive cells that costain for F4/80, uPAR or uPAR and F4/80 in aged livers (i) and aged pancreas (j). Data are mean ± s.e.m (a,b,d,f-h); values are derived from two-tailed unpaired Student’s t-tests (a,b,d,f) one-way ANOVA with multiple comparisons (g,h). Results are from 1 independent experiment (a-j). Source data
Extended Data Fig. 2
Extended Data Fig. 2. Single cell profile of aged tissues.
a, Dot plot showing expression of 34 signature genes across the 12 lineages of the liver. The size of the dots represents the proportion of cells expressing a particular marker, and the color scale indicates the mean expression levels of the markers (z-score transformed). b, Fractions of uPAR-positive and uPAR-negative cells in the various lineages in liver (n= the sequencing of 4 mice where 2 females were combined into one replicate and 2 males were combined into another replicate). Error bars represent s.d. c, Dot plot showing expression of 40 signature gene expressions across the 13 lineages of the adipose tissue. The size of the dots represents the proportion of cells expressing a particular marker, and the color scale indicates the mean expression levels of the markers (z-score transformed). d, Fractions of uPAR-positive and uPAR-negative cells in the various lineages in adipose tissue (n= the sequencing of 4 mice where 2 females were combined into one replicate and 2 males were combined into another replicate). Error bars represent s.d. e, Dot plot showing expression of 40 genes across the 12 lineages of the pancreas. The size of the dots represents the proportion of cells expressing a particular marker, and the color scale indicates the mean expression levels of the markers (z-score transformed). f, Fractions of uPAR-positive and uPAR-negative cells in the various lineages in pancreas (n= the sequencing of 4 mice where 2 females were combined into one replicate and 2 males were combined into another replicate). Error bars represent s.d. Data are mean ± s.d.; p values are derived from two-tailed unpaired Student’s t-tests (b,d,f). Results are from 1 independent experiment (a-f).
Extended Data Fig. 3
Extended Data Fig. 3. Characteristics of senescent uPAR-positive cells in aged tissues.
a-c, Molecular Signature Database Hallmark 2020 signatures that are significantly enriched in uPAR positive cells vs uPAR negative cells of liver (a), adipose tissue (b) and pancreas (c). d-f, quantification of the proportion of uPAR positive and negative cells by cell type contributing to the respective senescence signature in Fig. 1h(d), Fig. 1j(e) and Fig. 1l(f). g–o, UMAP visualizations with senescence signature scores in each cell indicated by the color scale. Below: quantification of the proportion of uPAR positive and negative cells contributing to the respective senescence signature in total (h,k,n) and by cell type (i,l,o). g,h,i, liver; j,k,l, adipose tissue; m,n,o; pancreas. Results are from 1 independent experiment with (n = the sequencing of 4 mice where 2 females were combined into one replicate and 2 males were combined into another replicate) (a-m).
Extended Data Fig. 4
Extended Data Fig. 4. Effect of uPAR CAR T cells on aged tissues.
a-c, Quantification of SA-β-Gal–positive cells in adipose tissue, liver and pancreas 20 days after cell infusion (n = 3 for UT; n = 3 for h.19-m.28z; n = 4 for m.uPAR-m.28z). d-f, Quantification of uPAR-positive cells in adipose tissue, liver and pancreas 20 days after cell infusion (n = 3 per group). g-j, Percentage of dendritic cells and uPAR+ dendritic cells in the adipose tissue (g,h) or liver (i,j) 20 days after cell infusion (n = 3 for UT; n = 3 for h.19-m.28z; n = 4 for m.uPAR-m.28z). k-n, Percentage of macrophages and uPAR+ macrophages in the adipose tissue (k,l,) or liver (m,n) 20 days after cell infusion (n = 3 for UT; n = 3 for h.19-m.28z; n = 4 for m.uPAR-m.28z). o-r, Percentage of monocytes and uPAR+ monocytes in the adipose tissue (o,p) or liver (q,r) 20 days after cell infusion (n = 3 for UT; n = 3 for h.19-m.28z; n = 4 for m.uPAR-m.28z). Results of 1 independent experiment (a-r). Data are mean ± s.e.m.; p values from two-tailed unpaired Student’s t-test (a-r). Source data
Extended Data Fig. 5
Extended Data Fig. 5. uPAR CAR T cells are not associated with signs of tissue damage in aged tissues and do not exacerbate spontaneous age-related histological changes in lung, liver and kidneys.
Mice received cell infusions at 18–20 months and were sacrificed 20 days after infusion of the indicated T cells. Sections were stained with hematoxylin and eosin. Aged mice showed mononuclear leukocytic aggregates composed predominantly of lymphocytes and plasma cells in tissues in an age dependent manner. These leukocytic aggregates were more frequently observed in tissues from uPAR-m.28z CAR T- treated aged mice than tissues from control aged mice and were not associated with necrosis and/or degeneration in tissues from both experimental and control aged mice. These lymphocytic and plasmocytic aggregates in tissues are often observed in naïve aged mice and are considered spontaneous background findings in longitudinal aging studies in mice,. a, Representative sections of normal cerebral cortex and meninges at the level of the posterior hypothalamus (inset: hippocampus). b. Histology of normal cardiomyocytes and interstitium in myocardium (inset: ventricles and interventricular septum). c. Representative histology of normal lungs showed dense aggregates of lymphocytes and fewer plasma cells and macrophages around bronchioles or vasculature (inset: pulmonary lobes). d. The liver from aged mice showed accumulation of lymphocytic and histiocytic aggregates in portal to periportal regions (Inset: hepatic lobe). e. Histology of the kidneys showed accumulation of lymphocytes and plasma cells in the renal interstitium (n & o) and around blood vessels (inset: renal cortex, medulla, and pelvis). f. Representative sections of normal pancreatic acini (exocrine pancreas) and islets of Langerhans (endocrine pancreas; inset: pancreatic lobule). Images were captured at 4x (insets) and 40x magnifications. Results of 1 independent experiment (with n = 3 per group).
Extended Data Fig. 6
Extended Data Fig. 6. Effect of uPAR CAR T cells in young and old tissues.
a-b, Mice received cell infusion at 3 months old. a, Levels of glucose before (0 min) and after intraperitoneal administration of glucose (2 g/kg) 2.5 months after cell infusion (n = 13 for untransduced T cells; n = 12 for h.19-m.28z and n = 13 for m.uPAR-m.28z). b, Area under the curve (AUC) representing the results from a. Each point represents a single mouse. c-d, Mice received cell infusion at 18–20 months old. c, Levels of glucose before (0 min) and after intraperitoneal administration of insulin (0.5 units/kg body weight) 2.5 months after cell infusion (n = 10 for untransduced T cells and n = 10 for m.uPAR-m.28z). d, Area under the curve (AUC) representing the results from c. Each point represents a single mouse. Results of 2 independent experiments (a,b) or 1 independent experiment (c,d). Data are mean ± s.e.m.; p values from two-tailed unpaired Student’s t-test (b,d). Source data
Extended Data Fig. 7
Extended Data Fig. 7. Profile of and long-term effects of uPAR CAR T cells in aging.
a,b, Percentage of CD4+ or CD8+ cells among CD45.1+ T cells from the spleen (a) or liver (b) of 4-month-old or 20-month-old mice 20 days after cell infusion (n = 3 mice per age group for untransduced T cells [UT] and for h.19-m.28z; n = 4 for m.uPAR-m.28z). c,d, Percentage of CD45.1+ T cells expressing differentiation markers CD62L and CD44 in the spleen (c) or liver (d) of 4-month-old or 20-month-old mice 20 days after cell infusion (sample sizes as in a). e,f, Percentage of CD4+ or CD8+ cells among CD45.1+ T cells in the spleen (e) or liver (f) of 15-month-old mice 12 months after cell infusion (n = 3 mice per group). g,h, Percentage of CD45.1+ T cells expressing differentiation markers CD62L and CD44 on CD45.1+ T cells in the spleen (g) or liver (h) of 15-month-old mice 12 months after cell infusion (n = 3 mice per group). i, Time to exhaustion in exercise capacity testing 12 months after cell infusion (n = 8 for untransduced T cells; n = 6 for h.19-m.28z; n = 12 for m.uPAR-m.28z). j, Maximum speed (m/min) in capacity testing 12 months after cell infusion (sample sizes as in i). k-m, Quantification of SA-β-Gal–positive cells 12 months after cell infusion in (k) adipose tissue (n = 6 for UT; n = 5 for h.19-m.28z; n = 6 for m.uPAR-m.28z); (l) liver (n = 6 for UT; n = 5 for h.19-m.28z; n = 5 for m.uPAR-m.28z) and (m) pancreas (n = 6 for UT; n = 5 for h.19-m.28z; n = 6 for m.uPAR-m.28z). n-p, Quantification of uPAR-positive cells in (n) adipose tissue, (o) liver and (p) pancreas 12 months after cell infusion (n = 3 per group). Results of 1 independent experiment (a-h, n-p) or 2 independent experiments (i-m). Data are mean ± s.e.m.; p values from two-tailed unpaired Student’s t-test (a-h, k-p) or two-tailed Mann Whitney test (i,j). Source data
Extended Data Fig. 8
Extended Data Fig. 8. uPAR CAR T cells decrease senescent cell burden in therapeutic and preventive settings in high fat diet.
a, Representative staining of SA-β-Gal after two months of high fat diet or normal chow diet. b-d; Quantification of SA-β-Gal–positive cells in pancreas, liver and adipose tissue after two months of high fat diet or normal chow diet (n = 3 for chow; n = 3 HFD). e, Representative staining of SA-β-Gal 1 month after cell infusion in the experimental scheme depicted in Fig. 7a. f-h; Quantification of SA-β-Gal–positive cells in pancreas, liver and adipose tissue 1 month after cell infusion (n = 5 for UT; for m.uPAR-m.28z n = 5 in pancreas, n = 6 in liver and n = 3 in adipose tissue). UT, untransduced T cells. i, Representative staining of SA-β-Gal 3.5 months after cell infusion in the experimental scheme depicted in Fig. 7j. j-l, Quantification of SA-β-Gal–positive cells in pancreas, liver, and adipose tissue 3.5 months after cell infusion (UT n = 4 in pancreas, n = 5 in liver and adipose tissue; for m.uPAR-m.28z n = 5). Each panel shows results from 1 experiment. Data are mean ± s.e.m.; p values from two-tailed unpaired Student’s t-test (b-d; f-h; j-l). Source data
Extended Data Fig. 9
Extended Data Fig. 9. Profile and persistence of uPAR CAR T cells in metabolic syndrome.
T cells were assessed in spleen (a-d) and liver (e-h) 3.5 months after cell infusion in the experimental scheme depicted in Fig. 7j. a, Percentage of CD45.1+ T cells in the spleen. b, Percentage of CD4+ cells among CD45.1+ T cells in the spleen. c, Percentage of CD8+ cells among CD45.1+ T cells in the spleen. d, Percentage of CD45.1+ T cells from the spleen expressing differentiation markers CD62L and CD44. e, Percentage of CD45.1+ T cells in the liver. f, Percentage of CD4+ cells among CD45.1+ T cells in the liver. g, Percentage of CD8+ cells among CD45.1+ T cells in the liver. h, Percentage of CD45.1+ T cells in the liver expressing differentiation markers CD62L and CD44. Results in each panel are from 1 experiment (n = 5 mice per group). Data are mean ± s.e.m.; p values from two-tailed unpaired Student’s t-test. Source data
Extended Data Fig. 10
Extended Data Fig. 10. Gating strategies.
a,b, Representative flow cytometry staining of m.uPAR-m.28z (a) or untransduced T cells (b) obtained from the spleens of mice 20 days after cell infusion as depicted in Fig. 5g. Shown are results of 1 independent experiment (n = 3 mice for untransduced T cells; n = 4 mice for m.uPAR-m.28z).

Update of

References

    1. Sharpless NE, Sherr CJ. Forging a signature of in vivo senescence. Nat. Rev. Cancer. 2015;15:397–408. doi: 10.1038/nrc3960. - DOI - PubMed
    1. Collado M, Blasco MA, Serrano M. Cellular senescence in cancer and aging. Cell. 2007;130:223–233. doi: 10.1016/j.cell.2007.07.003. - DOI - PubMed
    1. Coppe JP, et al. Senescence-associated secretory phenotypes reveal cell-nonautonomous functions of oncogenic RAS and the p53 tumor suppressor. PLoS Biol. 2008;6:2853–2868. doi: 10.1371/journal.pbio.0060301. - DOI - PMC - PubMed
    1. Ovadya Y, et al. Impaired immune surveillance accelerates accumulation of senescent cells and aging. Nat. Commun. 2018;9:5435. doi: 10.1038/s41467-018-07825-3. - DOI - PMC - PubMed
    1. Lopez-Otin C, Blasco MA, Partridge L, Serrano M, Kroemer G. The hallmarks of aging. Cell. 2013;153:1194–1217. doi: 10.1016/j.cell.2013.05.039. - DOI - PMC - PubMed