

mRNA-based precision targeting of neoantigens and tumor-associated antigens in malignant brain tumors
- PMID: 38268001
- PMCID: PMC10809449
- DOI: 10.1186/s13073-024-01281-z
mRNA-based precision targeting of neoantigens and tumor-associated antigens in malignant brain tumors
Abstract
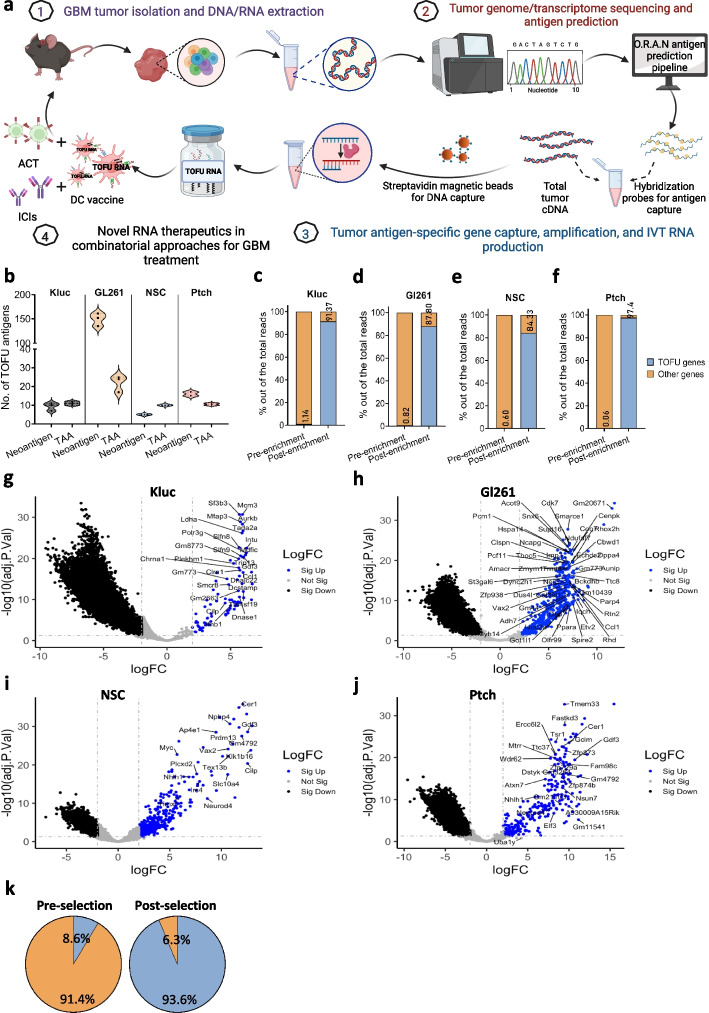
Background: Despite advancements in the successful use of immunotherapy in treating a variety of solid tumors, applications in treating brain tumors have lagged considerably. This is due, at least in part, to the lack of well-characterized antigens expressed within brain tumors that can mediate tumor rejection; the low mutational burden of these tumors that limits the abundance of targetable neoantigens; and the immunologically "cold" tumor microenvironment that hampers the generation of sustained and productive immunologic responses. The field of mRNA-based therapeutics has experienced a boon following the universal approval of COVID-19 mRNA vaccines. mRNA-based immunotherapeutics have also garnered widespread interest for their potential to revolutionize cancer treatment. In this study, we developed a novel and scalable approach for the production of personalized mRNA-based therapeutics that target multiple tumor rejection antigens in a single therapy for the treatment of refractory brain tumors.
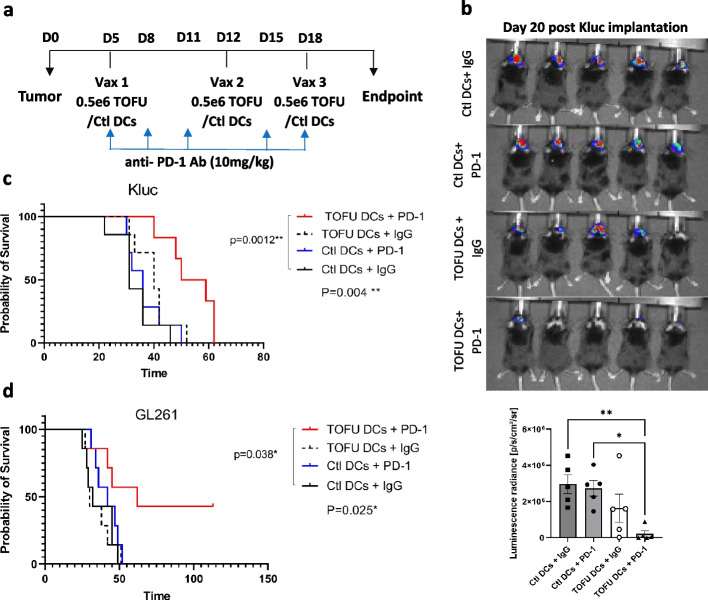
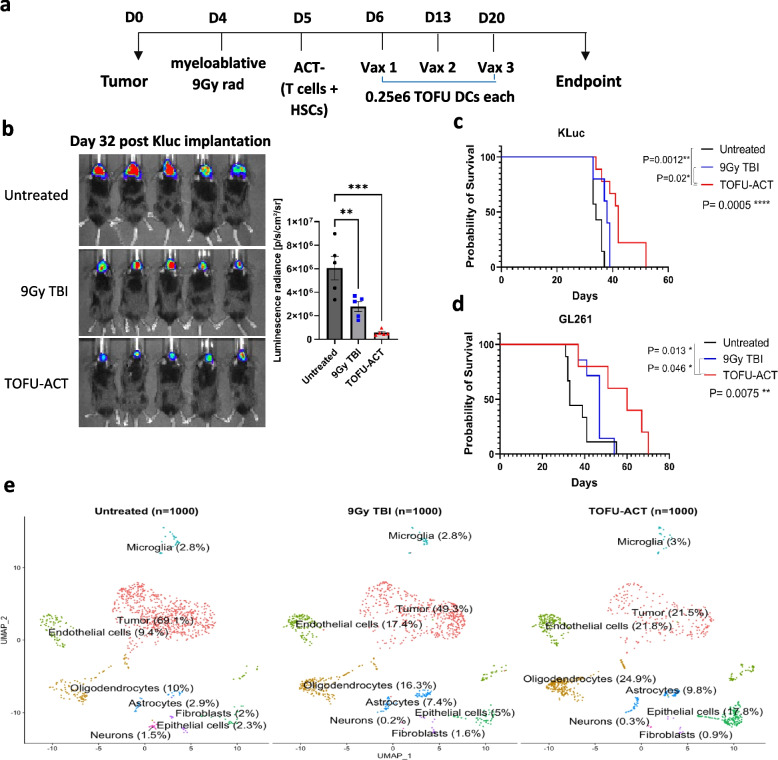
Methods: Tumor-specific neoantigens and aberrantly overexpressed tumor-associated antigens were identified for glioblastoma and medulloblastoma tumors using our cancer immunogenomics pipeline called Open Reading Frame Antigen Network (O.R.A.N). Personalized tumor antigen-specific mRNA vaccine was developed for each individual tumor model using selective gene capture and enrichment strategy. The immunogenicity and efficacy of the personalized mRNA vaccines was evaluated in combination with anti-PD-1 immune checkpoint blockade therapy or adoptive cellular therapy with ex vivo expanded tumor antigen-specific lymphocytes in highly aggressive murine GBM models.
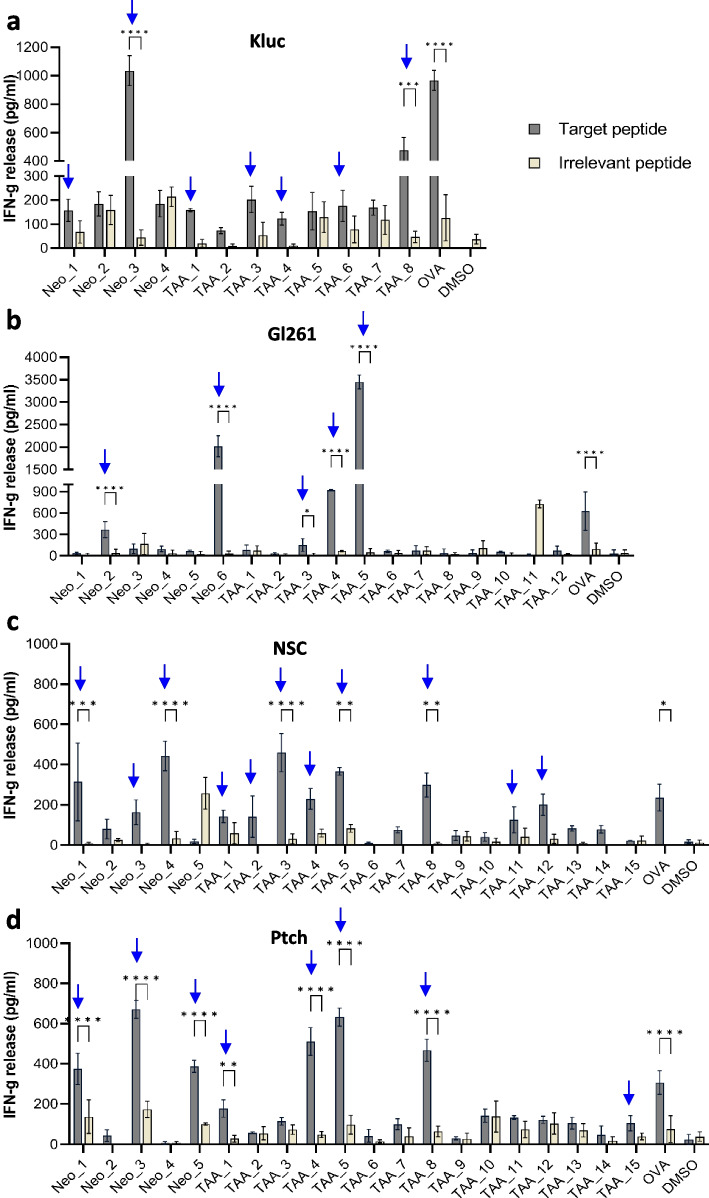
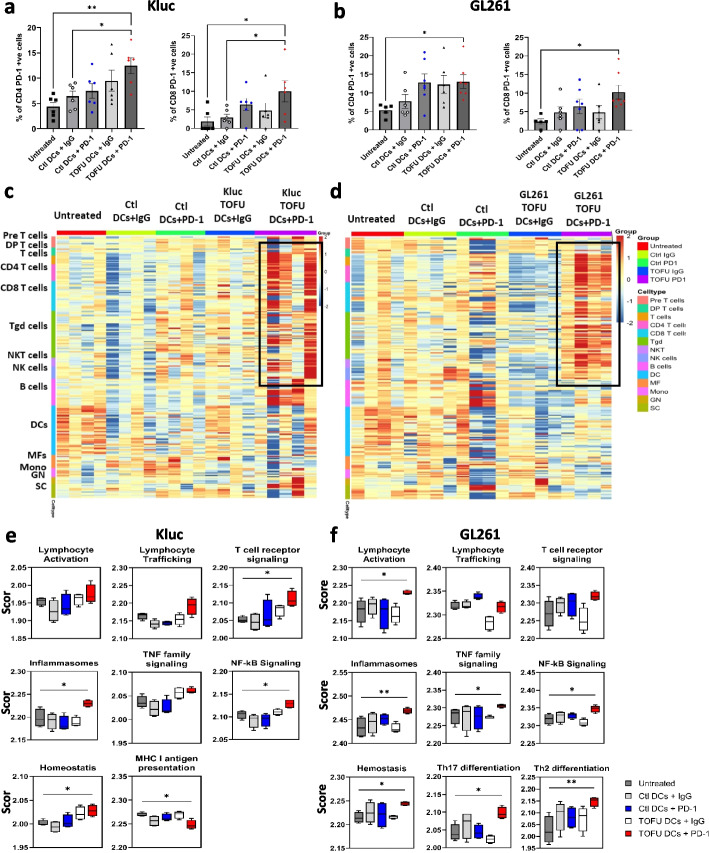
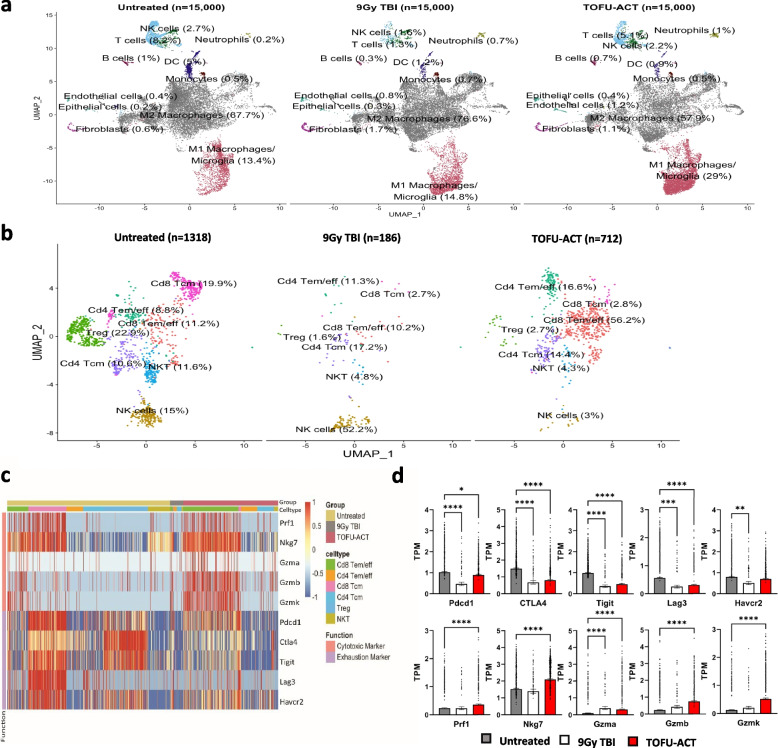
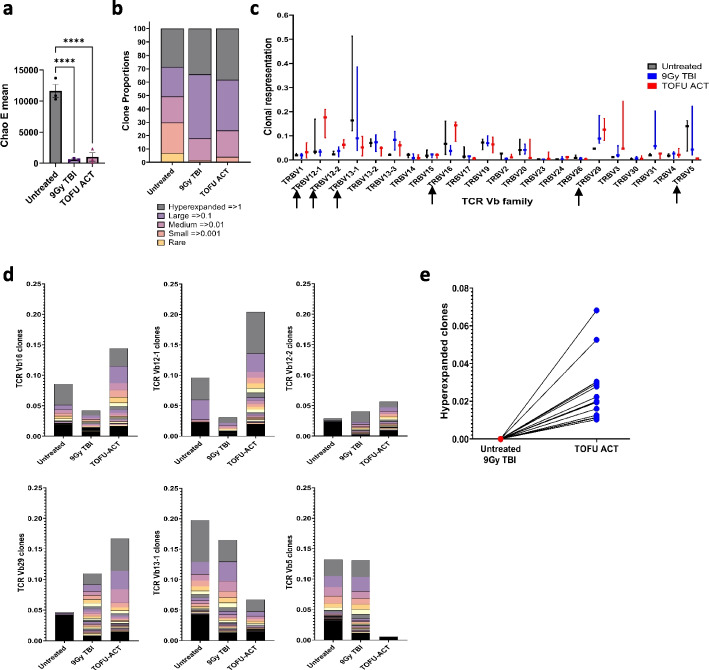
Results: Our results demonstrate the effectiveness of the antigen-specific mRNA vaccines in eliciting robust anti-tumor immune responses in GBM hosts. Our findings substantiate an increase in tumor-infiltrating lymphocytes characterized by enhanced effector function, both intratumorally and systemically, after antigen-specific mRNA-directed immunotherapy, resulting in a favorable shift in the tumor microenvironment from immunologically cold to hot. Capacity to generate personalized mRNA vaccines targeting human GBM antigens was also demonstrated.
Conclusions: We have established a personalized and customizable mRNA-therapeutic approach that effectively targets a plurality of tumor antigens and demonstrated potent anti-tumor response in preclinical brain tumor models. This platform mRNA technology uniquely addresses the challenge of tumor heterogeneity and low antigen burden, two key deficiencies in targeting the classically immunotherapy-resistant CNS malignancies, and possibly other cold tumor types.
Keywords: Adoptive T cell therapy; Brain tumors; Cancer immunity; Glioblastoma; Immune checkpoint blockade; Personalized immunotherapy; Vaccines; mRNA therapeutics.
© 2024. The Author(s).
Conflict of interest statement
The authors declare no conflicts of interest with this work.
Figures
Similar articles
-
Identification of tumor rejection antigens and the immunologic landscape of medulloblastoma.Genome Med. 2024 Aug 19;16(1):102. doi: 10.1186/s13073-024-01363-y. Genome Med. 2024. PMID: 39160595 Free PMC article.
-
Treatment of an aggressive orthotopic murine glioblastoma model with combination checkpoint blockade and a multivalent neoantigen vaccine.Neuro Oncol. 2020 Sep 29;22(9):1276-1288. doi: 10.1093/neuonc/noaa050. Neuro Oncol. 2020. PMID: 32133512 Free PMC article.
-
Immunotherapy as a New Therapeutic Approach for Brain and Spinal Cord Tumors.Adv Exp Med Biol. 2023;1394:73-84. doi: 10.1007/978-3-031-14732-6_5. Adv Exp Med Biol. 2023. PMID: 36587382
-
Personalized neoantigen vaccines: a glimmer of hope for glioblastoma.Expert Rev Vaccines. 2020 May;19(5):407-417. doi: 10.1080/14760584.2020.1750376. Epub 2020 Apr 17. Expert Rev Vaccines. 2020. PMID: 32238056 Review.
-
Neoantigen discovery and applications in glioblastoma: An immunotherapy perspective.Cancer Lett. 2022 Dec 1;550:215945. doi: 10.1016/j.canlet.2022.215945. Epub 2022 Oct 7. Cancer Lett. 2022. PMID: 36216148 Review.
Cited by
-
Editorial: Advances of novel approaches to enhance therapeutic efficacy and safety in human solid cold tumor.Front Immunol. 2024 Mar 22;15:1398270. doi: 10.3389/fimmu.2024.1398270. eCollection 2024. Front Immunol. 2024. PMID: 38585262 Free PMC article. No abstract available.
-
Technological breakthroughs and advancements in the application of mRNA vaccines: a comprehensive exploration and future prospects.Front Immunol. 2025 Mar 4;16:1524317. doi: 10.3389/fimmu.2025.1524317. eCollection 2025. Front Immunol. 2025. PMID: 40103818 Free PMC article. Review.
-
KR158 Spheres Harboring Slow-Cycling Cells Recapitulate High-Grade Glioma Features in an Immunocompetent System.Cells. 2024 May 29;13(11):938. doi: 10.3390/cells13110938. Cells. 2024. PMID: 38891070 Free PMC article.
-
Research progress on tumor-infiltrating lymphocyte therapy for cervical cancer.Front Immunol. 2025 May 19;16:1524842. doi: 10.3389/fimmu.2025.1524842. eCollection 2025. Front Immunol. 2025. PMID: 40458394 Free PMC article. Review.
-
Towards Effective Treatment of Glioblastoma: The Role of Combination Therapies and the Potential of Phytotherapy and Micotherapy.Curr Issues Mol Biol. 2024 Dec 19;46(12):14324-14350. doi: 10.3390/cimb46120859. Curr Issues Mol Biol. 2024. PMID: 39727987 Free PMC article. Review.
References
-
- Sun L, Zhang L, Yu J, Zhang Y, Pang X, Ma C, Shen M, Ruan S, Wasan HS, Qiu S. Clinical efficacy and safety of anti-PD-1/PD-L1 inhibitors for the treatment of advanced or metastatic cancer: a systematic review and meta-analysis. Sci Rep. 2020;10(1):2083. doi: 10.1038/s41598-020-58674-4. - DOI - PMC - PubMed
Publication types
MeSH terms
Substances
Grants and funding
LinkOut - more resources
Full Text Sources
Other Literature Sources
Medical
