. 2024 Jan;12(2):e15923.
doi: 10.14814/phy2.15923.

Selenium protects against nesfatin-1 modulation of the hypothalamic-pituitary-testicular axis during hypothyroidism in male rats

Affiliations

Selenium protects against nesfatin-1 modulation of the hypothalamic-pituitary-testicular axis during hypothyroidism in male rats

Rehab Ahmed Ahmed El-Shaer et al. Physiol Rep. 2024 Jan.

Abstract

Normal gonadal function can be disrupted by hypothyroidism. Hypothyroidism disturbs testicular function directly and centrally by affecting the hypothalamic-pituitary-testicular axis with unclear mechanism. As nesfatin-1 neurons co-localized with TRH and GnRH neurons in the hypothalamus, it could play a role in centrally hypothyroidism induced testicular dysfunction. Selenium (Se), by affecting thyroid iodide supply, could relieve these disturbances. So, we aim to identify the role of nesfatin-1 as a link between testicular dysfunction and hypothyroidism through modulating the MAPK/ERK pathway while discussing the possible role of Se in alleviating hypothyroidism and associated testicular damage. Forty male rats were divided equally into: Control: distilled water, Se: Se orally, Propylthiouracil (PTU): PTU orally, PTU + Se: Se with PTU orally. Serum thyroid function, gonadal hormones, nesfatin-1, testicular redox status, sperm analysis, brain tissue GnRH, nucleobindin 2-derived polypeptide, pMAPK/ERK gene expression, histological changes and immunohistochemical expression of testicular proliferating cell antigen (PCNA) were done. PTU induced hypothyroidism and reduction of gonadal hormones which both were correlated with reduced nesfatin-1. There was testicular stress with reduced GnRH, NUCB2, pMAPK/ERK gene expression, and PCNA immunopositive cells. These parameters were reversed by Se. Nesfatin-1 could be the central link between hypothyroidism and disturbances of the hypothalamic pituitary testicular axis.

Keywords: hypothalamic-pituitary-testicular axis; hypothyroidism; nesfatin-1; propylthiouracil; selenium.


Conflict of interest statement

The authors did not disclose any potential conflicts of interest.

Figures

FIGURE 1
FIGURE 1
Correlation of (a) serum TSH (μIU/mL), (b) free T3 (ng/mL), and (c) free T4 (μg/dL) with serum nesfatine‐1 (ng/mL) in all studied groups. Number of rats: 10. Superscript *denotes statistical significance at p < 0.05. The Pearson correlation coefficient (Pearson r test) was utilized to determine the strength and relationship between two variables. r = (−1 to +1). A value of −1 indicates a strong negative correlation. A value of +1 indicates a strong positive correlation. A value of 0 indicates that there is no association. TSH stands for (Thyroid‐stimulating hormone) T3 stands for (Triiodothyronine) T4 stands for (Thyroxine).
FIGURE 2
FIGURE 2
Correlation of (a) serum GnRH (ng/mL), (b) LH (mIU/mL), (c) FSH (mIU/mL), and (d) testosterone (ng/mL) with serum nesfatine‐1 (ng/mL) in all studied groups. Number of rats: 10. Superscript * denotes statistical significance at p < 0.05. The Pearson correlation coefficient (Pearson r test) was utilized to determine the strength and relationship between two variables. r = (−1 to +1). A value of −1 indicates a strong negative correlation. A value of +1 indicates a strong positive correlation. A value of 0 indicates that there is no association. GnRH stands for (Gonadotropin‐Releasing Hormone) LH stands for (Luteinizing Hormone) FSH stands for (Follicle stimulating hormone).
FIGURE 3
FIGURE 3
Effect of PTU and Se on relative mRNA gene expression of NUCB2, GnRH, and pMAPK/ERK in brain tissue among all studied groups. Ten rats in each group. The mean ± standard deviation and individual data are used to express the data. The one‐way ANOVA test was used for statistical comparisons, followed by the (Tukey) post hoc test. Superscript a, b, and c denote a statistically significant difference at p < 0.05. a p < 0.05 in comparison of control group. b p < 0.05 in comparison of Se group. c p < 0.05 in comparison of PTU group. NUCB2 stands for (Nucleobindin 2‐derived polypeptide) GnRH stands for (Gonadotropin‐releasing hormone) pMPAK stands for (phosphorylated Mitogen‐activated protein kinase) ERK stands for (Extracellular signal‐regulated kinase).
FIGURE 4
FIGURE 4
A photomicrograph of testicular tissue from the control and Se groups (a, c) show normal seminiferous tubules (ST) lined by germinal epithelium and Sertoli cells (*) resting on the basement membrane. Sperm (S) are seen in the lumen. Each tubule is surrounded by an intact basement membrane (thin black arrow). There is a normal amount of interstitial space in between the tubules, which contain Leydig cells (L). (b, d) A higher magnification photomicrograph showing the spermatogenic cells lining each tubule in the form of spermatogonia (black arrows SG), primary spermatocytes (yellow arrows), spermatids (white arrows), and sperms on the lumen (H & E × 200, scale bar = 100 μm and H & E × 400, scale bar = 50 μm).
FIGURE 5
FIGURE 5
A photomicrograph of testicular tissue from the PTU group (a–d) shows seminiferous tubules (ST) with a noticeable decrease in the number of spermatogenic cells, disorganization, and vacuolation (V) of most germinal epithelial cells. Most of the tubule‐lining spermatogenic cells had small, dark pyknotic nuclei (double arrows). Desquamated and detached cells (D) are seen in some tubules' lumen. There are few Leydig cells (L) and vacuoles (V) in interstitial space tissue. The basement membrane (BM) surrounding the tubules is distorted and detached in some areas. Moreover, there are congested blood vessels (BV) in the interstitial tissue. (H & E × 200, scale bar = 100 μm and H & E × 400, scale bar = 50 μm).
FIGURE 6
FIGURE 6
A photomicrograph of testicular tissue from the PTU+ Se group (a, b) shows normal seminiferous tubules (ST) lined by germinal epithelium. The tubules are surrounded by a thick fibrous capsule, tunica albuginea (thick black arrow). Sperm (S) are seen in the lumen. Each tubule is surrounded by an intact basement membrane (thin black arrow). There is a normal amount of interstitial space in between the tubules, which contain Leydig cells (L). Some tubules show wide interstitial tissue in between (*). (c, d) A higher magnification photomicrograph showing the spermatogenic cells lining each tubule in the form of spermatogonia (black arrows SG), primary spermatocytes (yellow arrows), spermatids (white arrows), and sperms on the lumen and Sertoli cells (yellow *) resting on the basement membrane. (H & E × 200, scale bar = 100 μm and H & E × 400, scale bar = 50 μm).
FIGURE 7
FIGURE 7
Effect of PTU and Se on the Johnsen scores of seminiferous tubular cross‐sections among all studied groups. Box plot was used to express the data. The bottom of the plot represents 25%, the middle represents the median and the top represent the 75% of the data. Superscript a, b, and c denote a statistically significant difference at (p < 0.05). a p < 0.05 in comparison of control group. b p < 0.05 in comparison of Se group. c p < 0.05 in comparison of PTU group by using Kruskal–Wallis test followed with Dunn's pairwise comparison post hoc test.
FIGURE 8
FIGURE 8
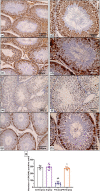
A representative photomicrograph of testicular tissue stained with PCNA immunostaining from the different groups. (a–d) Control and Se groups exhibit many positive PCNA immunoreactions in the form of brownish discoloration of the nuclei of germ cells. (e, f) The number of positive immune cells decreased in the PTU group. (g, h) PTU + Se group shows a moderate number of positive cells (PCNA‐immunostaining × 400, scale bar = 50 μm). (i) Number of (PCNA) positive cells, the mean ± standard deviation and individual data are used to express the data. The one‐way ANOVA test was used for statistical comparisons, followed by the (Tukey) post hoc test. Superscript a, b and c denote a statistically significant difference at (p < 0.05). a p < 0.05 in comparison of control group. b p < 0.05 in comparison of Se group. c p < 0.05 in comparison of PTU group.

References

    1. Ahsan, U. , Kamran, Z. , Raza, I. , Ahmad, S. , Babar, W. , Riaz, M. H. , & Iqbal, Z. (2014). Role of selenium in male reproduction‐a review. Animal Reproduction Science, 146(1–2), 55–62. 10.1016/j.anireprosci.2014.01.009 - DOI - PubMed
    1. Algaidi, S. A. , Faddladdeen, K. A. , Alrefaei, G. I. , Qahl, S. H. , Albadawi, E. A. , ALmohaimeed, H. M. , & Ayuob, N. N. (2022). Thymoquinone protects the testes of hypothyroid rats by suppressing pro‐inflammatory cytokines and oxidative stress and promoting SIRT1 testicular expression. Frontiers in Pharmacology, 13, 4873. 10.3389/fphar.2022.1040857 - DOI - PMC - PubMed
    1. Alkalby, J. M. , & Alzerjawi, S. J. (2013). Effect of propylthiouracil‐induced hypothyroidism on reproductive efficiency of adult male rats. Journal of Veterinary Research, 12(2), 113–121. 10.1007/BF02537073 - DOI
    1. Allen, J. A. , Shankara, T. , Janus, P. , Buck, S. , Diemer, T. , Held Hales, K. , & Hales, D. B. (2006). Energized, polarized, and actively respiring mitochondria are required for acute Leydig cell steroidogenesis. Endocrinology, 147(8), 3924–3935. 10.1210/en.2005-1204 - DOI - PubMed
    1. Angelone, T. , Filice, E. , Pasqua, T. , Amodio, N. , Galluccio, M. , Montesanti, G. , Quintieri, A. M. , & Cerra, M. C. (2013). Nesfatin‐1 as a novel cardiac peptide: Identification, functional characterization, and protection against ischemia/reperfusion injury. Cellular and Molecular Life Sciences, 70, 495–509. 10.1007/s00018-012-1138-7 - DOI - PMC - PubMed