. 2023 Oct 8;12(1):116-130.
doi: 10.1002/fsn3.3746. eCollection 2024 Jan.

Attenuative effects of collagen peptide from milkfish (Chanos chanos) scales on ovariectomy-induced osteoporosis

Affiliations

Attenuative effects of collagen peptide from milkfish (Chanos chanos) scales on ovariectomy-induced osteoporosis

Jiunn-Jye Chuu et al. Food Sci Nutr. .

Abstract

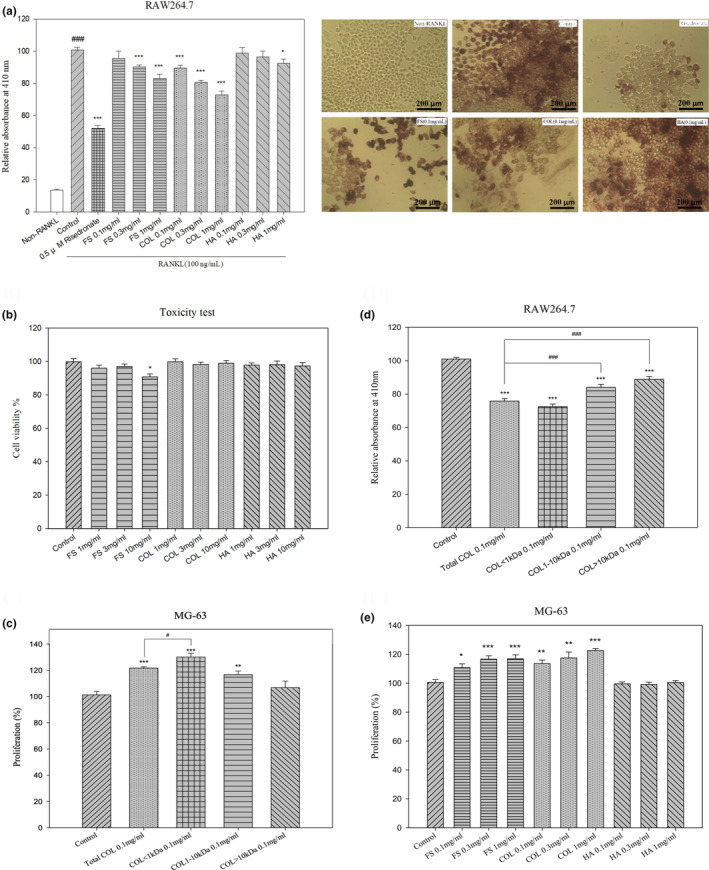
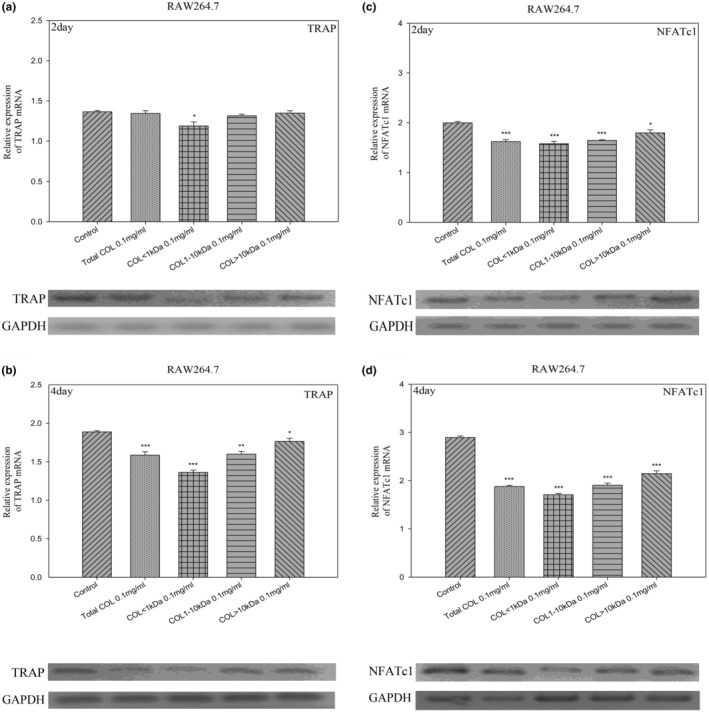
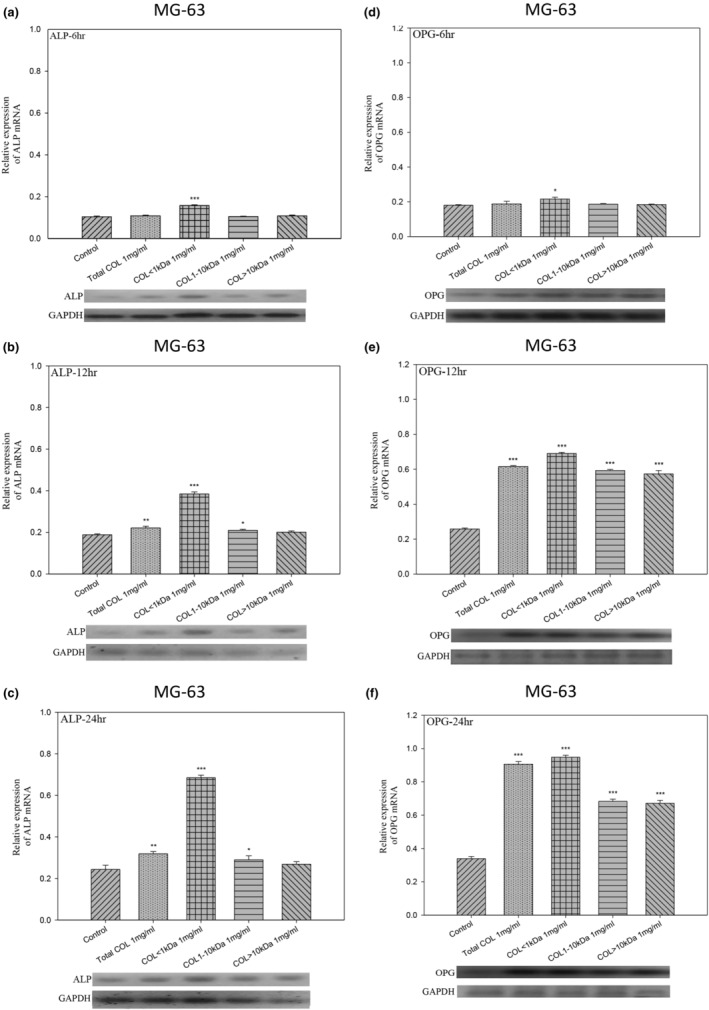
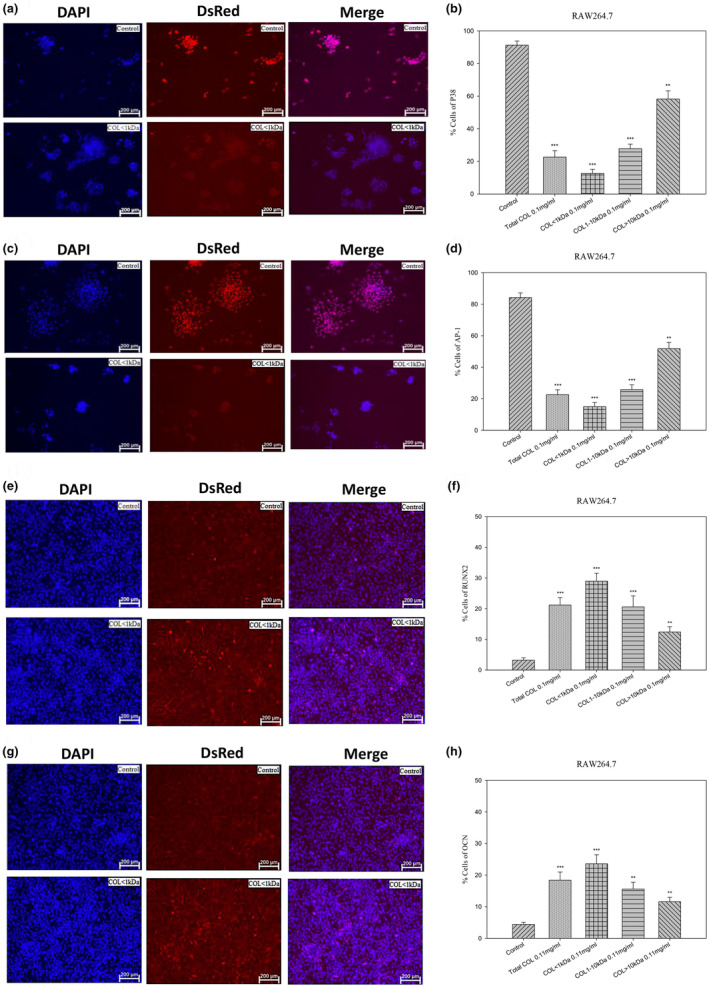
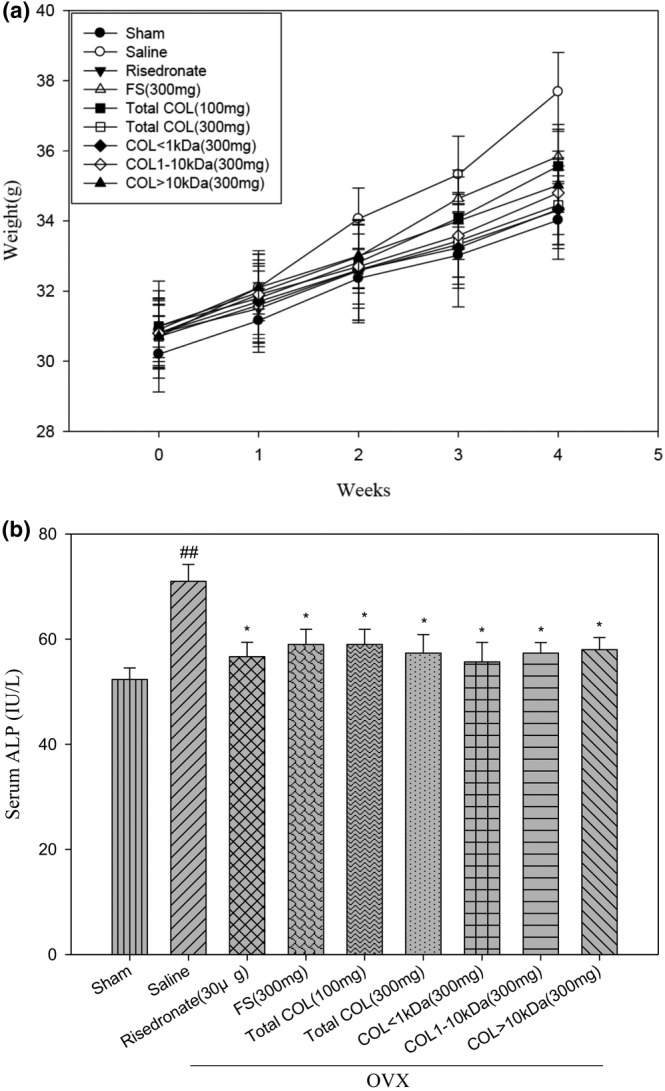
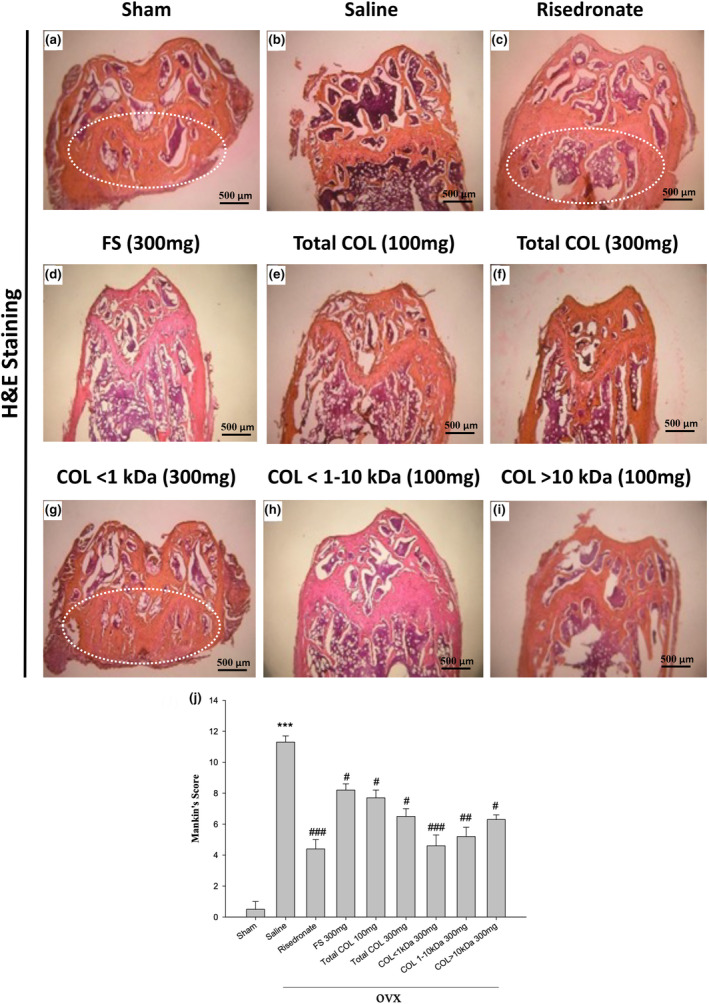
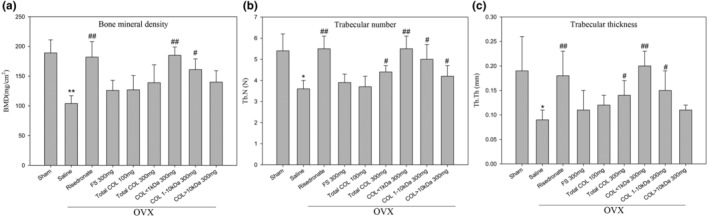
Osteoporosis is characterized by low bone mass, bone microarchitecture disruption, and collagen loss, leading to increased fracture risk. In the current study, collagen peptides were extracted from milkfish scales (MS) to develop potential therapeutic candidates for osteoporosis. MS was used to synthesize a crude extract of fish scales (FS), collagen liquid (COL), and hydroxyapatite powder (HA). COL samples were further categorized according to the peptide size of total COL (0.1 mg/mL), COL < 1 kDa (0.1 mg/mL), COL: 1-10 kDa (0.1 mg/mL), and COL > 10 kDa (0.1 mg/mL) to determine it. Semi-quantitative reverse transcription polymerase chain reaction (sqRT-PCR) and immunofluorescence labeling were used to assess the expression levels of specific mRNA and proteins in vitro. For in vivo studies, mice ovariectomy (OVX)-induced postmenopausal osteoporosis were developed, while the sham surgery (Sham) group was treated as a control. Collagen peptides (CP) from MS inhibited osteoclast differentiation in RAW264.7 cells following an insult with nuclear factor kappa-B ligand (RANKL). CP also enhanced osteoblast proliferation in MG-63 cells, possibly through downregulating NFATc1 and TRAP mRNA expression and upregulating ALP and OPG mRNA levels. Furthermore, COL1 kDa also inhibited bone density loss in osteoporotic mice. Taken together, CP may reduce RANKL-induced osteoclast activity while promoting osteoblast synthesis, and therefore may act as a potential therapeutic agent for the prevention and control of osteoporosis.

Keywords: milkfish scales; osteoblast; osteoclast; osteoporosis; ovariectomized.


Conflict of interest statement

The authors report no conflict of interest in relation to the work.

Figures

FIGURE 1
FIGURE 1
In vitro cell pharmacological test. (a) Test results and representative microscopic images showing the effects of extracts from milkfish scales on osteoclast (RAW264.7) differentiation. Control, risedronate (30 μg/mL) as well as FS, COL, and HA (0.1, 0.3, and 1 mg/mL, respectively); Scale bar = 200 μm. (b) Effects of FS, COL, or HA on osteoclast (RAW264.7) toxicity, where the concentration is 1, 3, or 10 mg/mL, respectively. (c) Test results showing the effects of milkfish scale collagen peptide on osteoblast (MG‐63) proliferation. Control, total COL, COL: 1–10 kDa, and COL > 10 kDa (0.1 mg/mL). (d) Effects of milkfish scale CP on osteoclast differentiation (RAW264.7), where the concentration of control, total COL, COL < 1 kDa, COL: 1–10 kDa, and COL > 10 kDa is 0.1 mg/mL. (e) Experiment on the promotion of osteoblast proliferation by various extracts from milkfish scales. The concentrations of control as well as FS, COL, and HA are 0.1, 0.3, and 1 mg/ ml, respectively. The values in the figure are expressed as the mean ± SE(n = 6). The significance was indicated as follows: *p < .05, **p < .01, and ***p < .001 compared with the control groups or #p < .05, ##p < .01, and ###p < .001 compared with non‐RANKL groups or total COL groups.
FIGURE 2
FIGURE 2
The mRNA expression levels of the NFATc1 and TRAP genes in osteoclasts. (a–d) Inhibition of osteoclast (RAW264.7) differentiation as a function of peptide size, as indicated by the expression of TRAP or NFATc1 genes. COL < 1 kDa (0.1 mg/mL) had the most striking impact on downregulating osteoclast gene expression at 2 and 4 days. The concentrations of control, total COL, COL < 1 kDa, COL: 1–10 kDa, and COL > 10 kDa (0.1 mg/mL). Data are expressed as mean ± SE (n = 3). *p < .05, **p < .01, and ***p < .001, compared with the control groups.
FIGURE 3
FIGURE 3
The mRNA expression levels of the OPG and ALP genes in osteoblasts. (a–f) MG‐63 osteoblasts were subjected to CP of various sizes for 6, 12, or 24 h to observe their effect on ALP and/or OPG gene expression. The concentrations of control, total COL, COL < 1 kDa, COL: 1–10 kDa, and COL > 10 kDa was 0.1 mg/mL. Normalized gene expression levels are expressed as ratios of the number of mRNA copies of specific genes versus the number of GAPDH cDNA copies. Treatment with CP (<1 kDa) showed the most pronounced effect on downregulating osteoblast gene expression at 6, 12, and 24 h. Data are expressed as mean ± SE (n = 3). *p < .05, **p < .01, and ***p < .001, compared with control groups.
FIGURE 4
FIGURE 4
Osteoclast and osteoclastogenesis immunofluorescence staining assay. (a, c, e, and g) Different sizes of milkfish scale CP were used to assess their impact on inhibition of osteoclasts differentiation (RAW264.7) by calculating the expression of P38, AP‐1, RUNX2, and OCN proteins with their respective quantifications. The concentration of control, total COL, COL < 1 kDa, COL: 1–10 kDa, and COL > 10 kDa is 0.1 mg/mL). Immunofluorescence staining of P38, AP‐1, RUNX2, or OCN as well as quantification of the percentage of positive cells (b, d, f, and h): Extranuclear and intranuclear osteoclast gene expression revealed that COL < 1 kDa (0.1 mg/mL) had the most pronounced effect on the downregulation or upregulation of osteoclast gene expression. The data are expressed as mean ± SE (n = 5). *p < .05, **p < .01, and ***p < .001, compared with the control groups. Scale bar = 200 μm.
FIGURE 5
FIGURE 5
(a) Body weight of mice in the various treatment groups. The number of samples, n = 5. (b) ALP serum levels in sham, saline, risedronate groups (30 μg/mL), FS group (300 mg/mL), total COL group (100 and 300 mg), COL <1 kDa group (300 mg/mL), COL: 1–10 kDa group (300 mg/mL), and COL > 10 kDa group (300 mg/mL). The ALP content in the blood of mice in the saline group and the sham group was highest, whereas that of the other experimental groups all decreased, which was comparable to the ALP content in the sham group without ovariectomy. Data are represented as mean ± SE (n = 3). *p < .05, **p < .01, and ***p < .001 compared with the saline groups or #p < .05, ##p < .01, and ###p < .001 compared with the sham group.
FIGURE 6
FIGURE 6
Histomorphological results from the femur of OVX mice. (a–i) At 28 days after surgery, the animals were sacrificed for histological analysis of the femur. Note that treatment involved FS (300 mg/kg/day), total COL (100 and 300 mg/kg/day), COL < 1 kDa (300 mg/kg/day), COL: 1–10 kDa (300 mg/kg/day), COL > 10 kDa (300 mg/kg/day), and risedronate (30 μg/kg/day) in OVX mice: (a) Femoral tissue in the sham‐operated group (white rectangle frame) remained relatively intact, and bone density was well preserved compared with (b) the saline group (OVX). We found better bone density based on veterinary pathologist grading. As shown in the white circle, the bone tissue was relatively tight. (a) In the white circle, in addition to the sham group without ovariectomy, (c) there is also a risedronate group, and (g) COL < 1 kDa (300 mg/kg/day), which revealed higher bone density and indicated enhanced therapeutic effect compared with the saline group. The rest of the experimental groups showed slight improvement. Scale bar = 500 μm. (j) Quantification of scores for all fields of stained sections in each group (n = 5). ***p < .001, # p < .05, ## p < .01, and ### p < .001, respectively.
FIGURE 7
FIGURE 7
X‐ray analysis of femoral tissue from mice, including the sham group; negative control group (Saline); positive control group (Risedronate); FS (300 mg/kg/day); total COL (100 and 300 mg/kg/day); COL < 1 kDa (300 mg/kg/day); COL: 1–10 kDa (300 mg/kg/day); and COL > 10 kDa (300 mg/kg/day). Quantification of the (a) bone mineral density, (b) trabecular number, or (c) thickness of OVX mice in each group (n = 5). *p < .05, **p < .01, # p < .05, and ## p < .01 indicate a significant difference compared with sham or saline groups, respectively.

Similar articles

References

    1. An, J. , Yang, H. , Zhang, Q. , Liu, C. , Zhao, J. , Zhang, L. , & Chen, B. (2016). Natural products for treatment of osteoporosis: The effects and mechanisms on promoting osteoblast‐mediated bone formation. Life Sciences, 147, 46–58. - PubMed
    1. Asagiri, M. , Sato, K. , Usami, T. , Ochi, S. , Nishina, H. , Yoshida, H. , Morita, I. , Wagner, E. F. , Mak, T. W. , Serfling, E. , & Takayanagi, H. (2005). Autoamplification of NFATc1 expression determines its essential role in bone homeostasis. The Journal of Experimental Medicine, 202(9), 1261–1269. - PMC - PubMed
    1. Asserin, J. , Lati, E. , Shioya, T. , & Prawitt, J. (2015). The effect of oral collagen peptide supplementation on skin moisture and the dermal collagen network: Evidence from an ex vivo model and randomized, placebo‐controlled clinical trials. Journal of Cosmetic Dermatology, 14(4), 291–301. - PubMed
    1. Beck, G. R., Jr. , Zerler, B. , & Moran, E. (2000). Phosphate is a specific signal for induction of osteopontin gene expression. Proceedings of the National Academy of Sciences of the United States of America, 97(15), 8352–8357. - PMC - PubMed
    1. Blanco, M. , Vazquez, J. A. , Perez‐Martin, R. I. , & Sotelo, C. G. (2017). Hydrolysates of fish skin collagen: An opportunity for valorizing fish industry byproducts. Marine Drugs, 15(5), 131. - PMC - PubMed

LinkOut - more resources