

Discrimination of object information by bat echolocation deciphered from acoustic simulations
- PMID: 38269077
- PMCID: PMC10805595
- DOI: 10.1098/rsos.231415
Discrimination of object information by bat echolocation deciphered from acoustic simulations
Abstract
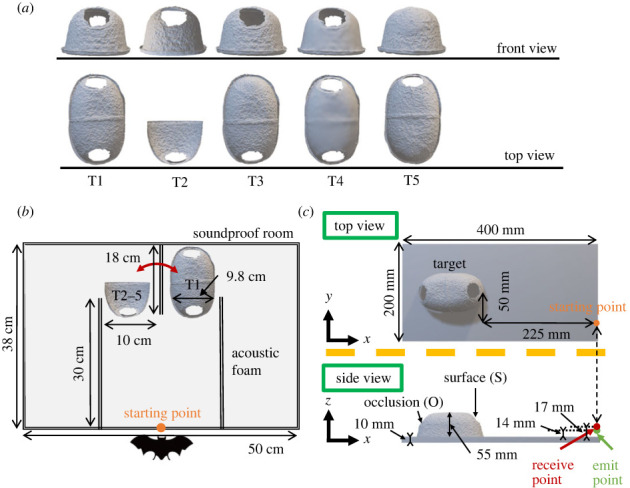
High-precision visual sensing has been achieved by combining cameras with deep learning. However, an unresolved challenge involves identifying information that remains elusive for optical sensors, such as occlusion spots hidden behind objects. Compared to light, sound waves have longer wavelengths and can, therefore, collect information on occlusion spots. In this study, we investigated whether bats could perform advanced sound sensing using echolocation to acquire a target's occlusion information. We conducted a two-alternative forced choice test on Pipistrellus abramus with five different targets, including targets with high visual similarity from the front, but different backend geometries, i.e. occlusion spots or textures. Subsequently, the echo impulse responses produced by these targets, which were difficult to obtain with real measurements, were computed using three-dimensional acoustic simulations to provide a detailed analysis consisting of the acoustic cues that the bats obtained through echolocation. Our findings demonstrated that bats could effectively discern differences in target occlusion spot structure and texture through echolocation. Furthermore, the discrimination performance was related to the differences in the logarithmic spectral distortion of the occlusion-related components in the simulated echo impulse responses. This suggested that the bats obtained occlusion information through echolocation, highlighting the advantages of utilizing broadband ultrasound for sensing.
Keywords: FDTD simulation; occlusion spots; target discriminations.
© 2024 The Authors.
Conflict of interest statement
The authors declare there are no conflicts of interest.
Figures


Similar articles
-
Analysis of echolocation behavior of bats in "echo space" using acoustic simulation.BMC Biol. 2022 Mar 14;20(1):59. doi: 10.1186/s12915-022-01253-y. BMC Biol. 2022. PMID: 35282831 Free PMC article.
-
Effectiveness of time-varying echo information for target geometry identification in bat-inspired human echolocation.PLoS One. 2021 May 5;16(5):e0250517. doi: 10.1371/journal.pone.0250517. eCollection 2021. PLoS One. 2021. PMID: 33951069 Free PMC article.
-
Bat-inspired signal design for target discrimination in human echolocation.J Acoust Soc Am. 2019 Apr;145(4):2221. doi: 10.1121/1.5097166. J Acoust Soc Am. 2019. PMID: 31046316
-
A view of the world through the bat's ear: the formation of acoustic images in echolocation.Cognition. 1989 Nov;33(1-2):155-99. doi: 10.1016/0010-0277(89)90009-7. Cognition. 1989. PMID: 2691182 Review.
-
Adaptations for Substrate Gleaning in Bats: The Pallid Bat as a Case Study.Brain Behav Evol. 2018;91(2):97-108. doi: 10.1159/000488873. Epub 2018 Jun 6. Brain Behav Evol. 2018. PMID: 29874652 Review.
References
-
- Kendoul F, Fantoni I, Nonami K. 2009. Optic flow-based vision system for autonomous 3D localization and control of small aerial vehicles. Rob. Auton. Syst. 57, 591-602. (10.1016/j.robot.2009.02.001) - DOI
-
- Feng D, Haase-Schütz C, Rosenbaum L, Hertlein H, Gläser C, Timm F, Wiesbeck W, Dietmayer K. 2021. Deep Multi-Modal Object Detection and Semantic Segmentation for Autonomous Driving: Datasets, Methods, and Challenges. IEEE Trans. Intell. Transp. Syst. 22, 1341-1360. (10.1109/TITS.2020.2972974) - DOI
-
- Arnold E, Al-Jarrah OY, Dianati M, Fallah S, Oxtoby D, Mouzakitis A. 2019. A Survey on 3D Object Detection Methods for Autonomous Driving Applications. IEEE Trans. Intell. Transp. Syst. 20, 3782-3795. (10.1109/TITS.2019.2892405) - DOI
-
- Horaud R, Hansard M, Evangelidis G, Ménier C. 2016. An overview of depth cameras and range scanners based on time-of-flight technologies. Mach. Vis. Appl. 27, 1005-1020. (10.1007/s00138-016-0784-4) - DOI
Associated data
LinkOut - more resources
Full Text Sources
