. 2024 Jan 10:17:1316432.
doi: 10.3389/fncel.2023.1316432. eCollection 2023.

Impaired communication at the neuromotor axis during Degenerative Cervical Myelopathy

Affiliations

Impaired communication at the neuromotor axis during Degenerative Cervical Myelopathy

Jorge Ojeda et al. Front Cell Neurosci. .

Abstract

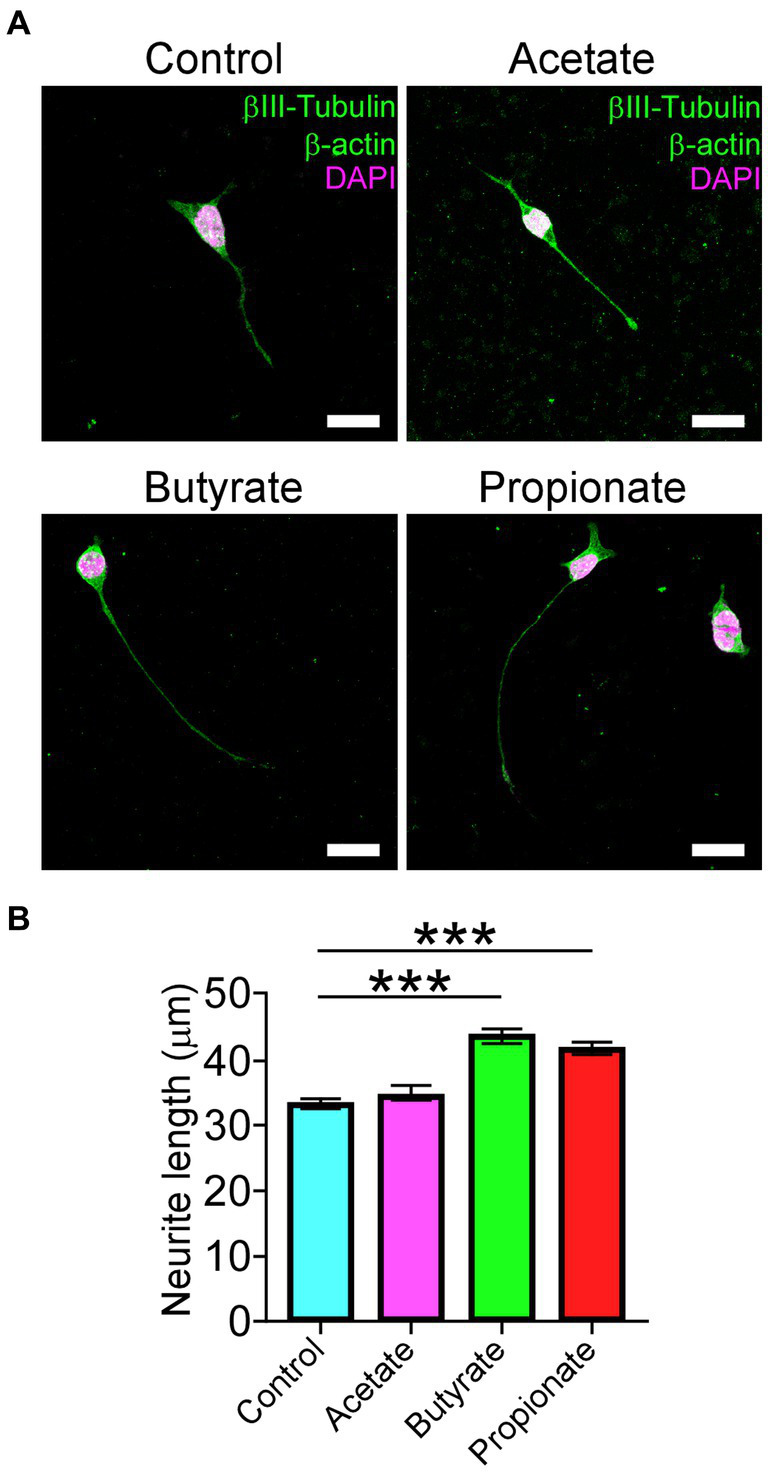
Degenerative Cervical Myelopathy (DCM) is a progressive neurological condition characterized by structural alterations in the cervical spine, resulting in compression of the spinal cord. While clinical manifestations of DCM are well-documented, numerous unanswered questions persist at the molecular and cellular levels. In this study, we sought to investigate the neuromotor axis during DCM. We use a clinically relevant mouse model, where after 3 months of DCM induction, the sensorimotor tests revealed a significant reduction in both locomotor activity and muscle strength compared to the control group. Immunohistochemical analyses showed alterations in the gross anatomy of the cervical spinal cord segment after DCM. These changes were concomitant with the loss of motoneurons and a decrease in the number of excitatory synaptic inputs within the spinal cord. Additionally, the DCM group exhibited a reduction in the endplate surface, which correlated with diminished presynaptic axon endings in the supraspinous muscles. Furthermore, the biceps brachii (BB) muscle exhibited signs of atrophy and impaired regenerative capacity, which inversely correlated with the transversal area of remnants of muscle fibers. Additionally, metabolic assessments in BB muscle indicated an increased proportion of oxidative skeletal muscle fibers. In line with the link between neuromotor disorders and gut alterations, DCM mice displayed smaller mucin granules in the mucosa layer without damage to the epithelial barrier in the colon. Notably, a shift in the abundance of microbiota phylum profiles reveals an elevated Firmicutes-to-Bacteroidetes ratio-a consistent hallmark of dysbiosis that correlates with alterations in gut microbiota-derived metabolites. Additionally, treatment with short-chain fatty acids stimulated the differentiation of the motoneuron-like NSC34 cell line. These findings shed light on the multifaceted nature of DCM, resembling a synaptopathy that disrupts cellular communication within the neuromotor axis while concurrently exerting influence on other systems. Notably, the colon emerges as a focal point, experiencing substantial perturbations in both mucosal barrier integrity and the delicate balance of intestinal microbiota.

Keywords: Degenerative Cervical Myelopathy; motoneuron; muscle; neuromuscular; spinal cord; synapse.


Conflict of interest statement

The authors declare that the research was conducted in the absence of any commercial or financial relationships that could be construed as a potential conflict of interest.

Figures

Figure 1
Figure 1
Diminished motor performance after DCM. Male DCM mice and their control mice were challenged to different motor tests abilities. (A) An illustrative example of the heatmap travel path during 5 minutes on the open field test to control and DCM mouse (scale bar: 50 mm). DCM mice were less active as measured in (B) total distance (control: 15844 ± 709 mm; DCM: 9904 ± 712 mm; p < 0.001 t-test; **p < 0.001), (C) maximum (control: 470.8 ± 39.4 mm/s; DCM: 294.3 ± 9.3 mm/s; **p < 0.0048 t-test) and (D) average (control: 52.8 ± 2.3 mm/s; DCM: 33.1 ± 2.4 mm/s; **p < 0.0012 t-test) speed. In turn, (E,F) pole test (control: 22.5 ± 3.7 s, DCM: 5.7 ± 0.4 s; *p < 0.0042 t-test, bar 8 mm), (G,H) weight test (control: 13.6 ± 2.9 s; DCM: 2.5 ± 0.5 s; ***p < 0.0071 t-test), and the (I,J) wire hang test (control: 17.0 ± 4.6 s; DCM: 4.5 ± 1.6 s; *p < 0.0452 t-test) confirm the motor deficit in the DCM group. Data are presented as mean ± s.e.m.; n = 4 per group.
Figure 2
Figure 2
The DCM mouse model presents remarkable histopathological alterations at the compression level. (A) Representative slices of C5-6 spinal cord transversal sections from control and DCM group were stained against choline acetyltransferase (ChAT; green), vesicular glutamate transporter 1 (VGLUT1; white), NeuN neuronal marker (red), and nuclei (DAPI; blue) to show the cellular organization and distribution of glutamatergic excitatory synaptic inputs (scale bar: 500 μm). (A, low panel). Zoomed images of control and DCM from the ventral horn show that motoneurons present cholinergic (green dots) and glutamatergic (white dots) synaptic inputs (scale bar: 25 μm). Graphs express the results of the (B) ratio between the antero-posterior (Y) and transversal (X) spinal cord length (control: 1.0 ± 0.03; DCM: 0.69 ± 0.06; *p < 0.0152 t-test), the (C) cross-sectional area of the spinal cord by the slice (control:16.2 ± 0.3 mm2; DCM: 10.3 ± 1.5 mm2; *p < 0.024 t-test), and the (D) number of motoneurons counted in 10 serial SC slices (control: 419 ± 6; DCM: 267 ± 39; *p < 0.023 t-test). Data are presented as mean ± s.e.m. and statistical analysis was performed using unpaired t-test; n control = 3, n DCM = 4.
Figure 3
Figure 3
Decreased cholinergic and glutamatergic excitatory synaptic inputs in the cervical spinal cord neurons after DCM. (A) Control and DCM mice were stained using antibodies against ChAT (magenta) and VGLUT1 (cyan), as is shown in the representative images (scale bar: 100 μm). Quantification of (B) VGLUT1-positive (control: 24 ± 2; DCM: 10 ± 1; **p < 0.0031 t-test) and (C) ChAT (control: 26 ± 3; DCM: 8 ± 1; **p < 0.0036 t-test) spinal neurons evidence a decrease of both synaptic inputs. Data are presented as mean ± s.e.m.; n control = 3, n DCM =4.
Figure 4
Figure 4
DCM causes neuromuscular impairment. (A) Whole mounted supraspinatus muscles were dissected and stained against neurofilament/SV2 (cyan) and αBTX (magenta; scale bar: 25 μm). The quantification of the morphometric analysis for the (B) area (control: 179.8 ± 5.0 μm2; DCM: 116.3 ± 7.0 μm2; **p < 0.0004 t-test) and (C) perimeter (control: 204.5 ± 6.9 μm; DCM: 143.5 ± 10.3 μm; **p < 0.0063 t-test) of the presynaptic axon terminal and the (D) area (control: 288.9 ± 18.9 μm2; DCM: 181.0 ± 9.1 μm2; **p < 0.0025 t-test) and (E) perimeter (control: 204.6 ± 11.8 μm; DCM: 152.9 ± 4.4 μm; **p < 0.058 t-test) for the postsynaptic endplate indicate that NMJs of DCM mice are smaller in comparison with the control group. Data are presented as mean ± s.e.m.; n control = 3, n DCM =4.
Figure 5
Figure 5
DCM impairs skeletal muscle tissue. (A) Cross sections of 20 μm from Control and DCM mice were stained against lectins with Alexa488-WGA (green) and nuclei with DAPI (magenta; scale bar: 500 μm and 25 μm, respectively). (B) The number of skeletal muscles fibers (control: 2601 ± 140; DCM: 1427 ± 309; *p < 0.0135 t-test) as well as the (C) CSA of skeletal muscle (control: 70.3 ± 12 mm2; DCM: 36.1 ± 4.6 mm2; *p < 0.0386 t-test) and the (D) number of central nuclei (control: 18 ± 2; DCM: 7 ± 1; ***p < 0.0008 t-test) as a parameter of muscle fiber damage/regeneration, the (E) CSA of skeletal muscle fibers (control: 1062 ± 95; DCM: 1497 ± 61; **p < 0.0086 t-test) and its (F) perimeter (control: 126.1 ± 6.2 μm; DCM: 152.0 ± 7.9 μm; *p < 0.042 t-test) were quantified. (G) Transversal cryosections stained with NADH-TR histochemical activity detection were used to analyze fast (light and big), intermediate (dark and big), and slow (dark and small) fibers. (H) The proportion of these fiber types was quantified and expressed as a percentage of total fibers of the muscles (control - DCM, type I: 24.7 ± 1.5–35.0 ± 3.9; type IIA: 29.8 ± 4.8–15.2 ± 2.3; type IIB: 45.4 ± 5.2–49.6 ± 5.1; *p < 0.02 and **p < 0.0011 ANOVA with Tukey’s correction). The results represent the mean ± s.e.m. of n: 4 mice per group.
Figure 6
Figure 6
The cervical spinal cord compression leads to disruption of the intestinal mucosal barrier. (A) Whole colon tissue (scale bar 10 mm) was examined from control and DCM mice, and the (B) cecum area (control: 89.2 ± 11.7 mm2; DCM: 94.5 ± 9.6 mm2; p < 0.74 t-test) and the (C) colon length (control: 59.6 ± 4.5 mm; DCM: 57.2 ± 8.2 mm; p < 0.82 t-test) size were analyzed in both groups. (D) Representative images of three mice per group show the integrity of the intestinal epithelial barrier in cross-sectional views at the proximal segment to the anus by staining against E-cadherin (white) and DAPI (magenta; scale bar: 200 μm). (E) Transversal sections of the colon (scale bar: 500 μm) from control and DCM stained with Alexa488-WGA (cyan) to detect mucous granules, E-cadherin antibody (white), and DAPI (magenta) reveal a reduced (F) area of mucous granules (cyan) at the mucosal layer (low panel in E, area and perimeter of granules in red and yellow, respectively; control: 128.2 ± 19.6 mm2; DCM: 67.4 ± 6.3 mm2; *p < 0.02 t-test). (G) The phylum profile ratio related to the relative abundance of Firmicutes and Bacteroidetes was quantified (control: 0.37 ± 0.07%; DCM: 0.74 ± 0.1%; *p < 0.043 t-test). Data are presented as mean ± s.e.m.; n control = 3, n DCM = 4 for B, C, and F; n control = 4, n DCM = 4 for G.
Figure 7
Figure 7
SCFAs promote the differentiation of motoneuron-like NSC34 cell lines. NSC34 cells were seeded on vitronectin and differentiated for 72 h. Fresh treatments with 200 μM of vehicle, acetate, butyrate, and propionate were performed every 12 h until the time of differentiation. After treatment, the differentiated cells were fixed in PFA 0.5% and stained against βIII-tubulin, β-actin, and DAPI, as shown in the (A) representative images. Quantification of (B) neurite length is shown (control: 33.2 ± 0.7 μm; acetate: 34.6 ± 1.0 μm; butyrate: 43.6 ± 1.2 μm; propionate: 41.7 ± 1.1 μm; ***p < 0.0001). Data are presented as mean ± s.e.m.

Similar articles

References

    1. Ahn J.-S., Lee J.-K., Kim B.-K. (2010). Prognostic factors that affect the surgical outcome of the laminoplasty in cervical spondylotic myelopathy. Clin. Orthop. Surg. 2, 98–104. doi: 10.4055/cios.2010.2.2.98, PMID: - DOI - PMC - PubMed
    1. Akter F., Kotter M. (2018). Pathobiology of degenerative cervical myelopathy. Neurosurg. Clin. 29, 13–19. doi: 10.1016/j.nec.2017.09.015, PMID: - DOI - PubMed
    1. Alkadhi S., Kunde D., Cheluvappa R., Randall-Demllo S., Eri R. (2014). The murine appendiceal microbiome is altered in spontaneous colitis and its pathological progression. Gut Pathogens 6, 1–10. doi: 10.1186/1757-4749-6-25 - DOI - PMC - PubMed
    1. An J., Kwon H., Kim Y. J. (2023). The firmicutes/bacteroidetes ratio as a risk factor of breast cancer. J. Clin. Med. 12:2216. - PMC - PubMed
    1. Arredondo C., Cefaliello C., Dyrda A., Jury N., Martinez P., Díaz I., et al. . (2022). Excessive release of inorganic polyphosphate by ALS/FTD astrocytes causes non-cell-autonomous toxicity to motoneurons. Neuron 110, 1656–1670.e12. doi: 10.1016/j.neuron.2022.02.010, PMID: - DOI - PMC - PubMed

LinkOut - more resources