

Using Single-Species and Whole Community Stream Mesocosm Exposures for Identifying Major Ion Effects in Doses Mimicking Resource Extraction Wastewaters
- PMID: 38269364
- PMCID: PMC10807236
- DOI: 10.3390/w15020249
Using Single-Species and Whole Community Stream Mesocosm Exposures for Identifying Major Ion Effects in Doses Mimicking Resource Extraction Wastewaters
Abstract
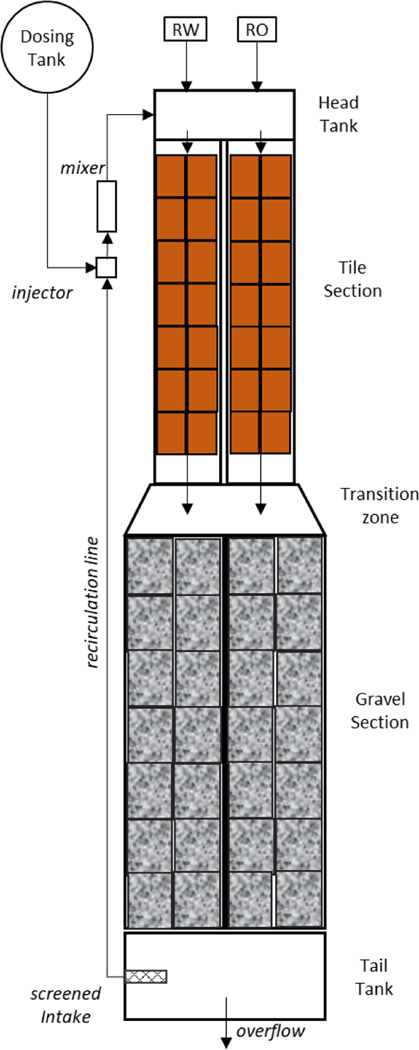
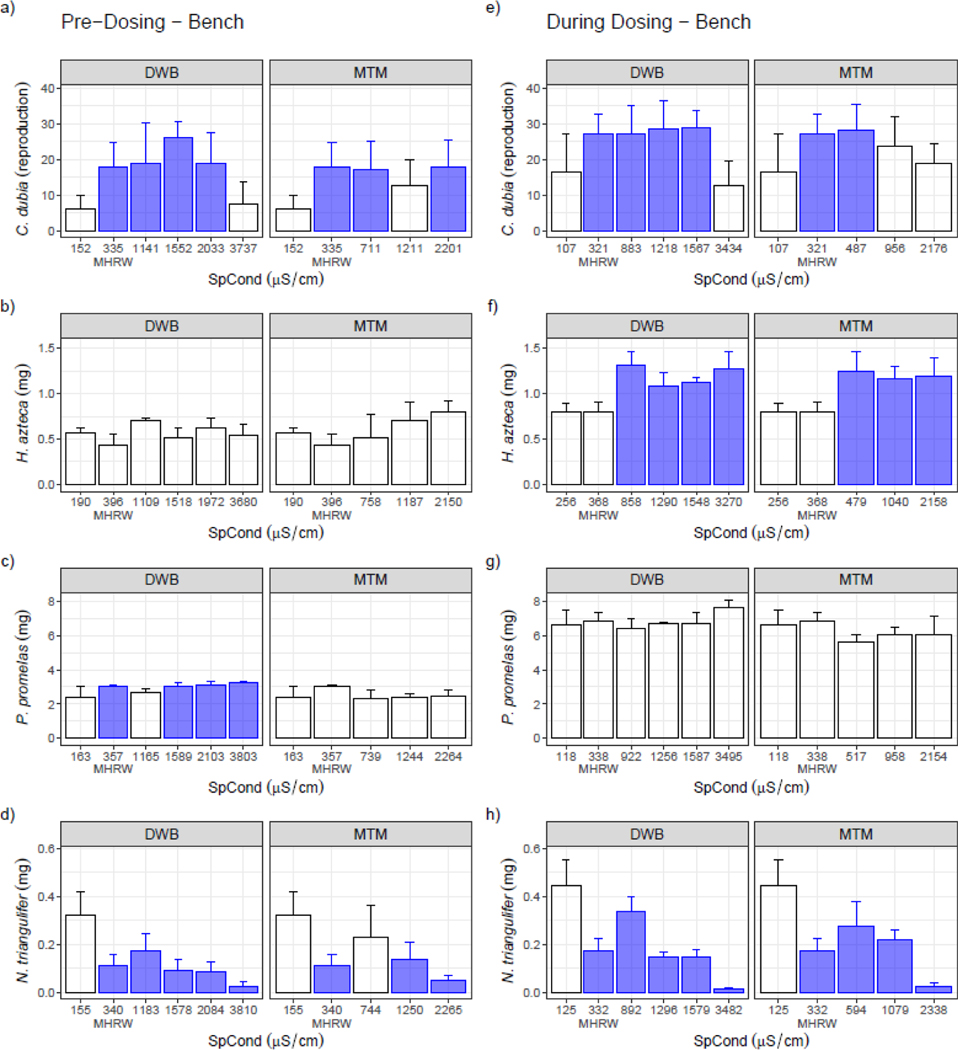
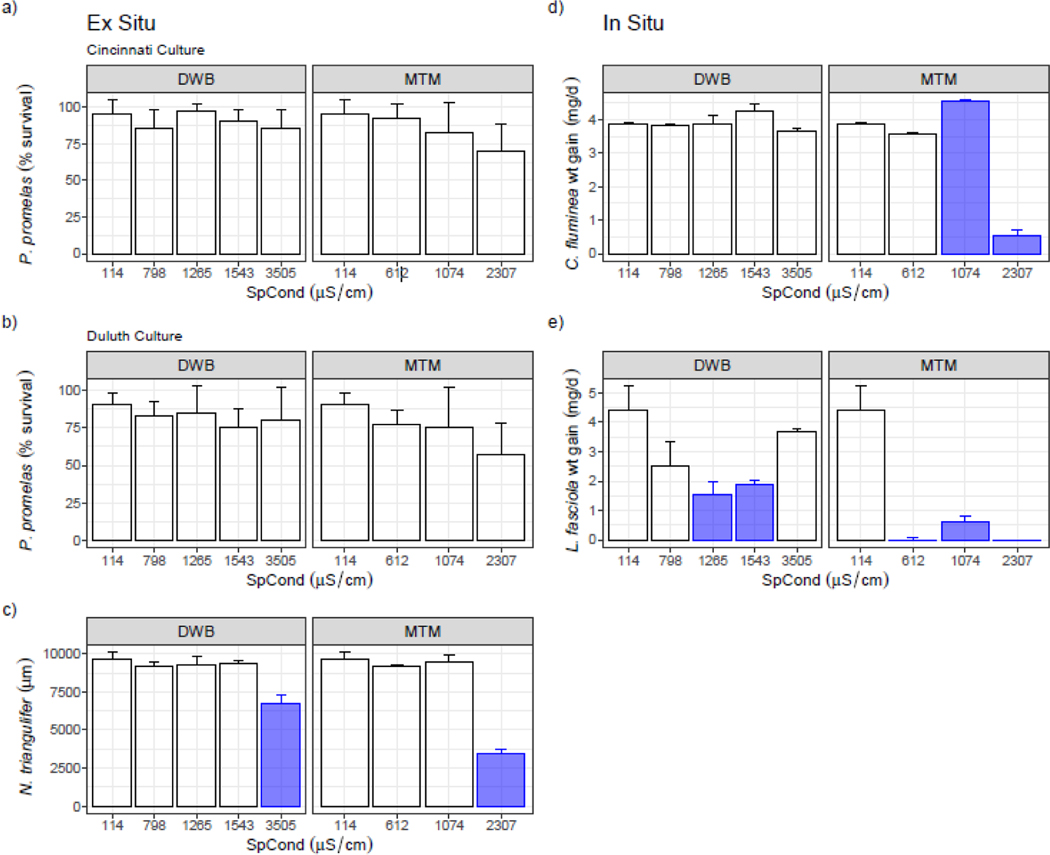
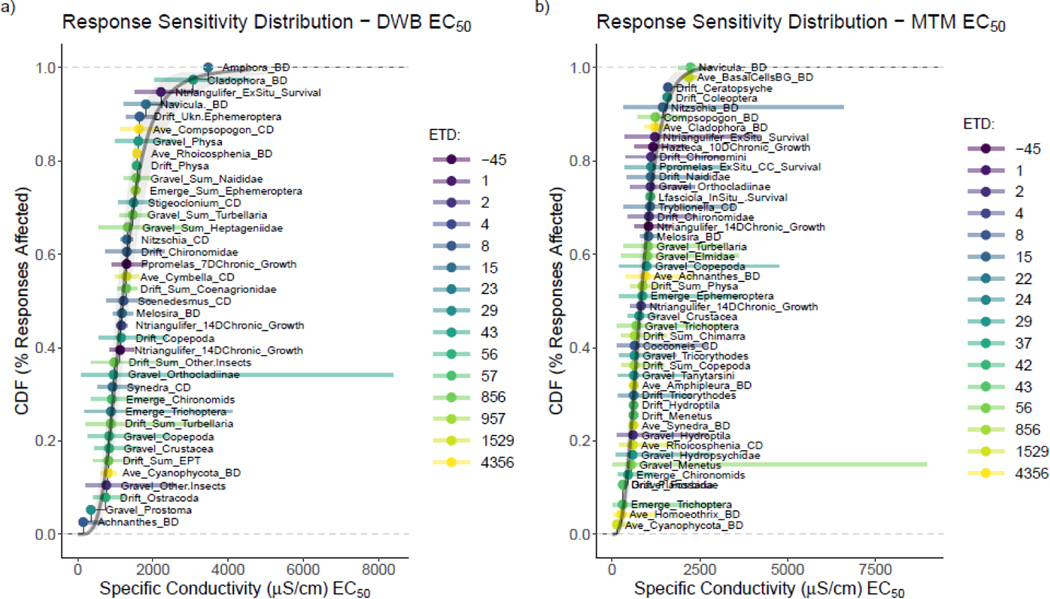
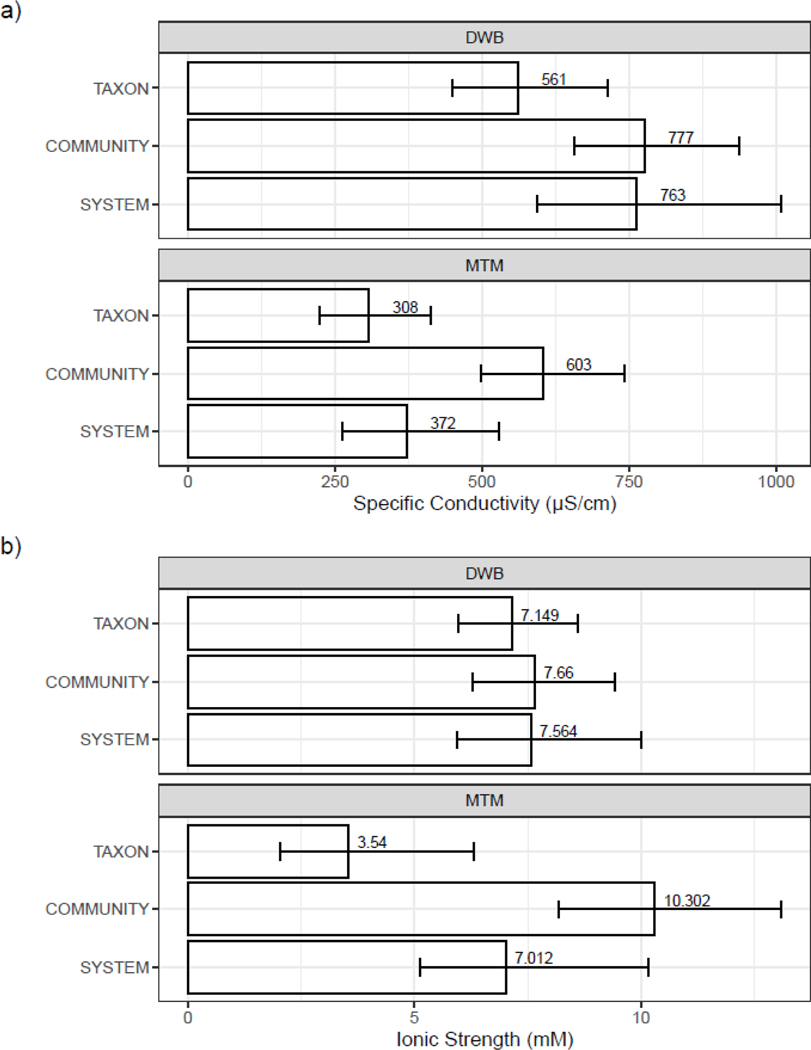
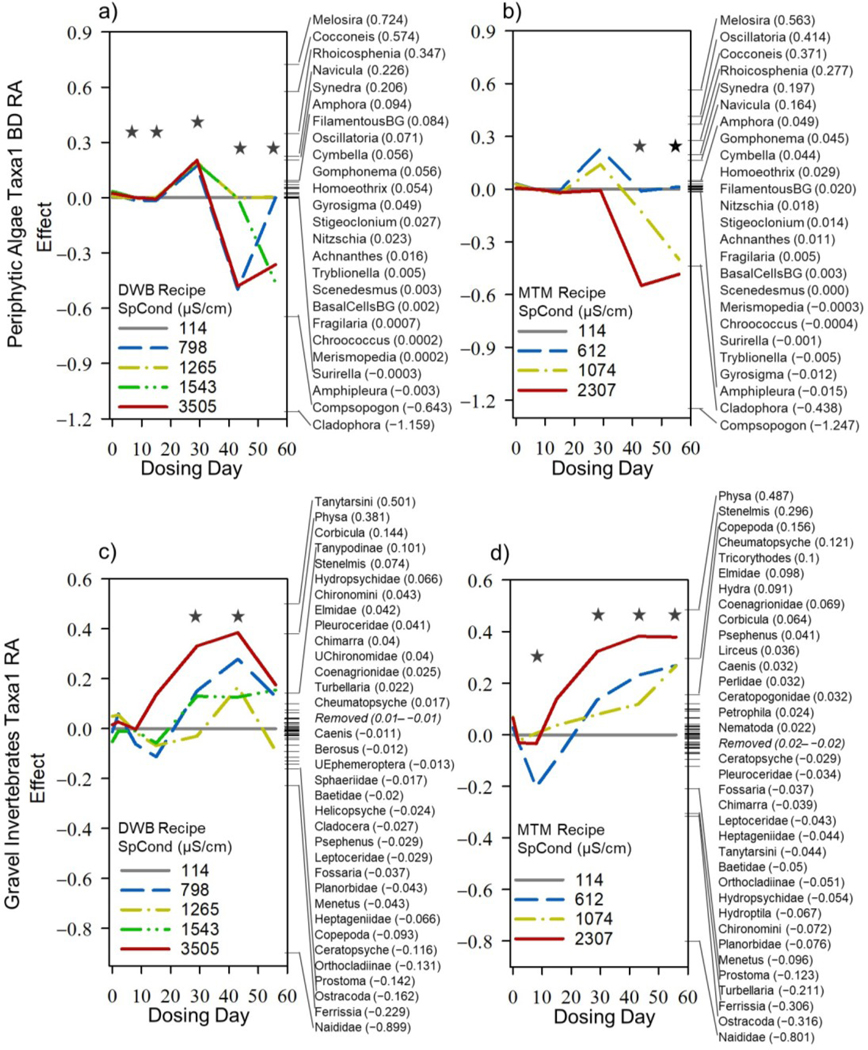
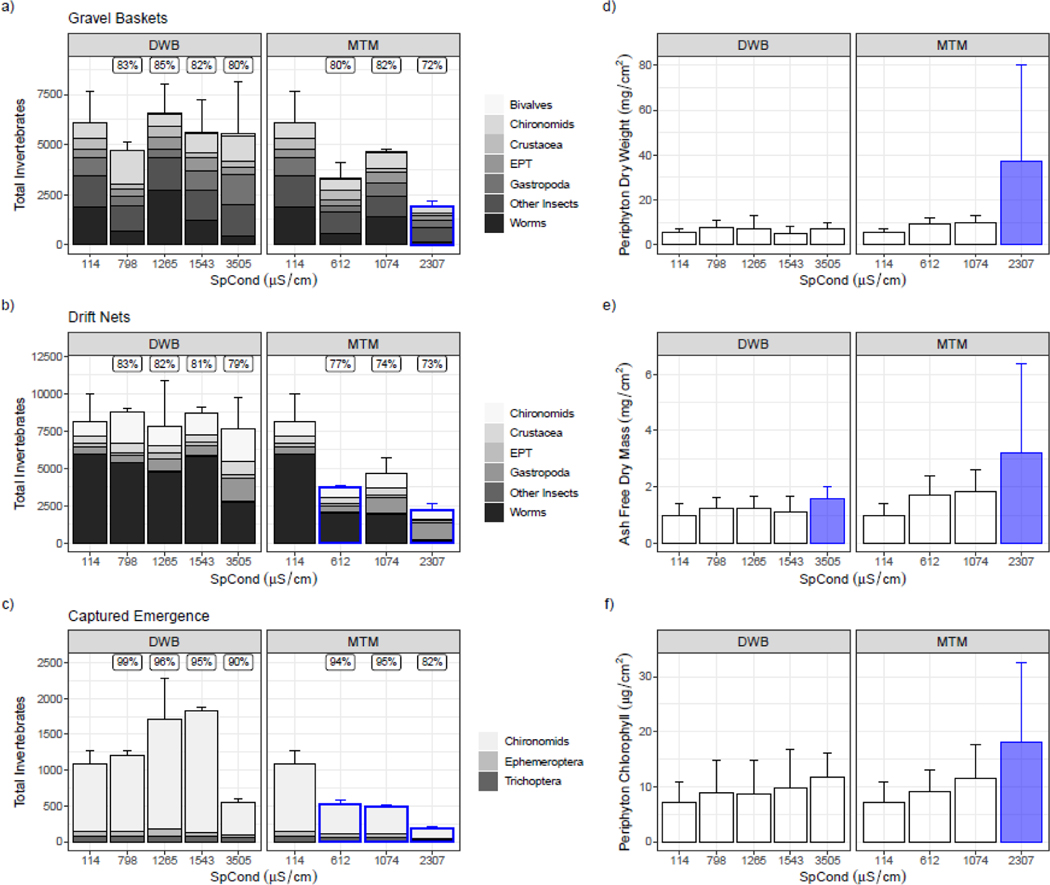
Wastewaters and leachates from various inland resource extraction activities contain high ionic concentrations and differ in ionic composition, which complicates the understanding and effective management of their relative risks to stream ecosystems. To this end, we conducted a stream mesocosm dose-response experiment using two dosing recipes prepared from industrial salts. One recipe was designed to generally reflect the major ion composition of deep well brines (DWB) produced from gas wells (primarily Na+, Ca2+, and Cl-) and the other, the major ion composition of mountaintop mining (MTM) leachates from coal extraction operations (using salts dissociating to Ca2+, Mg2+, Na+, SO42- and HCO3-)-both sources being extensive in the Central Appalachians of the USA. The recipes were dosed at environmentally relevant nominal concentrations of total dissolved solids (TDS) spanning 100 to 2000 mg/L for 43 d under continuous flow-through conditions. The colonizing native algal periphyton and benthic invertebrates comprising the mesocosm ecology were assessed with response sensitivity distributions (RSDs) and hazard concentrations (HCs) at the taxa, community (as assemblages), and system (as primary and secondary production) levels. Single-species toxicity tests were run with the same recipes. Dosing the MTM recipe resulted in a significant loss of secondary production and invertebrate taxa assemblages that diverged from the control at all concentrations tested. Comparatively, intermediate doses of the DWB recipe had little consequence or increased secondary production (for emergence only) and had assemblages less different from the control. Only the highest dose of the DWB recipe had a negative impact on certain ecologies. The MTM recipe appeared more toxic, but overall, for both types of resource extraction wastewaters, the mesocosm responses suggested significant changes in stream ecology would not be expected for specific conductivity below 300 µS/cm, a published aquatic life benchmark suggested for the region.
Keywords: Marcellus shale; algal periphyton; ionic strength; mesocosms; mountain top mining; periphyton; salinity; specific conductivity; stream invertebrates; total dissolved solids; water quality.
Conflict of interest statement
Conflicts of Interest: The authors declare no conflict of interest.
Figures

References
-
- Goodfellow WL; Ausley LW; Burton DT; Denton DL; Dorn PB; Grothe DR; Heber MA; Norberg-King TJ; Rodgers JH. Major ion toxicity in effluents: A review with permitting recommendations. Environ. Toxicol. Chem. 2000, 19, 175–182.
-
- Govenor H; Krometis LAH; Willis L; Angermeier PL; Hession WC. Macroinvertebrate sensitivity thresholds for sediment in Virginia streams. Integr. Environ. Assess. Manag. 2019, 15, 77–92. - PubMed
-
- Cook NA; Sarver EA; Krometis LH; Huang J. Habitat and water quality as drivers of ecological system health in Central Appalachia. Ecol. Eng. 2015, 84, 180–189.
-
- Timpano AJ; Schoenholtz SH; Soucek DJ; Zipper CE. Benthic macroinvertebrate community response to salinization in headwater streams in Appalachia USA over multiple years. Ecol. Indic. 2018, 91, 645–656.
-
- Clements WH; Kotalik C. Effects of major ions on natural benthic communities: An experimental assessment of the US Environmental Protection Agency aquatic life benchmark for conductivity. Freshw. Sci. 2016, 35, 126–138.
Grants and funding
LinkOut - more resources
Full Text Sources
Miscellaneous