

doi: 10.3201/eid3002.230342.
Power Law for Estimating Underdetection of Foodborne Disease Outbreaks, United States
- PMID: 38270126
- PMCID: PMC10826756
- DOI: 10.3201/eid3002.230342
Item in Clipboard
Power Law for Estimating Underdetection of Foodborne Disease Outbreaks, United States
Emerg Infect Dis.
2023 Feb.
Abstract
We fit a power law distribution to US foodborne disease outbreaks to assess underdetection and underreporting. We predicted that 788 fewer than expected small outbreaks were identified annually during 1998-2017 and 365 fewer during 2018-2019, after whole-genome sequencing was implemented. Power law can help assess effectiveness of public health interventions.
Keywords: United States; disease outbreaks; food safety; foodborne diseases; foodborne outbreaks; public health surveillance; statistical distributions.
Figures
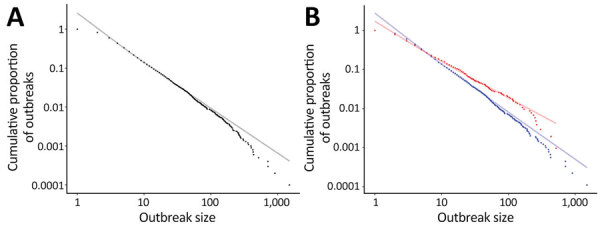
Log-log scale of foodborne outbreak size versus frequency from a power law for estimating underdetection of foodborne disease outbreaks, United States. A) Actual (black points) versus expected from the power law distribution (gray line) 1998–2017; B) actual (blue points) versus expected (light blue line) 1998–2019 and actual (red points) versus expected (light red line) 2018–2019. Estimates for the difference between the number of expected and actual small (<10 cases) and large (>100 cases) outbreaks were calculated by the sum of the differences between each of the relevant actual points and the expected line at the same x-value. Annual estimates were then calculated by dividing the number of years represented.
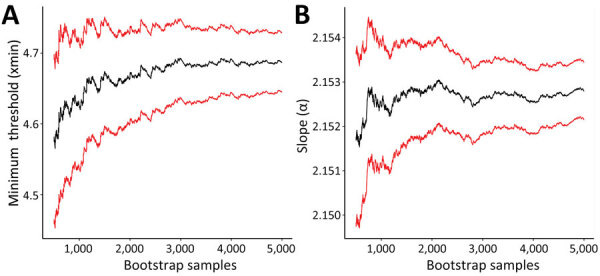
Parameter estimates from a power law for estimating underdetection of foodborne disease outbreaks, United States. Graphs display distribution of foodborne outbreak size and frequency for the minimum threshold (A) and slope (B) for outbreaks during 1998–2019. Black lines represent bootstrapped parameter estimate; red lines represent 90% credible intervals.
References
-
- Centers for Disease Control and Prevention (CDC). Surveillance for foodborne disease outbreaks, United States, 2015, annual report. Atlanta: US Department of Health and Human Services, CDC; 2017.
-
- Centers for Disease Control and Prevention (CDC). Surveillance for foodborne disease outbreaks, United States, 2016, annual report. Atlanta: US Department of Health and Human Services, CDC; 2018.
-
- Centers for Disease Control and Prevention (CDC). Surveillance for foodborne disease outbreaks, United States, 2017, annual report. Atlanta: US Department of Health and Human Services, CDC; 2019.
Publication types
MeSH terms
LinkOut - more resources
Full Text Sources
Medical
