. 2024 Mar 4;223(3):e202305087.
doi: 10.1083/jcb.202305087. Epub 2024 Jan 25.

CLPB disaggregase dysfunction impacts the functional integrity of the proteolytic SPY complex

Affiliations

CLPB disaggregase dysfunction impacts the functional integrity of the proteolytic SPY complex

Megan J Baker et al. J Cell Biol. .

Abstract

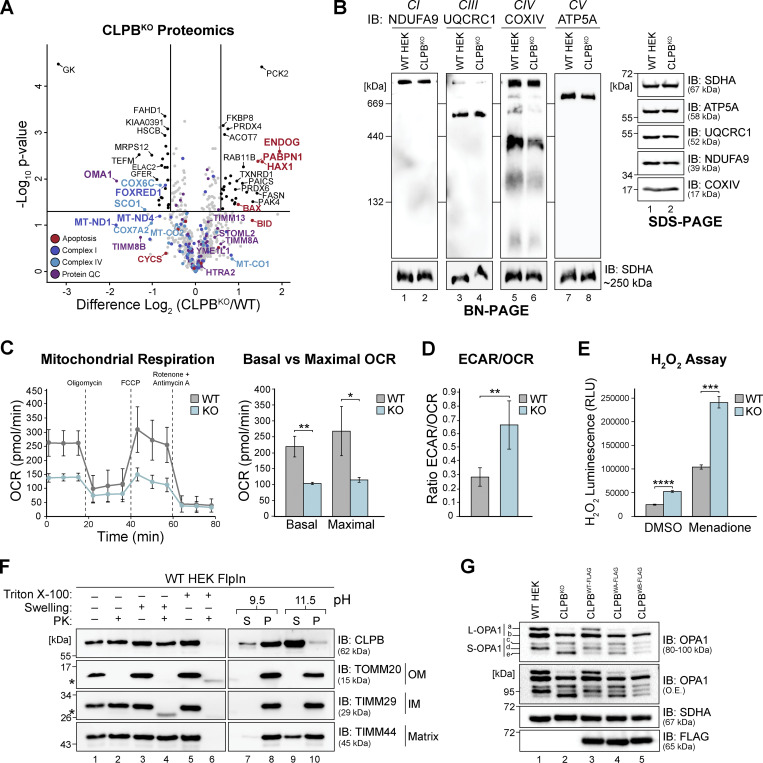
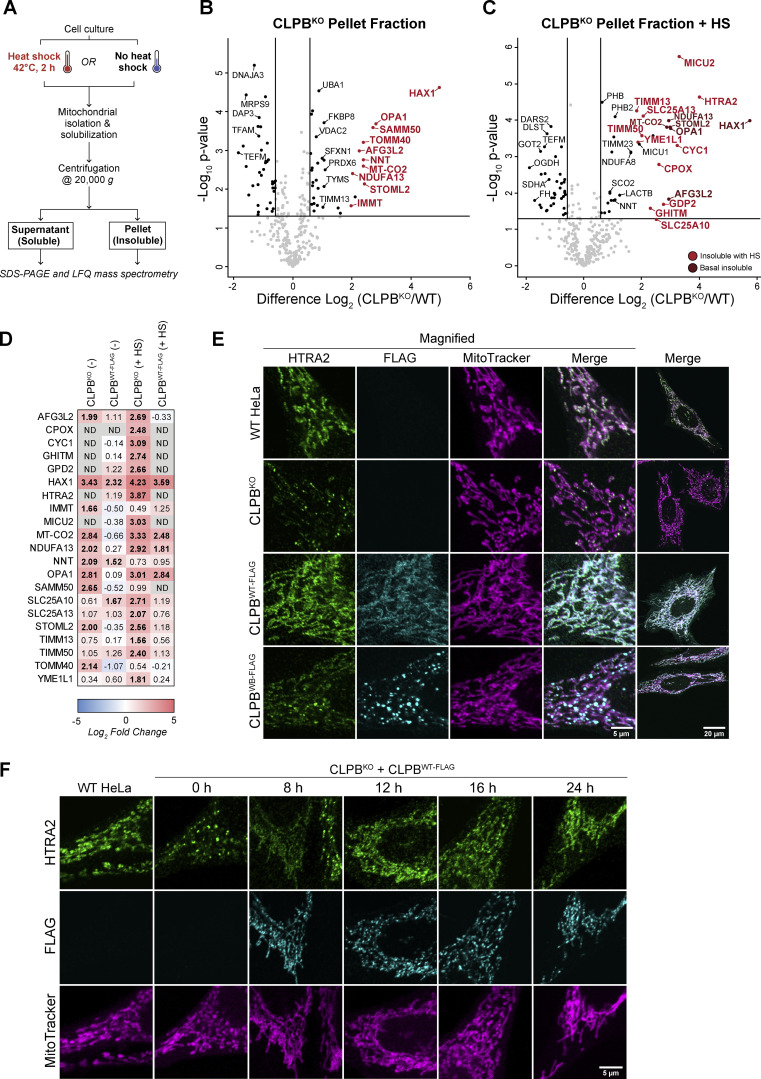
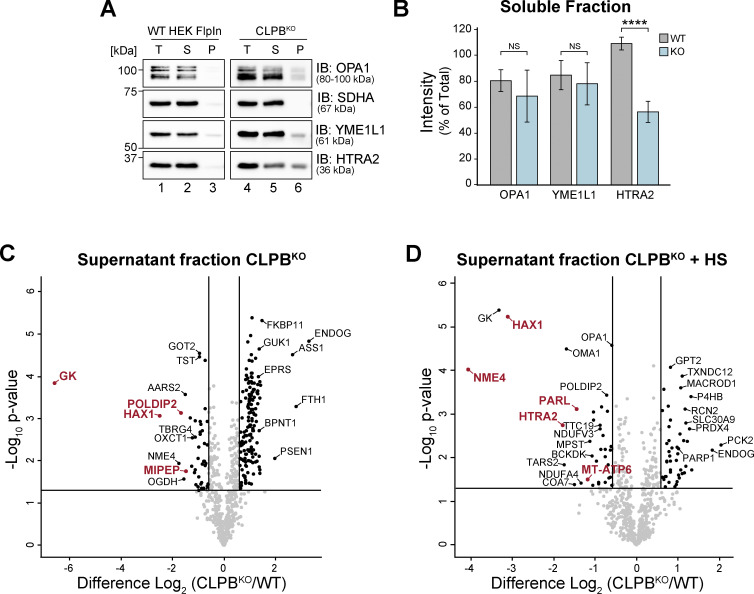
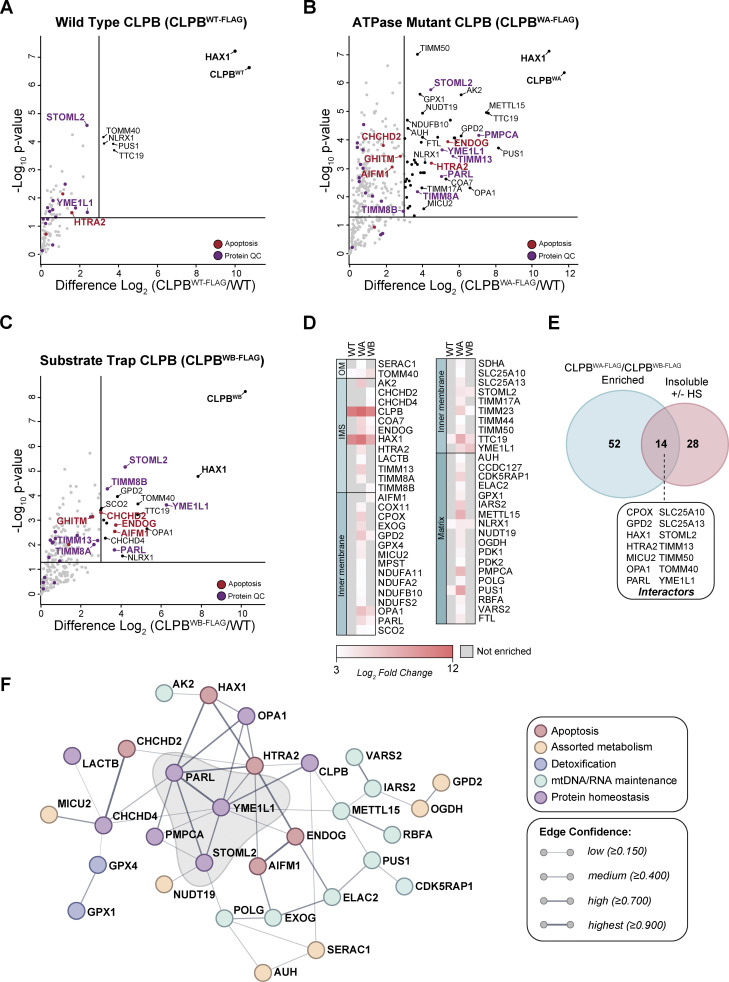
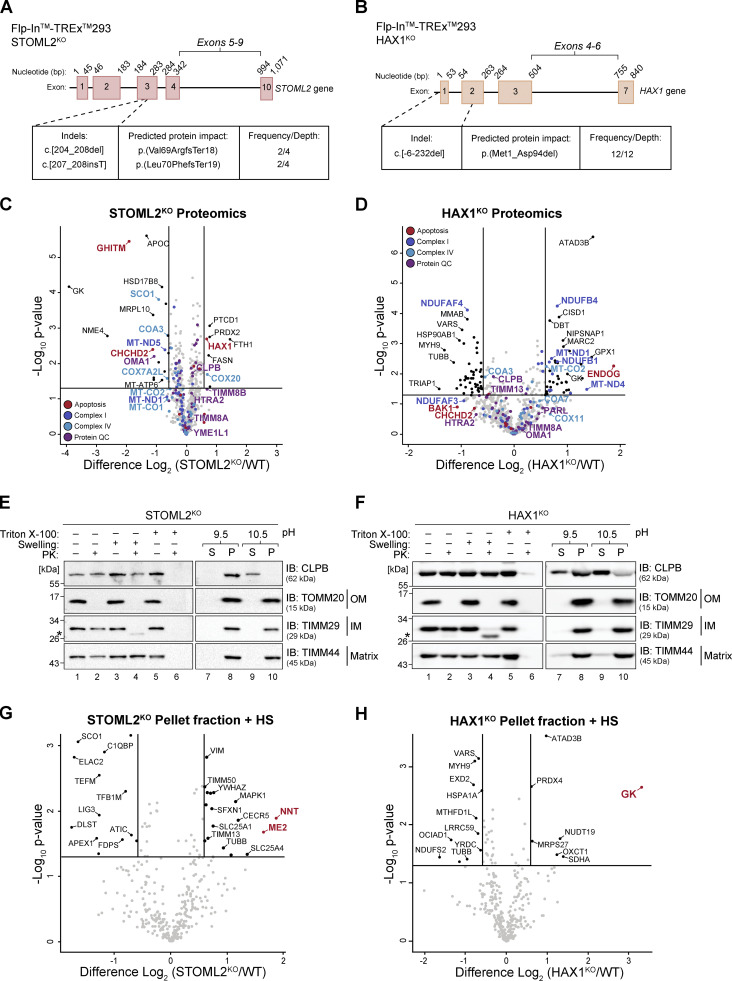
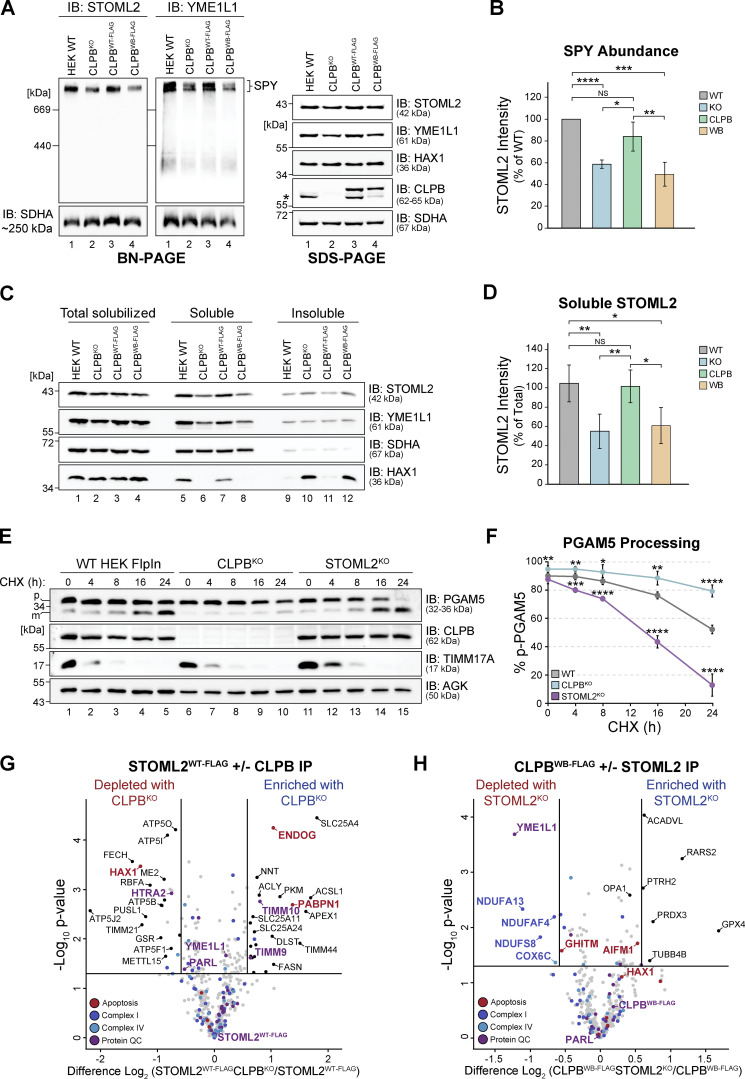
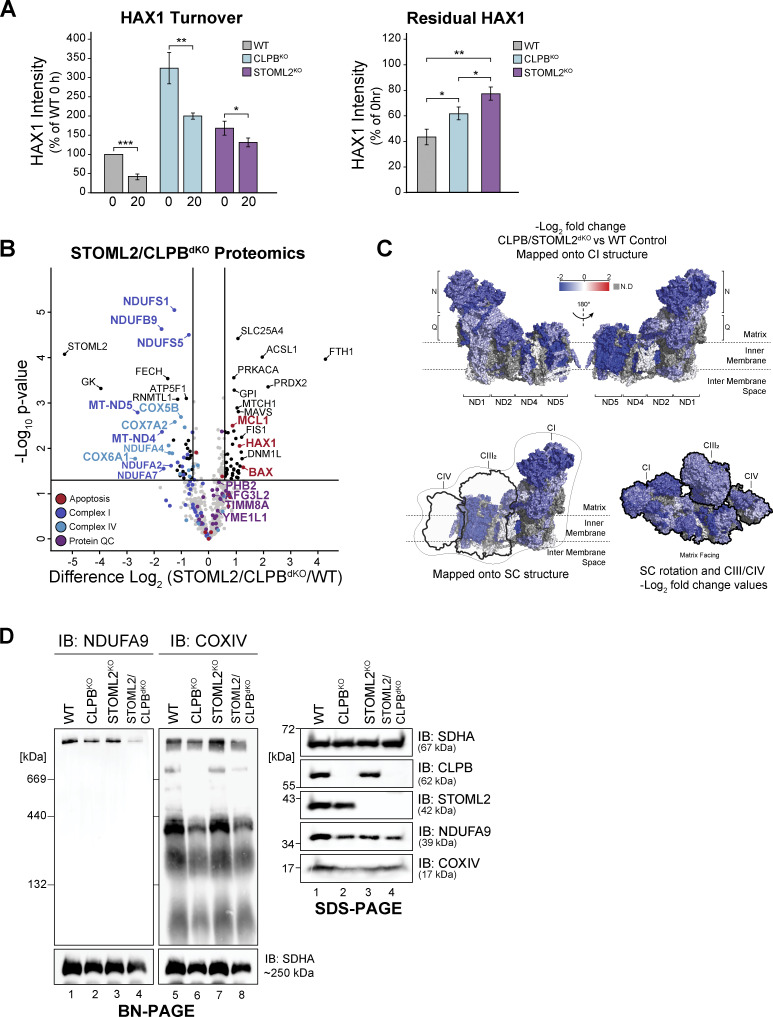
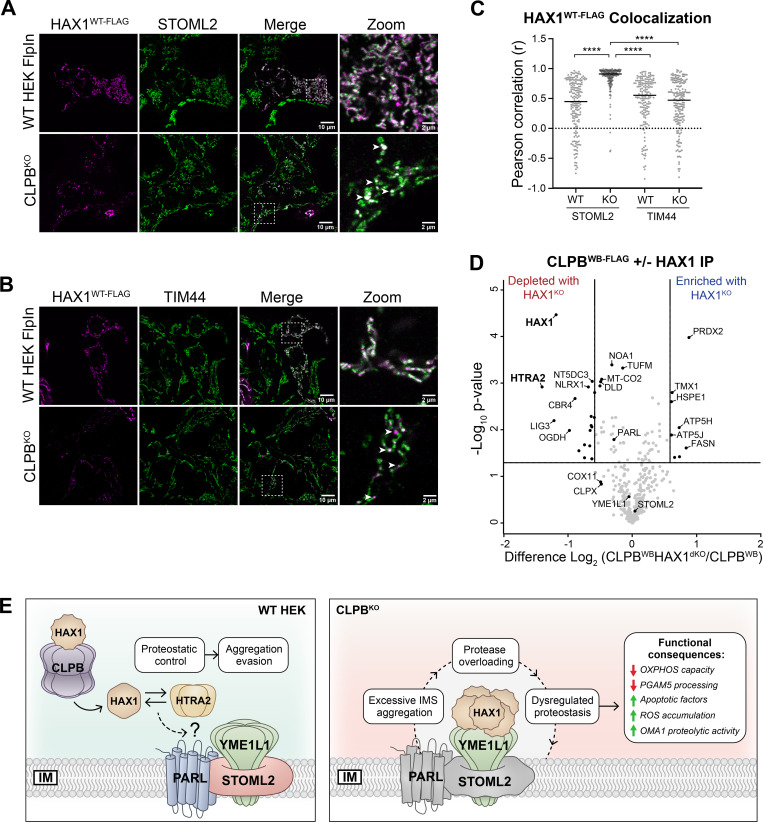
CLPB is a mitochondrial intermembrane space AAA+ domain-containing disaggregase. CLPB mutations are associated with 3-methylglutaconic aciduria and neutropenia; however, the molecular mechanism underscoring disease and the contribution of CLPB substrates to disease pathology remains unknown. Interactions between CLPB and mitochondrial quality control (QC) factors, including PARL and OPA1, have been reported, hinting at dysregulation of organelle QC in disease. Utilizing proteomic and biochemical approaches, we show a stress-specific aggregation phenotype in a CLPB-null environment and define the CLPB substrate profile. We illustrate an interplay between intermembrane space proteins including CLPB, HAX1, HTRA2, and the inner membrane quality control proteins (STOML2, PARL, YME1L1; SPY complex), with CLPB deficiency impeding SPY complex function by virtue of protein aggregation in the intermembrane space. We conclude that there is an interdependency of mitochondrial QC components at the intermembrane space/inner membrane interface, and perturbations to this network may underscore CLPB disease pathology.


Conflict of interest statement

Disclosures: The authors declare no competing interests exist.

Figures

Figure S1.
Figure S1.
Mutation of Walker A or B motifs may impact CLPB localization. (A) Schematic representation of indels present in the CLPBKO HEK FlpIn-TREx cell line (Clone #4), introduced using CRISPR-Cas9 genome editing, according to CLPB transcript variant 1 (NM_030813.6). Exon 1 is shared by all CLPB variants. (B) Schematic representation of CLPB domain architecture, with relative positions of Walker A (K387A) and Walker B (E455Q) mutant loci indicated within the NBD. MTS, mitochondrial targeting signal; TMD, transmembrane domain. (C–E) Mitochondria were isolated from (C) CLPBWT-FLAG, (D) CLPBWA-FLAG, and (E) CLPBWB-FLAG stable cell lines and treated for sub-fractionation of the mitochondrial compartments (left), and carbonate extraction (right). Samples were run on SDS-PAGE and analyzed via immunoblotting (IB). * = protease protected protein. S = supernatant, P = pellet. (F) Schematic depicting processing of L-OPA1 splice variants 1 (b) and 7 (a) (Sp1/7). OMA1 cleavage of L-OPA1 a or b at S1 yields S-OPA1 c and e splice variants, respectively. Subsequent processing by YME1L1 at S2 of c-form S-OPA1 yields d-form S-OPA1. MTS = mitochondrial targeting sequence. TM = transmembrane domain. GED = GTPase effector domain. Figure adapted from Baker et al. (2014). Source data are available for this figure: SourceData FS1.
Figure 1.
Figure 1.
Loss of CLPB influences mitochondrial health. (A) Mitochondria were isolated from control and CLPBKO cells and subjected to LFQ MS. Data are presented as a volcano plot depicting the level of proteins in CLPBKO relative to control (n = 3). Proteins above the horizontal cutoff (P value <0.05, Student's t test) and outside of either vertical line (1.5-fold absolute change) are regarded as significantly altered in abundance. Functional annotations correspond to MitoCarta 3.0 categorization. (B) Mitochondria were isolated from control and CLPBKO cells and prepared for BN-PAGE (left) and SDS-PAGE (right). For BN-PAGE analysis, mitochondria were solubilized in digitonin-containing buffer and separated on a 4–16% acrylamide BN-PAGE gel, followed by immunoblotting (IB) with the indicated antibodies. For SDS-PAGE, mitochondrial pellets were resuspended in SDS-containing loading buffer and run on a 10–16% acrylamide tris-tricine gel followed by immunoblotting with the indicated antibodies. (C) OCRs were quantified in control and CLPBKO cells using a Seahorse analyzer. Left: Oligomycin, FCCP, and antimycin A/rotenone were added at the indicated time points to measure basal, maximal, and non-mitochondrial respiration rates. Right: Calculated basal and maximal OCR rates. Data averaged over three independent experiments. Error bars represent mean ± SD (n = 3), two-sample t test; *P < 0.05, **P < 0.01. (D) ECAR (mpH/min)/OCR (pmol/min) ratio calculations as obtained in C. Error bars represent mean ± SD (n = 3), two-sample t test; **P < 0.01. (E) Measurement of H2O2 ROS in control and CLPBKO cell lines after a 2 h vehicle (DMSO) or 10 µM menadione pre-treatment. Error bars represent mean ± SD (n = 3 for both vehicle and menadione treated). Two-sample t test; ***P < 0.001. ****P < 0.0001. (F) Mitochondrial sub-fractionation (lanes 1–6) and carbonate extraction (lanes 7–10) on mitochondria isolated from HEK wild-type cells to examine endogenous CLPB localization. Samples were run on a 10–16% acrylamide tris-tricine gel and immunoblotted with the indicated antibodies. S = supernatant, P = pellet. TOMM20 = OM localized control, TIMM29 = IM localized control, TIMM44 = matrix localized control, * = protease protected protein. (G) OPA1 processing in control, CLPBKO, and induced CLPBWT-FLAG, CLPBWA-FLAG, and CLPBWB-FLAG cell lines. Isolated mitochondria were run on a 8–10% acrylamide tris-tricine gel and and immunoblotted with antibodies as indicated. Stable cell lines were induced with 0.1 µg/ml tetracycline for 14 h prior to mitochondrial isolation. Source data are available for this figure: SourceData F1.
Figure 2.
Figure 2.
CLPB deficiency triggers excessive protein aggregation. (A) Schematic representation of the aggregation assay pipeline utilized in this study. (B and C) Protein insolubility in CLPBKO without (B) and with (C) heat shock (+HS). Isolated mitochondria from control and CLPBKO cells (untreated or following a 2 h HS at 42°C) were prepared for LFQ MS as outlined in A. Data is presented as a volcano plot depicting the level of proteins in the CLPBKO pellets relative to control (n = 3). Proteins above the horizontal cutoff (P value <0.05, Student's t test) and outside of either vertical line (1.5-fold absolute change) are regarded as significantly altered in abundance. To correct for anticipated differences in protein abundance within CLPBKO, data were normalized against CLPBKO proteomics (Fig. 1 A and Table S3). Proteins labeled in red had a fold difference >1.5 following normalization and are regarded as most strongly insoluble. Proteins labeled in dark red in C are also identified as insoluble in B. (D) Fold change comparison between proteins identified in the pellet fraction of: CLPBKO (−HS) (B), CLPBWT-FLAG (−HS), CLPBKO (+HS) (C), and CLPBWT-FLAG (+HS) following normalization to CLPBKO proteomics (Fig. 1 A and Table S3). The CLPBWT-FLAG stable cell line was induced with 0.1 µg/ml tetracycline for 12 h prior to immediate HS, or 14 h without HS. Values in bold are “strongly insoluble,” with fold difference >1.5 following normalization to CLPBKO proteomics. ND = not detected. (E) Immunofluorescence imaging reveals discrete HTRA2 foci in HeLa CLPBKO cells. HeLa control, CLPBKO, and CLPBKO cells stably expressing CLPBWT-FLAG or CLPBWB-FLAG were stained with MitoTracker Deep Red (magenta) and subjected to immunofluorescence analysis with antibodies directed against HTRA2 (green) and FLAG (cyan). Scale bar is equivalent to 20 or 5 µM (magnified) as indicated. (F) Monitoring HTRA2 foci clearance following CLPBWT-FLAG re-expression in HeLa CLPBKO background. CLPBWT-FLAG was transiently expressed in control and CLPBKO HeLa for indicated time points. Cells were stained with MitoTracker Deep Red (magenta) and subjected to immunofluorescence analysis with antibodies directed against HTRA2 (green) and FLAG (cyan). Scale bar is equivalent to 5 µM.
Figure S2.
Figure S2.
Aggregation-prone proteins are lost from corresponding CLPBKO soluble fractions. (A) Mitochondria (50 µg pellets) isolated from control and CLPBKO were solubilized in Triton X-100 containing buffer (in duplicate) and incubated prior to fractionation. Samples were run on a 10–16% tris-tricine gel followed by immunoblotting (IB) with indicated antibodies. S = supernatant, P = pellet. (B) Quantification of protein abundance in the respective soluble fraction as in A. Calculated as mean percentage ± SD of total for each protein, normalized to the level of succinate dehydrogenase (complex II) subunit A (SDHA). Significance determined by Student’s two-sample t test (n = 3). ****P < 0.0001, NS = not significant, P > 0.05. (C and D) Supernatant fractions corresponding to (C) basal and (D) + HS aggregation assay pellet data from Fig. 2, B and C, respectively. Data are presented as a volcano plot depicting the level of proteins in the CLPBKO supernatants relative to control (n = 3). Proteins above the horizontal cutoff (P value <0.05, Student's t test) and outside of either vertical line (1.5-fold absolute change) are regarded as significantly altered in abundance. To correct for anticipated differences in protein abundance within the CLPBKO cell line, data were normalized against CLPBKO proteomics (Fig. 1 A and Table S3). Proteins labeled in red had a fold difference >1.5 following normalization and are regarded as most depleted from the soluble fraction. Source data are available for this figure: SourceData FS2.
Figure 3.
Figure 3.
Defining the CLPB interactome and substrate profile. (A–C) Mitochondria were isolated from control, (A) CLPBWT-FLAG, (B) CLPBWA-FLAG, or (C) CLPBWB-FLAG stable cell lines following 14 h induction with 0.1 µg/ml tetracycline. Samples were processed for FLAG IP and eluates were prepared for LFQ MS. Data are presented as a volcano plot depicting the level of enrichment relative to control (n = 3). Proteins above the horizontal cutoff (P value <0.05, Student's t test) and to the right of the vertical line (eight-fold absolute change) are regarded as significantly enriched. Functional annotations correspond to MitoCarta 3.0 categorization. (D) Table containing all significantly enriched proteins across CLPBWT-FLAG (WT), CLPBWA-FLAG (WA), and CLPBWB-FLAG (WB) IP datasets with corresponding fold change across each experiment. Mitochondrial compartmentalization is listed according to MitoCarta 3.0 categorization. HAX1, HTRA2, TIMM13, TIMM8A, and TIMM8B were manually assigned to the IMS. (E) Venn diagram of all detected CLPBWA-FLAG and CLPBWB-FLAG interacting proteins against all proteins that were predominantly more insoluble in CLPBKO with or without HS. Proteins common to both groups are defined as CLPB interactors. (F) Visualization of common interacting partners between CLPBWA-FLAG and CLPBWB-FLAG IP datasets using the STRING database webtool (Szklarczyk et al., 2019). All active interaction sources were utilized. Functional annotations correspond to MitoCarta 3.0 categorization, and proteins with “import” or “OXPHOS” annotations have been excluded for clarity.
Figure S3.
Figure S3.
Neither STOML2KO or HAX1KO impede CLPB localization or disaggregase activity. (A) Schematic representation of indels present in the STOML2KO HEK FlpIn-TREx cell line, introduced using CRISPR-Cas9 genome editing, according to STOML2 transcript variant 1 (NM_013442.3). Exon 3 is shared by all STOML2 variants. (B) Schematic representation of the homozygous indel present in the HAX1KO HEK FlpIn-TREx cell line, introduced using CRISPR-Cas9 genome editing, according to HAX1 transcript variant 1 (NM_006118.4). This mutation impacts both HAX1 isoforms a and b. (C and D) STOML2KO and HAX1KO HEK mitochondrial proteomics. Mitochondria were isolated from control and (C) STOML2KO or (D) HAX1KO HEK cell lines and subjected to LFQ MS. Data are presented as a volcano plot depicting the level of proteins in (C) STOML2KO or (D) HAX1KO relative to control (n = 3). Proteins above the horizontal cutoff (P value <0.05, Student's t test) and outside of either vertical line (1.5-fold absolute change) are regarded as significantly altered in abundance. Functional annotations correspond to MitoCarta 3.0 categorization. (E and F) Mitochondrial sub-fractionation and carbonate extraction on mitochondria isolated from (E) STOML2KO cells and (F) HAX1KO cells to examine endogenous CLPB localization. Samples were run a 10–16% acrylamide tris-tricine gel and analyzed via immunoblotting (IB). * = protease protected protein. S = supernatant, P = pellet. (G and H) STOML2KO or (H) HAX1KO cells were exposed to heat shock (HS) for 2 h at 42°C and pellet fractions (insoluble proteins) were prepared for LFQ MS as outlined in Fig. 2 A. Data is presented as a volcano plot depicting the level of proteins in the STOML2KO pellet relative to control (n = 3). Proteins above the horizontal cutoff (P value <0.05, Student's t test) and outside of either vertical line (1.5-fold absolute change) are regarded as significantly altered in abundance. To correct for anticipated differences in protein abundance within the STOML2KO or HAX1KO, data were normalized against STOML2KO mitochondrial proteomics (Fig. S3 C and Table S3) or HAX1KO mitochondrial proteomics (Fig. S3 D and Table S3). Proteins labeled in red had a fold difference >1.5 following normalization and are regarded as most strongly insoluble. Source data are available for this figure: SourceData FS3.
Figure S4.
Figure S4.
SPY complex instability is specific to CLPBKO. (A) Mitochondria from control, CLPBKO, HAX1KO, and STOML2KO were resuspended in solubilization buffer containing 1% digitonin. Lysates were run on a 4–16% acrylamide BN-PAGE gel and analyzed by immunoblotting (IB) with an anti-STOML2 antibody to assess integrity of the SPY complex. (B) Mitochondria isolated from control and CLPBKO clones #1, #4, and #6 were analyzed by BN-PAGE (left) and SDS-PAGE (right). Mitochondria were solubilized in 1% digitonin for BN-PAGE prior to electrophoresis or resuspended in SDS-loading dye prior to SDS-PAGE. Gels were analyzed by immunoblotting with antibodies as indicated. (C–E) SPY complex integrity was assessed by BN-PAGE following induction of CLPBWT-FLAG, CLPBWA-FLAG, and CLPBWB-FLAG with 1 µg/ml tetracycline for the indicated duration. Isolated mitochondria were resuspended in solubilization buffer containing 1% digitonin and lysates were run on a continuous 4–10% acrylamide BN-PAGE gel followed by immunoblotting with an anti-STOML2 antibody to assess SPY complex recovery over time. (F) Table of Log2 fold changes of known YME1L1 substrates from CLPBKO (Fig. 1 A and Table S1) and STOML2KO (Fig. S3 C and Table S1) isolated mitochondrial proteomics. YME1L1 substrates listed are as defined in MacVicar et al. (2019). (G and H) Mitochondria were isolated from control and STOML2WT-FLAG stable cell lines following (G) 4 h (minimal expression) or (H) 16 h (extended expression) induction with 1 µg/ml tetracycline. STOML2WT-FLAG interactors were captured via IP and eluates were then prepared for LFQ MS. Data is presented as a volcano plot depicting the level enrichment relative to control (n = 3). Proteins above the horizontal cutoff (P value <0.05, Student's t test) and to the right of the vertical line (eight-fold change) are regarded as significantly enriched. Proteins in red are components of the SPY complex. Source data are available for this figure: SourceData FS4.
Figure 4.
Figure 4.
CLPB disaggregase is required to maintain SPY integrity. (A) Mitochondria isolated from control, CLPBKO, CLPBWT-FLAG, and CLPBWB-FLAG cells were prepared for BN-PAGE (left) and SDS-PAGE (right) analysis. For BN-PAGE, mitochondrial pellets were solubilized in digitonin-containing buffer and lysates were analyzed on a 4–16% gradient BN-PAGE gel and immunoblotted (IB) with the indicated antibodies. SDS-PAGE samples were solubilized in SDS-loading buffer prior to tris-tricine electrophoresis and immunoblotting with the indicated antibodies. *, stably expressed CLPB band lacking FLAG. (B) Quantification of STOML2 signal on BN-PAGE from A. Calculated as mean percentage ± SD of STOML2 signal, normalized to the level of SDHA (n = 4). (C) Mitochondria from control, CLPBKO, CLPBWT-FLAG, or CLPBWB-FLAG were solubilized in digitonin-containing buffer and separated into insoluble and soluble fractions by centrifugation and analyzed by SDS-PAGE and immunoblotting. (D) Quantification of STOML2 abundance in “Soluble” fraction shown in C. Calculated as mean percentage ± SD of “Total solubilized” for each cell line, normalized to SDHA level (n = 4). (E) Control, CLPBKO, and STOML2KO cell pellets were harvested following CHX treatment and solubilized in RIPA lysis buffer prior to SDS-PAGE and immunoblotting with antibodies as indicated. p, precursor form; m, mature form. (F) Quantification of PGAM5 processing as shown in E. Calculated as mean percentage ± SD of total PGAM5 signal (sum of p-PGAM5 and m-PGAM5 signals) across each time point per cell line, normalized to acylglycerol kinase (AGK) level (n = 4). (G) Mitochondria were isolated from control STOML2WT-FLAG (STOML2KO + STOML2WT-FLAG) and STOML2/CLPBdKO stable cell lines expressing STOML2WT-FLAG. Interactors of STOML2WT-FLAG were captured via IP and eluates were analyzed by LFQ MS. Data are presented as a volcano plot depicting the levels of interacting partners in CLPBKO as compared with control (n = 3). Proteins on the right of the volcano are more enriched in CLPBKO and proteins on the left of the volcano are more enriched in the control. Proteins above the horizontal cutoff (P value <0.05, Student's t test) and outside of the vertical lines (1.5-fold absolute change) are regarded as significantly altered in abundance. Functional annotations correspond to MitoCarta 3.0 categorization. (H) Mitochondria were isolated from control CLPBWB-FLAG (CLPBKO + CLPBWB-FLAG) and CLPB/STOML2dKO stable cell line expressing CLPBWB-FLAG and processed as described in G. Throughout this figure, statistical significance was determined by Student’s two-sample t test = *P < 0.05, **P < 0.01, ***P < 0.001, ****P < 0.0001, NS = not significant, P > 0.05. Source data are available for this figure: SourceData F4.
Figure S5.
Figure S5.
STOML2/CLPBdKO has a cumulative impact on OXPHOS integrity. (A) Quantification of HAX1 turnover (left) and residual HAX1 remaining in isolated mitochondria following 20 h CHX treatment (right). HAX1 processing was calculated as mean percentage ± SD of HAX1 signal across each time point per cell line, relative to control signal and normalized to AGK level. Residual HAX1 was calculated as mean percentage ± SD of HAX1 signal remaining following CHX treatment. Significance determined by Student’s t test (n = 3). *P < 0.05, **P < 0.01, ***P < 0.001. (B) Mitochondria were isolated from control and uninduced STOML2/CLPBdKO HEK cells and subjected to LFQ MS. Volcano plot depicts the level of proteins in STOML2/CLPBdKO relative to control (n = 3). Proteins above the horizontal cutoff (P value <0.05, Student's t test) and outside of either vertical line (1.5-fold absolute change) are regarded as significantly altered in abundance. Functional annotations correspond to MitoCarta 3.0 categorization. (C) Topographical heatmap showing Log2 fold difference values of CI subunits mapped against CI and supercomplex (SC) PDB structures from STOML2/CLPBdKO mitochondria, as determined in B (Table S1). N = NADH oxidation module (N-module). Q = ubiquinone reduction module (Q-module). CI: PDB 5LDW, CIII: PDB 5XTE, CIV: PDB 5Z62. (D) Left: Mitochondria isolated from control, CLPBKO, STOML2KO, and STOML2/CLPBdKO (no induction) were resuspended in solubilization buffer containing 1% digitonin. Lysates were run on a 4–16% acrylamide BN-PAGE gel, followed by immunoblotting (IB) with anti-NDUFA9 and anti-COXIV antibodies to assess OXPHOS supercomplex integrity. Right: Isolated mitochondria were resuspended in SDS-containing buffer and run on a 10–16% tris tricine gel followed by immunoblotting with indicated antibodies. Source data are available for this figure: SourceData FS5.
Figure 5.
Figure 5.
HAX1 aggregates colocalize with SPY complex in CLPBKO. (A and B) Control and CLPBKO HEK cells were transiently transfected with HAX1WT-FLAG and treated for immunofluorescence with anti-FLAG (magenta) and (A) anti-STOML2 or (B) anti-TIM44 (green) antibodies. Arrowheads denote areas of increased signal intensity consistent with the formation of HAX1-containing punctae. Scale bar is equivalent to 10 or 2 µM (zoom) as indicated. Dashed box indicates the zoom region shown on the far right. (C) Pearson’s correlation coefficient (r) analysis of 1 μm linescans of HAX1WT-FLAG and endogenous STOML2 or TIMM44 signal in HEK control or CLPBKO cell lines. n = ≥160 measurements per condition from three independent experiments, ≥28 images/condition. ****P <0.0001, two tailed Mann-Whitney test. (D) Mitochondria were isolated from control CLPBWB-FLAG (CLPBKO + CLPBWB-FLAG) and CLPB/HAX1dKO stable cell line expressing CLPBWB-FLAG. Interactors were captured via IP and eluates were then prepared for LFQ MS. Data are presented as a volcano plot depicting the levels of CLPBWB-FLAG interacting partners in HAX1KO as compared with control (n = 3). Proteins on the right of the volcano are more enriched in the absence of HAX1. Proteins above the horizontal cutoff (P value <0.05, Student's t test) and outside of the vertical lines (1.5-fold absolute change) are regarded as significantly altered in abundance. Functional annotations correspond to MitoCarta 3.0 categorization. (E) Schematic depicting the relationship between IMS and IM protein QC mechanisms. CLPB maintains HAX1 solubility thus enabling HAX1-HTRA2 interactivity and promoting their association with SPY (left). In the absence of CLPB, HAX1 is vulnerable to aggregation, colocalizing with SPY in discrete punctae (right). Functional (soluble) interactions between HAX1-HTRA2 and SPY are lost in the absence of CLPB. Excessive aggregation in a CLPB-null environment likely drives overloading at IMS QC machinery, leading to dysregulated proteostasis. The broad phenotypic outcomes of CLPB deficiency, such as reduced OXPHOS capacity, overabundance of apoptotic factors, and extreme ROS accumulation, may be due to an inefficiency of supporting QC factors in the face of acute proteotoxic stress.

References

    1. Abrahão, J., Mokry D.Z., and Ramos C.H.I.. 2017. Hsp78 (78 kD heat shock protein), a representative AAA family member found in the mitochondrial matrix of Saccharomyces cerevisiae. Front. Mol. Biosci. 4:60. 10.3389/fmolb.2017.00060 - DOI - PMC - PubMed
    1. Anand, R., Wai T., Baker M.J., Kladt N., Schauss A.C., Rugarli E., and Langer T.. 2014. The i-AAA protease YME1L and OMA1 cleave OPA1 to balance mitochondrial fusion and fission. J. Cell Biol. 204:919–929. 10.1083/jcb.201308006 - DOI - PMC - PubMed
    1. Antonicka, H., Lin Z.Y., Janer A., Aaltonen M.J., Weraarpachai W., Gingras A.C., and Shoubridge E.A.. 2020. A high-density human mitochondrial proximity interaction network. Cell Metab. 32:479–497.e9. 10.1016/j.cmet.2020.07.017 - DOI - PubMed
    1. Arhar, T., Shkedi A., Nadel C.M., and Gestwicki J.E.. 2021. The interactions of molecular chaperones with client proteins: Why are they so weak? J. Biol. Chem. 297:101282. 10.1016/j.jbc.2021.101282 - DOI - PMC - PubMed
    1. Baker, M.J., Lampe P.A., Stojanovski D., Korwitz A., Anand R., Tatsuta T., and Langer T.. 2014. Stress-induced OMA1 activation and autocatalytic turnover regulate OPA1-dependent mitochondrial dynamics. EMBO J. 33:578–593. 10.1002/embj.201386474 - DOI - PMC - PubMed

Publication types

LinkOut - more resources