. 2024 Apr 1;84(7):1029-1047.
doi: 10.1158/0008-5472.CAN-23-2135.

Human Tumor-Associated Macrophages and Neutrophils Regulate Antitumor Antibody Efficacy through Lethal and Sublethal Trogocytosis

Affiliations

Human Tumor-Associated Macrophages and Neutrophils Regulate Antitumor Antibody Efficacy through Lethal and Sublethal Trogocytosis

Sunil Singhal et al. Cancer Res. .

Abstract

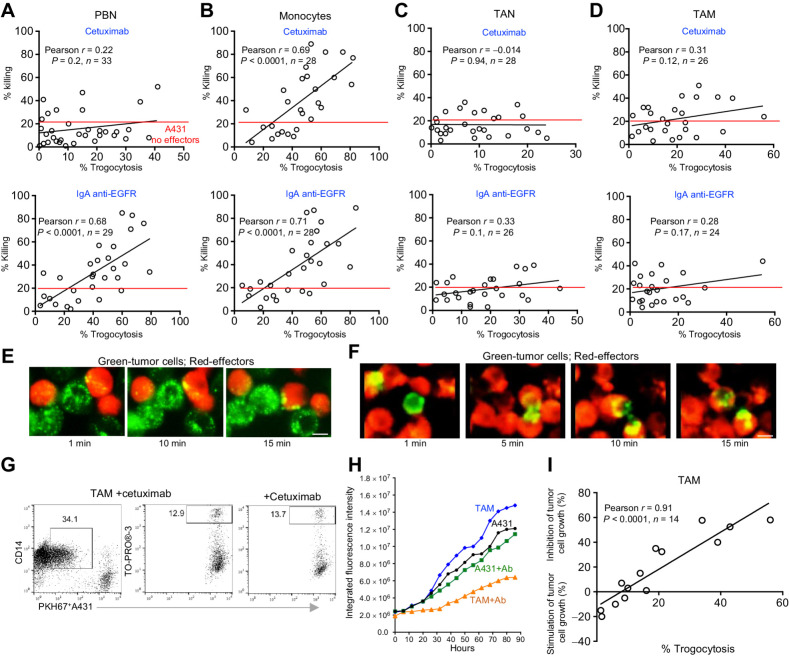
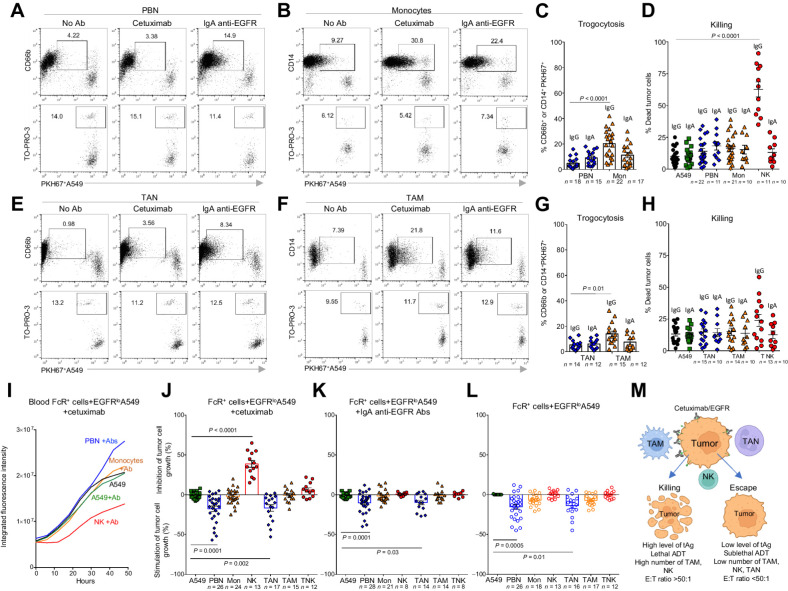
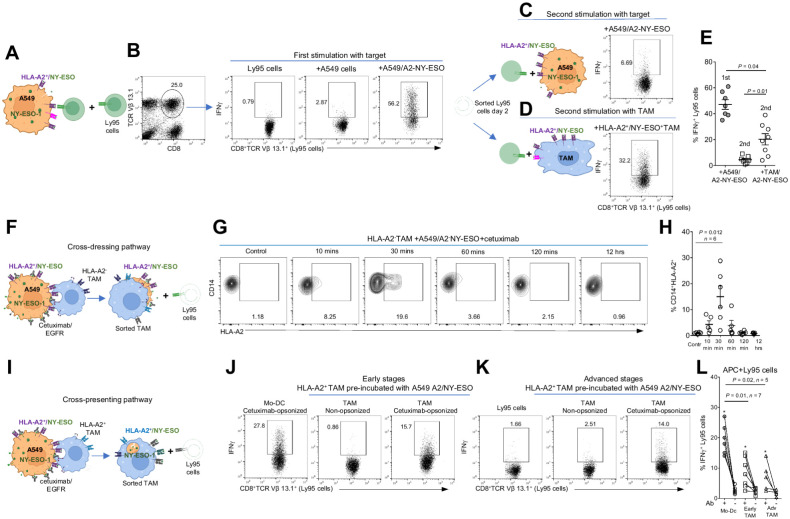
The clinical benefits of tumor-targeting antibodies (tAb) are modest in solid human tumors. The efficacy of many tAbs is dependent on Fc receptor (FcR)-expressing leukocytes that bind Fc fragments of tAb. Tumor-associated macrophages (TAM) and neutrophils (TAN) represent the majority of FcR+ effectors in solid tumors. A better understanding of the mechanisms by which TAMs and TANs regulate tAb response could help improve the efficacy of cancer treatments. Here, we found that myeloid effectors interacting with tAb-opsonized lung cancer cells used antibody-dependent trogocytosis (ADT) but not antibody-dependent phagocytosis. During this process, myeloid cells "nibbled off" tumor cell fragments containing tAb/targeted antigen (tAg) complexes. ADT was only tumoricidal when the tumor cells expressed high levels of tAg and the effectors were present at high effector-to-tumor ratios. If either of these conditions were not met, which is typical for solid tumors, ADT was sublethal. Sublethal ADT, mainly mediated by CD32hiCD64hi TAM, led to two outcomes: (i) removal of surface tAg/tAb complexes from the tumor that facilitated tumor cell escape from the tumoricidal effects of tAb; and (ii) acquisition of bystander tAgs by TAM with subsequent cross-presentation and stimulation of tumor-specific T-cell responses. CD89hiCD32loCD64lo peripheral blood neutrophils (PBN) and TAN stimulated tumor cell growth in the presence of the IgG1 anti-EGFR Ab cetuximab; however, IgA anti-EGFR Abs triggered the tumoricidal activity of PBN and negated the stimulatory effect of TAN. Overall, this study provides insights into the mechanisms by which myeloid effectors mediate tumor cell killing or resistance during tAb therapy.

Significance: The elucidation of the conditions and mechanisms by which human FcR+ myeloid effectors mediate cancer cell resistance and killing during antibody treatment could help develop improved strategies for treating solid tumors.


Figures

Figure 1. Accumulation, FcR expression, and tumoricidal activity of tumor-infiltrating myeloid cells. A, Frequencies of indicated FcR+ effectors in lung tumors analyzed by flow cytometry in a single-cell suspension obtained from digested lung tumors. B–D, Representative dot plots and cumulative flow cytometry results showing the expression of the indicated FcRs on myeloid effectors in blood and tumors. MFI, mean fluorescence intensity. E, Representative dot plots and cumulative flow cytometry results showing the expression of CD32a and CD32b molecules on the surface of gated CD14+HLA-DRintCD206− blood monocytes and CD14+HLA-DRhiCD206+ TAMs. Cells stained with isotype control Abs were used to set the gates. Wilcoxon matched paired test. F and G, Representative dot plots and cumulative flow cytometry results showing the ability of blood and tumor FcR+ effectors to kill PKH-67+A431 tumor cells in the presence of cetuximab (1 μg/mL) at a 50:1 E:T ratio in a 12-hour assay. Dead A431 tumor cells were defined as TO-PRO-3+PKH67+ cells. Summary graphs represent the total tumoricidal activity of effectors calculated as described in Materials and Methods. H and I, Representative images of GFP+A431 tumor cells cocultured with indicated blood effectors (patient LC441) and cetuximab for 48 hours in the IncuCyte Live Cell Analysis System. Scale bar, 400 μm. Representative experiment (H) and summary results (I) showing the kinetics of GFP+A431 tumor cell growth during coculturing with blood and tumor FcR+ effectors at a 50:1 E:T ratio in the presence of cetuximab (1 μg/mL) and in the presence of IgA anti-EGFR Ab (1 μg/mL; J and K) in the IncuCyte Live Cell Analysis System. Percentage of tumor cell growth inhibition/stimulation in the presence of anti-EGFR Abs was calculated at 48 hours using the formula: (FI)(A431+Ab)-FI(A431+effectors+Ab)/FI(A431+Ab) × 100%. FI, Integrated fluorescence intensity. The number of patients included in each analysis is indicated on the graphs. All data are represented as mean ± SEM. All comparisons used one-way ANOVA with Tukey multiple comparisons tests. FcR+ effectors were freshly isolated for all experiments.
Figure 1.
Accumulation, FcR expression, and tumoricidal activity of tumor-infiltrating myeloid cells. A, Frequencies of indicated FcR+ effectors in lung tumors analyzed by flow cytometry in a single-cell suspension obtained from digested lung tumors. B–D, Representative dot plots and cumulative flow cytometry results showing the expression of the indicated FcRs on myeloid effectors in blood and tumors. MFI, mean fluorescence intensity. E, Representative dot plots and cumulative flow cytometry results showing the expression of CD32a and CD32b molecules on the surface of gated CD14+HLA-DRintCD206 blood monocytes and CD14+HLA-DRhiCD206+ TAMs. Cells stained with isotype control Abs were used to set the gates. Wilcoxon matched paired test. F and G, Representative dot plots and cumulative flow cytometry results showing the ability of blood and tumor FcR+ effectors to kill PKH-67+A431 tumor cells in the presence of cetuximab (1 μg/mL) at a 50:1 E:T ratio in a 12-hour assay. Dead A431 tumor cells were defined as TO-PRO-3+PKH67+ cells. Summary graphs represent the total tumoricidal activity of effectors calculated as described in Materials and Methods. H and I, Representative images of GFP+A431 tumor cells cocultured with indicated blood effectors (patient LC441) and cetuximab for 48 hours in the IncuCyte Live Cell Analysis System. Scale bar, 400 μm. Representative experiment (H) and summary results (I) showing the kinetics of GFP+A431 tumor cell growth during coculturing with blood and tumor FcR+ effectors at a 50:1 E:T ratio in the presence of cetuximab (1 μg/mL) and in the presence of IgA anti-EGFR Ab (1 μg/mL; J and K) in the IncuCyte Live Cell Analysis System. Percentage of tumor cell growth inhibition/stimulation in the presence of anti-EGFR Abs was calculated at 48 hours using the formula: (FI)(A431+Ab)-FI(A431+effectors+Ab)/FI(A431+Ab) × 100%. FI, Integrated fluorescence intensity. The number of patients included in each analysis is indicated on the graphs. All data are represented as mean ± SEM. All comparisons used one-way ANOVA with Tukey multiple comparisons tests. FcR+ effectors were freshly isolated for all experiments.
Figure 2. Anti-EGFR Ab-triggered trogocytosis and tumoricidal activity mediated by blood and tumor myeloid cells. A and B, Representative images (taken from time-lapse microscopy; Supplementary Movies S1 and S2 at the 30 minutes after recording) showing the TAM-mediated phagocytosis of rituximab-opsonized Daudi tumor cells (A) and trogocytosis of cetuximab-opsonized A431 tumor cells (B). PKH26-labeled TAMs (red) were incubated with opsonized PKH67-labeled targets (green) at a 3:1 E:T ratio. Scale bar, 10 μm. C and D, Representative dot plots demonstrating TAM-mediated phagocytosis of Daudi tumor cells in the presence or absence of rituximab (1 μg/mL; C) and trogocytosis of A431 tumor cells in the presence or absence of cetuximab (1 μg/mL; D). TAMs were cocultured with PKH67-labeled targets at 3:1 E:T ratio for 2 hours. E–L, Representative dot plots showing the different levels of trogocytosis and killing activity mediated by indicated blood and tumor myeloid effectors cocultured with PKH67+A431 cells at a 50:1 E:T ratio in the presence or absence of cetuximab (IgG1) or IgA anti-EGFR Abs (IgA) for 12 hours. F, H, J, and L, Summary results of experiments described above in E–L. Unpaired t test. The number of patients included in each analysis is indicated on the graphs. All data represented as mean ± SEM. FcR+ effectors were freshly isolated for all experiments.
Figure 2.
Anti-EGFR Ab-triggered trogocytosis and tumoricidal activity mediated by blood and tumor myeloid cells. A and B, Representative images (taken from time-lapse microscopy; Supplementary Movies S1 and S2 at the 30 minutes after recording) showing the TAM-mediated phagocytosis of rituximab-opsonized Daudi tumor cells (A) and trogocytosis of cetuximab-opsonized A431 tumor cells (B). PKH26-labeled TAMs (red) were incubated with opsonized PKH67-labeled targets (green) at a 3:1 E:T ratio. Scale bar, 10 μm. C and D, Representative dot plots demonstrating TAM-mediated phagocytosis of Daudi tumor cells in the presence or absence of rituximab (1 μg/mL; C) and trogocytosis of A431 tumor cells in the presence or absence of cetuximab (1 μg/mL; D). TAMs were cocultured with PKH67-labeled targets at 3:1 E:T ratio for 2 hours. E–L, Representative dot plots showing the different levels of trogocytosis and killing activity mediated by indicated blood and tumor myeloid effectors cocultured with PKH67+A431 cells at a 50:1 E:T ratio in the presence or absence of cetuximab (IgG1) or IgA anti-EGFR Abs (IgA) for 12 hours. F, H, J, and L, Summary results of experiments described above in EL. Unpaired t test. The number of patients included in each analysis is indicated on the graphs. All data represented as mean ± SEM. FcR+ effectors were freshly isolated for all experiments.
Figure 3. The lethal and sublethal effects of ADT on A431 tumor cells mediated by blood and tumor myeloid cells in the presence of anti-EGFR Abs. A–D, Correlation of the ability of indicated blood and tumor myeloid effectors to mediate ADT with their ability to kill A431 tumor cells in the presence of anti-EGFR Abs determined by flow cytometry. Pearson test. E and F, Images (taken from time-lapse microscopy; Supplementary Movies S3 and S4 at the indicated time points after recording) showing the different amount of cetuximab-triggered trogocytic uptake of tumor cell fragments by PKH26-labeled effectors (red) PBNs (E) and monocytes (F) during their interaction with PKH67-labeled A431 targets (green). Scale bar, 10 μm. G, Representative dot plots demonstrating trogocytosis and killing activity mediated by TAMs cocultured with PKH67-labeled A431 cells at a 50:1 E:T ratio in the presence of cetuximab for 12 hours. H, Representative experiment showing the kinetics of GFP+A431 tumor cell growth with TAM at a 50:1 E:T ratio in the presence or absence of cetuximab in the IncuCyte Live Cell Analysis System. I, Summary results showing the correlation between the abilities of TAMs to mediate ADT and regulate A431 tumor cell growth in the presence of cetuximab in the IncuCyte Live Cell Analysis System. Pearson test. The number of patients included in each analysis is indicated on the graphs. FcR+ effectors were freshly isolated for all experiments
Figure 3.
The lethal and sublethal effects of ADT on A431 tumor cells mediated by blood and tumor myeloid cells in the presence of anti-EGFR Abs. A–D, Correlation of the ability of indicated blood and tumor myeloid effectors to mediate ADT with their ability to kill A431 tumor cells in the presence of anti-EGFR Abs determined by flow cytometry. Pearson test. E and F, Images (taken from time-lapse microscopy; Supplementary Movies S3 and S4 at the indicated time points after recording) showing the different amount of cetuximab-triggered trogocytic uptake of tumor cell fragments by PKH26-labeled effectors (red) PBNs (E) and monocytes (F) during their interaction with PKH67-labeled A431 targets (green). Scale bar, 10 μm. G, Representative dot plots demonstrating trogocytosis and killing activity mediated by TAMs cocultured with PKH67-labeled A431 cells at a 50:1 E:T ratio in the presence of cetuximab for 12 hours. H, Representative experiment showing the kinetics of GFP+A431 tumor cell growth with TAM at a 50:1 E:T ratio in the presence or absence of cetuximab in the IncuCyte Live Cell Analysis System. I, Summary results showing the correlation between the abilities of TAMs to mediate ADT and regulate A431 tumor cell growth in the presence of cetuximab in the IncuCyte Live Cell Analysis System. Pearson test. The number of patients included in each analysis is indicated on the graphs. FcR+ effectors were freshly isolated for all experiments
Figure 4. The ability of blood and tumor myeloid cells to perform ADT and kill EGFRhi A431 cells in the presence of anti-EGFR Abs under conditions representing solid human tumors. A, The frequencies of CD45−EpCam+cells, CD14+CD206+HLA-DRhiTAM, and CD11b+CD66b+CD14−TAN were analyzed by flow cytometry in digested lung tumors. Paired t test. B and C, Representative dot plots showing the levels of trogocytosis and killing activity mediated by blood monocytes (B) and PBNs (C) cocultured with PKH67+ A431 cells at the indicated E:T ratios in the presence of cetuximab and IgA anti-EGFR Abs, respectively, for 12 hours. Nonspecific human IgG1 or IgA2 isotype control Abs were used as a control. D and E, Cumulative flow cytometry results showing the ability of indicated FcR+ effectors to kill PKH67+ A431 tumor cells in the presence of cetuximab (IgG) or IgA anti-EGFR (IgA) Abs at a 2:1 E:T ratio in a 12-hour FACS-based assay. One-way ANOVA with Tukey multiple comparisons tests. Summary graphs represent the total tumoricidal activity of effectors calculated as described in Materials and Methods. F–H, Representative images of GFP+A431 tumor cells cocultured with blood monocytes (patient LC441) at different E:T ratios and cetuximab for 48 hours in the IncuCyte Live Cell Analysis System. Image of A431+Ab, where Ab is a cetuximab, is intentionally the same in both Figs. 1H and 4F. Scale bar, 400 μm. Representative experiments showing the kinetics of A431 tumor cell growth when cocultured with blood monocytes (F), PBNs (G), and TAMs (H) in the presence of anti-EGFR Abs at the indicated E:T ratios in the IncuCyte Live Cell Analysis System. I and J, Summary results showing the kinetics of GFP+A431 tumor cell growth when cocultured with FcR+ effectors in the presence of cetuximab or IgA anti-EGFR Ab at 2:1 E:T ratio in the IncuCyte Live Cell System. The percentage of tumor cell growth inhibition/stimulation was calculated at 48 hours. One-way ANOVA with Tukey multiple comparisons tests. K, Representative dot plots and cumulative flow cytometry data demonstrating the expression of EGFR on the surface of EpCam+ cells in tumor and distant lung tissue. Paired t test. MFI, mean fluorescence intensity. L, Representative flow cytometry histograms showing the expression of EGFR on the surface of EpCam+ cells in tumor and distant lung tissue in comparison with A431 and A549 tumor cells. Number of patients is indicated on the graphs. All data represented as mean ± SEM. FcR+ effectors were freshly isolated for all experiments.
Figure 4.
The ability of blood and tumor myeloid cells to perform ADT and kill EGFRhi A431 cells in the presence of anti-EGFR Abs under conditions representing solid human tumors. A, The frequencies of CD45EpCam+cells, CD14+CD206+HLA-DRhiTAM, and CD11b+CD66b+CD14TAN were analyzed by flow cytometry in digested lung tumors. Paired t test. B and C, Representative dot plots showing the levels of trogocytosis and killing activity mediated by blood monocytes (B) and PBNs (C) cocultured with PKH67+ A431 cells at the indicated E:T ratios in the presence of cetuximab and IgA anti-EGFR Abs, respectively, for 12 hours. Nonspecific human IgG1 or IgA2 isotype control Abs were used as a control. D and E, Cumulative flow cytometry results showing the ability of indicated FcR+ effectors to kill PKH67+ A431 tumor cells in the presence of cetuximab (IgG) or IgA anti-EGFR (IgA) Abs at a 2:1 E:T ratio in a 12-hour FACS-based assay. One-way ANOVA with Tukey multiple comparisons tests. Summary graphs represent the total tumoricidal activity of effectors calculated as described in Materials and Methods. F–H, Representative images of GFP+A431 tumor cells cocultured with blood monocytes (patient LC441) at different E:T ratios and cetuximab for 48 hours in the IncuCyte Live Cell Analysis System. Image of A431+Ab, where Ab is a cetuximab, is intentionally the same in both Figs. 1H and 4F. Scale bar, 400 μm. Representative experiments showing the kinetics of A431 tumor cell growth when cocultured with blood monocytes (F), PBNs (G), and TAMs (H) in the presence of anti-EGFR Abs at the indicated E:T ratios in the IncuCyte Live Cell Analysis System. I and J, Summary results showing the kinetics of GFP+A431 tumor cell growth when cocultured with FcR+ effectors in the presence of cetuximab or IgA anti-EGFR Ab at 2:1 E:T ratio in the IncuCyte Live Cell System. The percentage of tumor cell growth inhibition/stimulation was calculated at 48 hours. One-way ANOVA with Tukey multiple comparisons tests. K, Representative dot plots and cumulative flow cytometry data demonstrating the expression of EGFR on the surface of EpCam+ cells in tumor and distant lung tissue. Paired t test. MFI, mean fluorescence intensity. L, Representative flow cytometry histograms showing the expression of EGFR on the surface of EpCam+ cells in tumor and distant lung tissue in comparison with A431 and A549 tumor cells. Number of patients is indicated on the graphs. All data represented as mean ± SEM. FcR+ effectors were freshly isolated for all experiments.
Figure 5. The ability of blood and tumor myeloid cells to perform ADT and kill EGFRlo A549 cells in the presence of anti-EGFR Abs under conditions representing solid human tumors. A–H, Representative dot plots and cumulative flow cytometry results showing the different levels of ADT and killing activity mediated by PBNs (A, C, and D), blood monocytes (B, C, and D), TANs (E, G, and H), and TAMs (F, G, and H) cocultured with PKH67+A549 cells at a 50:1 E:T ratio in the presence or absence of cetuximab (IgG) or IgA anti-EGFR Abs (IgA) for 12 hours. Summary graphs represent the total tumoricidal activity of effectors calculated as described in Materials and Methods. I, J, and K, Representative experiment and summary results showing the kinetics of A549 tumor cell growth when cocultured with indicated blood and tumor FcR+ effectors in the presence of cetuximab or IgA anti-EGFR Abs at a 50:1 E:T ratio in the IncuCyte Live Cell Analysis System. The percentage of tumor cell growth inhibition/stimulation was calculated at 48 hours. L, Cumulative results showing the kinetics of A549 tumor cell growth cocultured with blood and tumor FcR+ effectors at a 50:1 E:T ratio in the presence of human IgG1 isotype control Abs in the IncuCyte Live Cell Analysis System. The number of patients included in each analysis is indicated on the graphs. All data represented as mean ± SEM. All comparisons used one-way ANOVA with Tukey multiple comparisons tests. FcR+ effectors were freshly isolated for all experiments. M, The schematic representation of requisite conditions in TME that are essential for efficient killing of opsonized tumors by FcR+ effectors or tumor escape from tAbs. (M, Created with BioRender.com.)
Figure 5.
The ability of blood and tumor myeloid cells to perform ADT and kill EGFRlo A549 cells in the presence of anti-EGFR Abs under conditions representing solid human tumors. A–H, Representative dot plots and cumulative flow cytometry results showing the different levels of ADT and killing activity mediated by PBNs (A, C, and D), blood monocytes (B, C, and D), TANs (E, G, and H), and TAMs (F, G, and H) cocultured with PKH67+A549 cells at a 50:1 E:T ratio in the presence or absence of cetuximab (IgG) or IgA anti-EGFR Abs (IgA) for 12 hours. Summary graphs represent the total tumoricidal activity of effectors calculated as described in Materials and Methods. I, J, and K, Representative experiment and summary results showing the kinetics of A549 tumor cell growth when cocultured with indicated blood and tumor FcR+ effectors in the presence of cetuximab or IgA anti-EGFR Abs at a 50:1 E:T ratio in the IncuCyte Live Cell Analysis System. The percentage of tumor cell growth inhibition/stimulation was calculated at 48 hours. L, Cumulative results showing the kinetics of A549 tumor cell growth cocultured with blood and tumor FcR+ effectors at a 50:1 E:T ratio in the presence of human IgG1 isotype control Abs in the IncuCyte Live Cell Analysis System. The number of patients included in each analysis is indicated on the graphs. All data represented as mean ± SEM. All comparisons used one-way ANOVA with Tukey multiple comparisons tests. FcR+ effectors were freshly isolated for all experiments. M, The schematic representation of requisite conditions in TME that are essential for efficient killing of opsonized tumors by FcR+ effectors or tumor escape from tAbs. (M, Created with BioRender.com.)
Figure 6. Role of TAM-mediated ADT in facilitating tumor cell escape from tAbs. A, Scheme proposing the role of TAM-mediated ADT in the downmodulation of cetuximab/EGFR complexes on the surface of opsonized tumor cells that could lead to resistance of targets to subsequent attacks by NK cells. B, Representative flow cytometry histograms showing the expression of cetuximab/EGFR complexes on the surface of cetuximab-opsonized A431 cells cocultured in the presence or absence of TAMs at a 1:1 E:T ratio for 2 hours. C, Cumulative results showing the expression of cetuximab/EGFR complexes on the surface of cetuximab-opsonized A431 and A549 cells cocultured in the presence or absence TAMs at a 1:1 E:T ratio for 2 hours. Wilcoxon matched-pairs signed rank test. D and E, Representative dot plots and cumulative flow cytometry data demonstrating the reduced ability of blood NK cells to kill cetuximab-opsonized A431 and A549 tumor cells in the presence of TAMs. Tumor cell lines were preopsonized with cetuximab and mixed with TAMs at a 1:1 E:T ratio; two hours later, NK cells were added at a 10:1 E:T ratio for additional 12 hours. Wilcoxon matched pairs signed rank test. Some experiments were performed with blocking anti-CD64 F(ab')2 and anti-CD32 F(ab')2 Abs (5 μg/mL) and representative dot plots from one of three experiments are shown. F, The kinetics of A431 tumor cell growth when cocultured with TAMs and blood NK cells in the presence of cetuximab in the IncuCyte Live Cell Analysis System. A431 cells were preopsonized with cetuximab and mixed with TAMs at a 3:1 E:T ratio; two hours later, NK cells were added at a 10:1 E:T ratio. The ability of TAMs to mediate ADT was assessed by flow cytometry in the cocultures of TAMs and cetuximab-opsonized PKH67+A431 cells as described earlier. Two patients (LC#643 and LC#649) are shown. All data represented as mean ± SEM. FcR+ effectors were freshly isolated for all experiments. (A, Created with BioRender.com.)
Figure 6.
Role of TAM-mediated ADT in facilitating tumor cell escape from tAbs. A, Scheme proposing the role of TAM-mediated ADT in the downmodulation of cetuximab/EGFR complexes on the surface of opsonized tumor cells that could lead to resistance of targets to subsequent attacks by NK cells. B, Representative flow cytometry histograms showing the expression of cetuximab/EGFR complexes on the surface of cetuximab-opsonized A431 cells cocultured in the presence or absence of TAMs at a 1:1 E:T ratio for 2 hours. C, Cumulative results showing the expression of cetuximab/EGFR complexes on the surface of cetuximab-opsonized A431 and A549 cells cocultured in the presence or absence TAMs at a 1:1 E:T ratio for 2 hours. Wilcoxon matched-pairs signed rank test. D and E, Representative dot plots and cumulative flow cytometry data demonstrating the reduced ability of blood NK cells to kill cetuximab-opsonized A431 and A549 tumor cells in the presence of TAMs. Tumor cell lines were preopsonized with cetuximab and mixed with TAMs at a 1:1 E:T ratio; two hours later, NK cells were added at a 10:1 E:T ratio for additional 12 hours. Wilcoxon matched pairs signed rank test. Some experiments were performed with blocking anti-CD64 F(ab')2 and anti-CD32 F(ab')2 Abs (5 μg/mL) and representative dot plots from one of three experiments are shown. F, The kinetics of A431 tumor cell growth when cocultured with TAMs and blood NK cells in the presence of cetuximab in the IncuCyte Live Cell Analysis System. A431 cells were preopsonized with cetuximab and mixed with TAMs at a 3:1 E:T ratio; two hours later, NK cells were added at a 10:1 E:T ratio. The ability of TAMs to mediate ADT was assessed by flow cytometry in the cocultures of TAMs and cetuximab-opsonized PKH67+A431 cells as described earlier. Two patients (LC#643 and LC#649) are shown. All data represented as mean ± SEM. FcR+ effectors were freshly isolated for all experiments. (A, Created with BioRender.com.)
Figure 7. Role of TAM-mediated ADT in tAg uptake from live opsonized targets following stimulation of tumor-specific T cells. A, Scheme showing the in vitro model of human tumor antigen–specific T-cell responses (A549/HLA-A2+NY-ESO tumor cells interacting with NY-ESO–specific Ly95 T cells). B, Representative dot plots demonstrating the Ly95 (CD8+TCR Vβ13.1+) cells and their NY-ESO–specific IFNγ production after exposure to A549/HLA-A2+NY-ESO tumor cells compared with control A549 cells after the first round of stimulation. C and D, Schemes and representative dot plots showing the second round of stimulation of purified Ly95 cells with A549/HLA-A2+NY-ESO tumor cells (C) or HLA-A2+TAM preloaded with NY-ESO157–165 peptide (D) and the production of IFNγ by Ly95 cells in response to the second round of the stimulation. E, Cumulative data of the experiments described in B–D demonstrating the Ly95 cell responses after the first and second round of stimulation (intracellular IFNγ production). Kruskal–Wallis multiple comparison test. F, Scheme showing the ADT-dependent mechanism of Ly95 cell stimulation by HLA-A2neg TAMs that trogocytosed and displayed on their surface the A549 tumor cell membranes containing the surface cetuximab/EGFR and bystander HLA-A2/NY-ESO complexes (cross-dressing pathway). G and H, Representative dot plots and summary results demonstrating the acquisition and display of HLA-A2 molecules on the surface of HLA-A2neg TAMs during their interaction with cetuximab-opsonized A549/HLA-A2+NY-ESO cells at a 1:1 E:T ratio at the indicated time points. Kruskal–Wallis multiple comparisons test. Data represented as mean ± SEM. I, Scheme showing the ADT-dependent mechanism of Ly95 cell stimulation by HLA-A2+ TAM that trogocytosed A549 tumor cell fragments containing cetuximab/EGFR and bystander intact NY-ESO Ag followed by the cross-presentation to Ly95 cells (cross-presentation pathway). J–L, Representative dot plots and cumulative data showing the ability of HLA-A2+ TAMs (from early and advanced stage lung cancers) to stimulate Ly95 cells responses (intracellular IFNγ) after preincubation with A549/HLA-A2+NY-ESO tumor cells in the presence or absence of cetuximab for 4 hours. Mo-DCs were used as a professional APC. Wilcoxon matched pairs test for groups with (+) or without (−) Ab. *, P < 0.01. Kruskal–Wallis test for groups with Mo-DCs, early-stage TAMs, and advanced stage TAMs. FcR+ effectors were freshly isolated for all experiments. (A, C, D, F, and I, Created with BioRender.com.)
Figure 7.
Role of TAM-mediated ADT in tAg uptake from live opsonized targets following stimulation of tumor-specific T cells. A, Scheme showing the in vitro model of human tumor antigen–specific T-cell responses (A549/HLA-A2+NY-ESO tumor cells interacting with NY-ESO–specific Ly95 T cells). B, Representative dot plots demonstrating the Ly95 (CD8+TCR Vβ13.1+) cells and their NY-ESO–specific IFNγ production after exposure to A549/HLA-A2+NY-ESO tumor cells compared with control A549 cells after the first round of stimulation. C and D, Schemes and representative dot plots showing the second round of stimulation of purified Ly95 cells with A549/HLA-A2+NY-ESO tumor cells (C) or HLA-A2+TAM preloaded with NY-ESO157–165 peptide (D) and the production of IFNγ by Ly95 cells in response to the second round of the stimulation. E, Cumulative data of the experiments described in BD demonstrating the Ly95 cell responses after the first and second round of stimulation (intracellular IFNγ production). Kruskal–Wallis multiple comparison test. F, Scheme showing the ADT-dependent mechanism of Ly95 cell stimulation by HLA-A2neg TAMs that trogocytosed and displayed on their surface the A549 tumor cell membranes containing the surface cetuximab/EGFR and bystander HLA-A2/NY-ESO complexes (cross-dressing pathway). G and H, Representative dot plots and summary results demonstrating the acquisition and display of HLA-A2 molecules on the surface of HLA-A2neg TAMs during their interaction with cetuximab-opsonized A549/HLA-A2+NY-ESO cells at a 1:1 E:T ratio at the indicated time points. Kruskal–Wallis multiple comparisons test. Data represented as mean ± SEM. I, Scheme showing the ADT-dependent mechanism of Ly95 cell stimulation by HLA-A2+ TAM that trogocytosed A549 tumor cell fragments containing cetuximab/EGFR and bystander intact NY-ESO Ag followed by the cross-presentation to Ly95 cells (cross-presentation pathway). JL, Representative dot plots and cumulative data showing the ability of HLA-A2+ TAMs (from early and advanced stage lung cancers) to stimulate Ly95 cells responses (intracellular IFNγ) after preincubation with A549/HLA-A2+NY-ESO tumor cells in the presence or absence of cetuximab for 4 hours. Mo-DCs were used as a professional APC. Wilcoxon matched pairs test for groups with (+) or without (−) Ab. *, P < 0.01. Kruskal–Wallis test for groups with Mo-DCs, early-stage TAMs, and advanced stage TAMs. FcR+ effectors were freshly isolated for all experiments. (A,C,D,F, and I, Created with BioRender.com.)

References

    1. Ferris RL, Jaffee EM, Ferrone S. Tumor antigen-targeted, monoclonal antibody-based immunotherapy: clinical response, cellular immunity, and immunoescape. J Clin Oncol 2010;28:4390–9. - PMC - PubMed
    1. Mestas J, Hughes CC. Of mice and not men: differences between mouse and human immunology. J Immunol 2004;172:2731–8. - PubMed
    1. Eruslanov EB, Singhal S, SM A. Mouse versus human neutrophils in cancer: a major knowledge gap. Trends Cancer 2017;3:149–60. - PMC - PubMed
    1. Bruhns P, Jonsson F. Mouse and human FcR effector functions. Immunol Rev 2015;268:25–51. - PubMed
    1. Loisel S, Ohresser M, Pallardy M, Dayde D, Berthou C, Cartron G, et al. . Relevance, advantages and limitations of animal models used in the development of monoclonal antibodies for cancer treatment. Crit Rev Oncol Hematol 2007;62:34–42. - PubMed

Publication types

LinkOut - more resources