. 2024 Jun 3;26(6):1052-1066.
doi: 10.1093/neuonc/noae013.

Invasive growth of brain metastases is linked to CHI3L1 release from pSTAT3-positive astrocytes

Affiliations

Invasive growth of brain metastases is linked to CHI3L1 release from pSTAT3-positive astrocytes

Matthew Dankner et al. Neuro Oncol. .

Abstract

Background: Compared to minimally invasive brain metastases (MI BrM), highly invasive (HI) lesions form abundant contacts with cells in the peritumoral brain parenchyma and are associated with poor prognosis. Reactive astrocytes (RAs) labeled by phosphorylated STAT3 (pSTAT3) have recently emerged as a promising therapeutic target for BrM. Here, we explore whether the BrM invasion pattern is influenced by pSTAT3+ RAs and may serve as a predictive biomarker for STAT3 inhibition.

Methods: We used immunohistochemistry to identify pSTAT3+ RAs in HI and MI human and patient-derived xenograft (PDX) BrM. Using PDX, syngeneic, and transgenic mouse models of HI and MI BrM, we assessed how pharmacological STAT3 inhibition or RA-specific STAT3 genetic ablation affected BrM growth in vivo. Cancer cell invasion was modeled in vitro using a brain slice-tumor co-culture assay. We performed single-cell RNA sequencing of human BrM and adjacent brain tissue.

Results: RAs expressing pSTAT3 are situated at the brain-tumor interface and drive BrM invasive growth. HI BrM invasion pattern was associated with delayed growth in the context of STAT3 inhibition or genetic ablation. We demonstrate that pSTAT3+ RAs secrete Chitinase 3-like-1 (CHI3L1), which is a known STAT3 transcriptional target. Furthermore, single-cell RNA sequencing identified CHI3L1-expressing RAs in human HI BrM. STAT3 activation, or recombinant CHI3L1 alone, induced cancer cell invasion into the brain parenchyma using a brain slice-tumor plug co-culture assay.

Conclusions: Together, these data reveal that pSTAT3+ RA-derived CHI3L1 is associated with BrM invasion, implicating STAT3 and CHI3L1 as clinically relevant therapeutic targets for the treatment of HI BrM.

Keywords: CHI3L1; STAT3; astrocyte; brain metastasis; histopathological growth patterns; invasion.


Conflict of interest statement

The authors have declared that no conflicts of interest exist.

Figures

Figure 1.
Figure 1.
pSTAT3+ reactive astrocytes are more abundant in highly invasive compared to minimally invasive brain metastases. (A) Representative images of multiplex immunohistofluorescence staining for reactive astrocytes (GFAP, orange), cancer cells (MART1/pan-cytokeratin AE1/AE3/PCK26; PanCK, red) and nuclei (DAPI, blue) in minimally invasive (MI; left panels) and highly invasive (HI; right panels) human brain metastases. Scale bars: 1 mm (left panel), 500 µm (middle panel), 100 µm (right panel). (B) and (C) Representative images of 2-color immunohistochemistry (Teal-GFAP, Dab-pSTAT3) of patient brain metastases (B) and intracranially injected patient-derived xenograft models (C) Scale bars: 100 µm (all magnifications). (D—G) Quantification of pSTAT3 H-Score in GFAP+ (D, F) or GFAP- (E, G) cells between MI and HI patient samples (D and E, n = 20 MI, n = 39 HI) and patient-derived xenograft models (F and G, n = 16 MI, n = 14 HI). Samples are color coded by primary type: lung, blue (patient samples, n = 11 MI, n = 20 HI; PDX samples n = 9 MI, n = 7 HI); breast, pink (patient samples, n = 3 MI, n = 13 HI; PDX samples, n = 4 MI, n = 4 HI); melanoma, orange (patient samples, n = 2 MI, n = 2 HI; PDX samples, n = 1 MI, n = 3 HI); other, green (patient samples, n = 4 MI, n = 4 HI; PDX samples, n = 2 MI). H-Scores were calculated by multiplying the staining intensity scores (0–3) by the percentage of positively stained tumor cells (1–100%) for a maximum H-Score of 300. P-values were calculated with Mann–Whitney test.
Figure 2.
Figure 2.
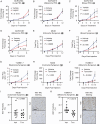
Pharmacological inhibition or astrocyte-specific genetic ablation of STAT3 decreases the growth of highly invasive, but not minimally invasive, brain metastases. (A–D) Patient-derived xenograft models of orthotopically implanted brain metastases: (A) GCRC2084 (n = 10 mice per treatment arm), (B) GCRC2015 (n = 12 mice per treatment arm), (C) GCC1945 (n = 10 mice per treatment arm), and (D) GCRC1987 (n = 12 mice per treatment arm) treated with Legasil or Vehicle. Treatment was initiated on the day following the visible bioluminescence signal in all experimental animals and is indicated with an arrow as day 1. Data is normalized to the pre-treatment luminescent signal and expressed as fold-change. (E–G) MC38 (E, n = 11 mice in Vehicle arm and n = 12 mice in Legasil arm), 4T1 (F, n = 15 mice in Vehicle and Legasil arms), and YUMM1.7 (G, n = 15 mice in Vehicle arm and n = 14 mice in Legasil arm) syngeneic models of orthotopically implanted brain metastases treated with Legasil or Vehicle. Treatment was initiated on the day following intracranial injection and is indicated with an arrow as day 1. (H) MC38 (n = 10 mice in Vehicle arm and n = 8 mice in Tamoxifen arm) syngeneic model of orthotopically implanted brain metastases in cKO-STAT3: GFAP-Cre/ ERT2; Stat3loxP/loxP mice treated with Tamoxifen (1 mg/50 µL corn oil per mouse) or Vehicle (50 µL corn oil). Treatment was initiated on day 3 after intracranial injection and is indicated with an arrow. Data is normalized to the pre-treatment luminescent signal and expressed as fold-change. (I) Quantification of Ki67 positivity in cancer cells from the experiment shown in (H). (J) YUMM1.7 (n = 9 mice in Vehicle arm and n = 8 mice in Tamoxifen arm) syngeneic model of orthotopically implanted brain metastases in cKO-STAT3: GFAP-Cre/ ERT2; Stat3loxP/loxP mice treated with Tamoxifen (1 mg/50 µL corn oil per mouse) or Vehicle (50 µL corn oil). Treatment was initiated on day 3 after intracranial injection and is indicated with an arrow. Data is normalized to the pre-treatment luminescent signal and expressed as fold-change. (K) Quantification of Ki67 positivity in cancer cells from the experiment shown in (J). P-values were calculated using a serial measurement test for maximum difference vs. first value, with the exception of panels I and K, which were calculated with Mann–Whitney test.
Figure 3.
Figure 3.
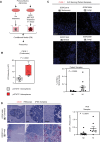
Activation of pSTAT3 within reactive astrocytes contributes to cancer cell invasion within the brain. (A) Schematic of brain slice invasion assay whereby mouse brain slices are established in culture, incubated with a cytokine (Cyt) cocktail (denoted as colored dots; (0.1 µg/mL TGF-α, 0.1 µg/mL MIF, 0.01 µg/mL EGF)), thoroughly washed away, and co-cultured adjacent to a plug of cancer cells. (B) and (C) Representative hematoxylin & eosin stained images of intracranially injected human PC9 (B) and mouse LLC (C) cells demonstrating minimally invasive growth patterns. Dotted lines represent the well-demarcated brain-tumor interface present in the lesions. Scale bars: 100 µm. (D) and (E) Representative images of brain slice invasion assay using PC9 (D) and LLC (E) cells. The interface between mouse brain slice (red) and tumor cells (green) is shown following treatment with or without cytokine cocktail. Scale bars: 100 µm. (F) and (G) Quantification of cancer cell invasion in the brain slice invasion assay for PC9 (F) and LLC (G) cells. One point represents a single brain slice with a tumor plug containing 105 cells; the entire brain-tumor interface was quantified in each slice. Left panel: the number of cells that invaded further than 200 µm into the brain in each brain slice. Right panel: the distance from the brain-tumor interface to an invaded cell was summed for all cells that invaded further than 200 µm into the brain. P-values were calculated with the Student’s t-test.
Figure 4.
Figure 4.
Chitinase 3 Like-1 is an astrocyte derived factor that is elevated in highly invasive brain metastases. (A) Schematic of workflow for murine astrosphere generation, cytokine treatment (0.1 µg/mL TGF-α, 0.1 µg/mL MIF, 0.01 µg/mL EGF) and conditioned media collection for proteomic analyses. (B) Label-free quantification (LFQ) of CHI3L1 peptides in pSTAT3- vs. pSTAT3+ astrospheres. (C) Representative immunohistofluorescence staining for CHI3L1 (red) and nuclei (blue) in minimally invasive (MI; left) and highly invasive (HI; right) patient brain metastases. Quantification of the percentage of CHI3L1-positive stromal cells is shown in the right-most panel. Scale bars: 100 µm. (D) Representative images of intracranially injected MI (top) and HI (bottom) patient-derived xenograft brain metastasis models labeled with RNAscope in situ hybridization for Chi3l1 (red). Scale bars: 400 µm (left), 200 µm (middle), 100 µm (right). The percentage of Chi3l1+ pixels in stroma calculated from 1 entire section of brain harboring brain metastases is quantified in the right-most panel. P-values were calculated with Mann-Whitney test.
Figure 5.
Figure 5.
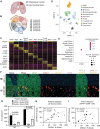
Single-cell RNA sequencing and immunohistofluorescent staining of patient brain metastases reveal astrocytes as the predominant source of CHI3L1. (A) Schematic depicting the sampling approach for each patient. MC denotes metastasis center and SB denotes the surrounding brain. Image created with BioRender. (B) Number of cells sequenced per sample from each of the 4 patients. Color refers to individual patient; pattern refers to sample location (MC vs SB). (C) Heatmap depicting the top 100 expressed genes per cell for each cluster. Example canonical genes for each cluster are labeled on the left. (D) Uniform manifold approximation and projection (UMAP) indicate cell clusters from the entire dataset. (E) CHI3L1 expression level and frequency across all cell clusters. The circle size reflects the percentage of cells in the cluster expressing CHI3L1; circle color indicates the average CHI3L1 expression level in the cluster. (F) Representative images of multiplex IHF staining for GFAP (green), CHI3L1 (red), pSTAT3 (Y705, yellow), CD68 (pink) and nuclei (blue) in MI (top) and HI (bottom) patient brain metastasis samples. Scale bars: 500 µm (lower magnification), 50 µm (higher magnification). (G) Quantification of the multiplex IHF staining in (F). The graph depicts the number of cells per mm2 of each cell type (CHI3L1+/GFAP+/CD68-, CHI3L1+/GFAP-/CD68+, CHI3L1+/GFAP-/CD68-), in MI (n = 9) and HI (n = 8) BrM patient samples. P-values were calculated using one-way ANOVA. (H) Correlation plot of pSTAT3 and CHI3L1 H-Scores in all samples studied. Analysis was restricted to all stromal cells. (I) Correlation plot of pSTAT3 and CHI3L1 H-Scores in GFAP+/CD68- cells in patient BrM (MI and HI, n = 17). Pearson’s correlation is shown.
Figure 6.
Figure 6.
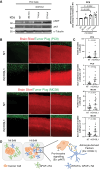
CHI3L1 contributes to cancer cell invasion within the brain. (A) Immunoblot of PC9 lung cancer cells treated with recombinant human CHI3L1 at indicated timepoints. Band intensity (pAKT/total AKT) was quantified and normalized to untreated conditions. NT denotes non-treated cells. (B) Representative images of brain slice invasion assay using PC9 (upper) or MC38 (lower) cells. The interface between mouse brain slice (red) and tumor cells (green) is shown following treatment with or without recombinant human CHI3L1. Scale bars: 100 µm. (C) Quantification of cancer cell invasion in the brain slice invasion assay depicted in panel B for PC9 (graphs 1, 2) and MC38 (graphs 3, 4) cells. One point represents a single brain slice with a tumor plug containing 105 cells; the entire brain–tumor interface was quantified in each slice. Graphs 1, 3: the number of cells that invaded further than 200 µm into the brain in each brain slice. Graphs 2, 4: the distance from the brain–tumor interface to an invaded cell was summed for all cells that invaded further than 200 µm into the brain. (D) Working model of the role of pSTAT3+RAs in BrM. pSTAT3+RAs (blue) are more abundant and form greater contacts with HI BrM compared to MI BrM. pSTAT3+RA-derived CHI3L1 promotes metastatic cancer cell invasion via activation of pro-invasive signaling pathways such as AKT. Abbreviations: pAKT, phosphorylated AKT; NT, no treatment; rhCHI3L1, recombinant human chitinase 3 like-1; RA, reactive astrocyte; MI, minimally invasive; HI, highly invasive. P-values were calculated using Student’s t-test.

References

    1. Suh JH, Kotecha R, Chao ST, et al.. Current approaches to the management of brain metastases. Nat Rev Clin Oncol. 2020;17(5):279–299. - PubMed
    1. Nayak L, Lee EQ, Wen PY.. Epidemiology of brain metastases. Curr Oncol Rep. 2012;14(1):48–54. - PubMed
    1. Han CH, Brastianos PK.. Genetic characterization of brain metastases in the era of targeted therapy. Front Oncol.2017;7(230):1-11. - PMC - PubMed
    1. Valiente M, Ahluwalia MS, Boire A, et al.. The evolving landscape of brain metastasis. Trends Cancer. 2018;4(3):176–196. - PMC - PubMed
    1. Singh Achrol A, Rennert RC, Anders C, et al.. Brain metastases. Nat Rev Dis Prim. 2019;5(5):1–26. - PubMed

Publication types