. 2024 May 1;36(5):1963-1984.
doi: 10.1093/plcell/koae022.

ELONGATED HYPOCOTYL 5a modulates FLOWERING LOCUS T2 and gibberellin levels to control dormancy and bud break in poplar

Affiliations

ELONGATED HYPOCOTYL 5a modulates FLOWERING LOCUS T2 and gibberellin levels to control dormancy and bud break in poplar

Yongfeng Gao et al. Plant Cell. .

Abstract

Photoperiod is a crucial environmental cue for phenological responses, including growth cessation and winter dormancy in perennial woody plants. Two regulatory modules within the photoperiod pathway explain bud dormancy induction in poplar (Populus spp.): the circadian oscillator LATE ELONGATED HYPOCOTYL 2 (LHY2) and GIGANTEA-like genes (GIs) both regulate the key target for winter dormancy induction FLOWERING LOCUS T2 (FT2). However, modification of LHY2 and GIs cannot completely prevent growth cessation and bud set under short-day (SD) conditions, indicating that additional regulatory modules are likely involved. We identified PtoHY5a, an orthologs of the photomorphogenesis regulatory factor ELONGATED HYPOCOTYL 5 (HY5) in poplar (Populus tomentosa), that directly activates PtoFT2 expression and represses the circadian oscillation of LHY2, indirectly activating PtoFT2 expression. Thus, PtoHY5a suppresses SD-induced growth cessation and bud set. Accordingly, PtoHY5a knockout facilitates dormancy induction. PtoHY5a also inhibits bud-break in poplar by controlling gibberellic acid (GA) levels in apical buds. Additionally, PtoHY5a regulates the photoperiodic control of seasonal growth downstream of phytochrome PHYB2. Thus, PtoHY5a modulates seasonal growth in poplar by regulating the PtoPHYB2-PtoHY5a-PtoFT2 module to determine the onset of winter dormancy, and by fine-tuning GA levels to control bud-break.


Conflict of interest statement

Conflict of interest statement. The authors declare that they have no known competing financial interests or personal relationships that could have appeared to influence the work reported in this paper.

Figures
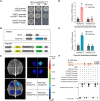
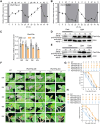
Figure 1.
Figure 1.
PtoHY5a activates PtoFT2 by directly binding to its promoter. A) Y1H analysis of the interaction between PtoHY5a and the promoter of PtoFT2. SD/−Leu/AbA, synthetic medium lacking leucine, supplemented with 0, 100 and 200 ng·mL−1 aureobasidin A (AbA), as indicated. B) The effector, reporter, and reference constructs used in the luciferase activity tests are depicted schematically. PtoHY5a under the control of the 35S promoter (Pro35S) was used as the effector. The firefly luciferase gene LUC driven by the PtoFT2 promoter (ProPtoFT2) and the Renilla luciferase gene REN under the control of the 35S promoter were used as the reporter and internal control, respectively. The ProPtoFT2-m indicates the promoter of PtoFT2 harboring the mutated ACE-box (AAAA). C) Luciferase activity assay showing that PtoHY5a binds to the promoter region of PtoFT2 was measured in N. benthamiana leaves, PtoHY5a activate PtoFT2 promoter activities. The color bar indicates the intensity of luciferase activity. Replacing the ACE-box with AAAA in PtoFT2 promoters resulted in the loss of transcriptional regulation by PtoHY5a on target promoters. D) Quantitative analysis of relative luciferase activity of the experimental materials in N. benthamiana leaves. Three randomly selected fields from three individual N. benthamiana plants per group were used for counting. E) Quantitative analysis of relative luciferase activity of the experimental materials in protoplasts from P. tomentosa. (C to E) The ProPtoFT2 indicates the promoter of PtoFT2 gene. The ProPtoFT2-m indicates the promoter of PtoFT2 harboring the mutated ACE-box (AAAA). The relative luciferase activities are normalized to the Renilla luciferase activity (Relative LUC:REN activity). F) EMSA analysis showed that PtoHY5a directly binds to the ACE-box of the PtoFT2 promoter in vitro. The black ellipse indicates the position of the ACE-box, p1 to p3 are EMSA probes. Recombinant PtoHY5a was isolated from E. coli cells, and DNA-binding experiments using PtoFT2 and PtoFT2 mutant probes were conducted. As negative controls, purified proteins from empty vectors were employed. Error bars indicate mean ± Sd from three biological replicates and different lowercase letters indicate significant differences (P < 0.05) based on two-way ANOVA followed by Fisher's LSD test.
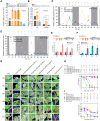
Figure 2.
Figure 2.
Effects of PtoHY5a expression changes on the bud set in poplar. A, B) Diurnal expression analysis of PtoHY5a in leaves of poplar grown under LD conditions (16 h:8 h, light:dark; LD16h, 22 °C) (A) and SD conditions (8 h:16 h, light:dark; SD8h, 22 °C) (B). C) Expression analysis of PtoHY5a in LD16h and SD8h treatments. ML of the same leaf position at different treatment times were taken for the experiment at ZT14 (Zeitgeber Time). Its expression in LD16h was used as a control. Leaf tissues were collected for RNA extraction followed by RT-qPCR assays. PtoUBQ was used as a reference gene. Error bars indicate mean ± Sd from three biological replicates and different lowercase letters indicate significant differences (P < 0.05) based on one-way ANOVA followed by Fisher's LSD test. D, E) Western blots showed PtoHY5a protein expression level in LD16h(D) and SD8h(E) conditions. Samples were harvested at the indicated times and subjected to immunoblot analysis. Samples were analyzed by immunoblotting with anti-PtoHY5a antibody and anti-Actin antibody. Actin served as a loading control. Gray and white boxes indicate night and day, respectively. F) Apical buds of WT, PtoHY5a-OE (PtoHY5a overexpressing lines 4, 5 and 6), and PtoHY5a-KO (PtoHY5a knockout lines 5 and 7) plants after 4 and 6 wk of SD8h conditions (arrows indicate apical buds that have stopped growing). Scale bars indicate 1 cm. G) Bud set score of WT, PtoHY5a-OE, and PtoHY5a-KO plants after transfer from LD16h to SD8h conditions. H) Cumulative shoot elongation in WT, PtoHY5a-OE, and PtoHY5a-KO plants after transfer from LD16h to SD8h conditions. Data shown are the mean values from five individual plants of each line. Error bars indicate mean ± Sd and different lowercase letters indicate significant differences (P < 0.05) based on one-way ANOVA followed by Fisher's LSD test.
Figure 3.
Figure 3.
PtoHY5a mediates in photoperiodic control of bud break. A) Apical buds of WT, PtoHY5a-OE (PtoHY5a overexpressing lines 4, 5 and 6), and PtoHY5a-KO (PtoHY5a knockout lines 5 and 7) plants after 3 mo of cold, SD conditions (8 h:16 h, light:dark; SD8h, 4 °C) were shifted to warm, LD conditions (16 h:8 h, light:dark; LD16h, 22 °C). Scale bars indicate 1 cm. B) Dynamics of bud break in PtoHY5a-OE and PtoHY5a-KO plants compared with WT. Timing and degree of bud break following 3 mo of chilling (4 °C) and subsequent bud break under LD and warm temperatures. Values are means of five biological replicates. C) Classification of the different apex stages during bud break used to monitor growth reactivation. D) Bud break score of WT, PtoHY5a-OE, and PtoHY5a-KO plants after transfer from cold, SD conditions (SD8h, 4 °C) to warm, LD conditions (LD16h, 25 °C). E) Bud breaking phenotypes of 2-yr-old WT, PtoHY5a-OE (lines 4, 5, and 6) and PtoHY5a-KO (lines 5 and 7) plants growing in the field in March 20. Scale bars indicate 5 cm. Data shown are the mean values from five individual plants of each line. Error bars indicate mean ± Sd and different lowercase letters indicate significant differences (P < 0.05) based on one-way ANOVA followed by Fisher's LSD test.
Figure 4.
Figure 4.
Overexpression of PtoFT2 suppresses bud set in PtoHY5a-KO under SDs. A) Relative expression levels of PtoFT2 in leaves of WT, PtoHY5a-OE (PtoHY5a overexpressing lines 4, 5 and 6), and PtoHY5a-KO (PtoHY5a knockout lines 5 and 7) lines. Poplar plants were grown under LD conditions (16 h:8 h, light:dark; LD16h, 22 °C) for 4 wk, and ML of the same leaf position were taken for the experiment at ZT10 (Zeitgeber Time). B) Comparative expression analysis of PtoFT2 in leaves of WT, PtoHY5a-OE, and PtoHY5a-KO plants grown under LD16h conditions, and 5 wk after transfer to SD conditions (8 h:16 h, light:dark; SD8h, 22 °C). ML of the same leaf position at different treatment conditions were taken for the experiment at ZT10 (Zeitgeber time). Error bars indicate mean ± Sd from three biological replicates and asterisks indicate statistical differences (**P < 0.01; ***P < 0.001; Student's t-test). C, D) Diurnal expression analysis of PtoFT2 in leaves of WT, PtoHY5a-OE and PtoHY5a-KO plants grown under LD16h(C) and SD8h(D) conditions. Leaf tissues were collected for RNA extraction followed by RT-qPCR assays. PtoUBQ was used as a reference gene. Error bars indicate mean ± Sd and different lowercase letters indicate significant differences (P < 0.05) based on one-way ANOVA followed by Fisher's LSD test. E, F) Enrichment of a DNA fragment in the PtoFT2 promoter containing an ACE-box and quantified by ChIP-qPCR. The position diagram of the primer sets (#1 to #3) on the promoter used in ChIP-qPCR assays are shown above. NC indicates the location of the DNA fragment in the 3′ UTR region, with no ACE-box as a negative control. Chromatin from leaves of HA-PtoHY5a-OE and WT was isolated using anti-HA (E) and anti-PtoHY5a (F) antibody, respectively. IgG was used as a negative control. ChIP-purified DNA was used to perform ChIP-qPCR and expression values are represented as the percentage of input DNA. Error bars indicate mean ± Sd from three biological replicates and different lowercase letters indicate significant differences (P < 0.05) based on two-way ANOVA followed by Fisher's LSD test. G) Apical buds of WT, PtoFT2-OE (PtoFT2 overexpressing line), PtoHY5a-KO/PtoFT2-OE (Transgenic lines overexpressing PtoFT2 in PtoHY5a-KO-L7 mutant poplar, 1, 2 and 3), PtoHY5a-OE (PtoHY5a overexpressing line 6), and PtoHY5a-KO (PtoHY5a knockout line 7) plants after 6 wk of SD8h conditions (arrows indicate apical buds that have stopped growing). Scale bars indicate 1 cm. Bud set score (H) and height increment (I) of WT, PtoFT2-OE, PtoHY5a-KO/PtoFT2-OE (lines 1, 2 and 3), PtoHY5a-OE (line 6), and PtoHY5a-KO (line 7) plants after transfer from LD16h to SD8h conditions. Data shown are the mean values from five individual plants of each line. Error bars indicate mean ± Sd and different lowercase letters indicate significant differences (P < 0.05) based on one-way ANOVA followed by Fisher's LSD test.
Figure 5.
Figure 5.
PtoHY5a affects the expression of clock genes PtoLHY2.A) Expression analysis of PtoLHY2 in the WT, PtoHY5a-OE (PtoHY5a overexpressing lines 4, 5, and 6), and PtoHY5a-KO (PtoHY5a knockout lines 5 and 7) plants. Poplar plants were grown under LD conditions (16 h:8 h, light:dark; LD16h, 22 °C) for 4 wk, ML of the same leaf position were taken for the experiment at ZT0 (Zeitgeber Time). Error bars indicate mean ± Sd from three biological replicates and asterisks indicate statistical differences (**P < 0.01; ***P < 0.001; Student's t-test). B, C) Diurnal expression analysis of PtoLHY2 in leaves of WT, PtoHY5a-OE, and PtoHY5a-KO plants grown under LD16h(B) conditions and SD conditions (8 h:16 h, light:dark; SD8h, 22 °C) (C). Leaf tissues were collected for RNA extraction followed by RT-qPCR assays. PtoUBQ was used as a reference gene. Error bars indicate mean ± Sd from three biological replicates and different lowercase letters indicate significant differences (P < 0.05) according to one-way ANOVA followed by a Fisher's LSD test. D) The effector, reporter and reference constructs used in the luciferase activity tests are depicted schematically. REN, Renilla luciferase; LUC, firefly luciferase. E) Luciferase activity assay showing that PtoHY5a binds to the promoter region of PtoLHY2 was measured in N. benthamiana leaves. The color bar indicates the intensity of luciferase activity. F) Quantitative analysis of relative luciferase activity of the experimental materials in N. benthamiana leaves. Three randomly selected fields from three individual N. benthamiana plants per group were used for counting. G) Quantitative analysis of relative luciferase activity of the experimental materials in protoplasts from P. tomentosa. In (E) to (G), The ProPtoLHY2 indicates the promoter of PtoLHY2 gene. The ProPtoLHY2-m indicates the promoter of PtoLHY2 harboring the mutated ACE-box (AAAA). Error bars indicate mean ± Sd from three biological replicates and different lowercase letters indicate significant differences (P < 0.05) based on two-way ANOVA followed by Fisher's LSD test. H) The position diagram of the probe and primer on the promoter used in EMSA and ChIP-qPCR assays. The position diagram of the primer sets (#1 and #2) on the promoter used in ChIP-qPCR assays are shown above. NC indicates the location of the DNA fragment in the 3′ UTR region, with no ACE-box as a negative control. I) EMSA analysis showed that PtoHY5a directly binds to the ACE-box of the PtoLHY2 promoter in vitro. The black ellipse indicates the position of the ACE-box, p1 and p2 are EMSA probes. Recombinant PtoHY5a was isolated from E. coli cells, and DNA-binding experiments using PtoLHY2 and PtoLHY2 mutant probes were conducted. As negative controls, purified proteins from empty vectors were employed. J, K) Enrichment of a DNA fragment in the PtoLHY2 promoter containing the ACE-box and quantified by ChIP-qPCR. Chromatin from leaves of HA-PtoHY5a-OE and WT was isolated using anti-HA (J) and anti-PtoHY5a (K) antibody, respectively. IgG was used as a control antibody. ChIP-purified DNA was used to perform ChIP-qPCR and expression values are represented as the percentage of input DNA. Error bars indicate mean ± Sd from three biological replicates and different lowercase letters indicate significant differences (P < 0.05) based on two-way ANOVA followed by Fisher's LSD test.
Figure 6.
Figure 6.
Overexpression of PtoPHYB2 does not affect bud formation in PtoHY5a-KO plants during SDs. A, B) Diurnal expression analysis of PtoPHYB2 in leaves of poplar under LD conditions (16 h:8 h, light:dark; LD16h, 22 °C) (A) and SD conditions (8 h:16 h, light:dark; SD8h, 22 °C) (B). C) Expression analysis of PtoPHYB2 in LD16h and SD8h treatments. ML of the same leaf position at different treatment times were taken for the experiment at ZT4 (Zeitgeber Time). Error bars indicate mean ± Sd from three biological replicates and different lowercase letters indicate significant differences (P < 0.05) based on one-way ANOVA followed by Fisher's LSD test. D) Expression of PtoHY5a in the WT, PtoPHYB2-OE (PtoPHYB2 overexpressing lines 3, 9, and 10), and PtoPHYB1/2-RNAi (PtoPHYB1/2 RNA co-interference lines 3, 6, and 9). Poplar plants were grown under LD16h for 4 wk, ML of the same leaf position were taken for the experiment at ZT4 (Zeitgeber Time). Error bars indicate mean ± Sd from three biological replicates and asterisks indicate statistical differences (*P < 0.05; ***P < 0.001; Student's t-test). E) Apical buds of WT, PtoHY5a-KO (PtoHY5a knockout line 7), PtoHY5a-KO/PtoPHYB2-OE (Transgenic lines overexpressing PtoPHYB2 in PtoHY5a-KO-L7 mutant plant, 15, 16, and 17), PtoPHYB2-OE (PtoPHYB2 overexpressing line 10), and PtoPHYB1/2-RNAi (PtoPHYB1/2 RNA co-interference line 9) plants after 3 and 4 wk under SD8h conditions (arrows indicate apical buds that have stopped growing). Scale bars indicate 1 cm. F) The relative expression levels of PtoPHYB2 in WT, PtoHY5a-KO (line 7), PtoHY5a-KO/PtoPHYB2-OE (lines 15, 16 and 17), PtoPHYB2-OE (line 10), and PtoPHYB1/2-RNAi (line L9) plants. Leaf tissues were collected for RNA extraction followed by RT-qPCR assays. PtoUBQ was used as a reference gene. Error bars indicate mean ± Sd from three biological replicates and asterisks indicate statistical differences (*P < 0.05; ***P < 0.001; ns, not significant; Student's t-test). G) Bud set score of WT, PtoHY5a-KO (line 7), PtoHY5a-KO/PtoPHYB2-OE (lines 15, 16, and 17), PtoPHYB2-OE (line 10) and PtoPHYB1/2-RNAi (line 9) plants after transfer from LD16h to SD8h conditions. Data shown are the mean values from five individual plants of each line. Error bars indicate mean ± Sd and different lowercase letters indicate significant differences (P < 0.05) based on one-way ANOVA followed by Fisher's LSD test.
Figure 7.
Figure 7.
PtoHY5a is involved in GA metabolism during poplar bud breaking. A) Comparative expression analyses of GA deactivation genes GA2ox1, GA2ox3, GA2ox4, GA2ox5, GA2ox6, GA2ox7, and (B) GA biosynthesis genes GA3ox2, GA20ox2-1, GA20ox3, GA20ox5, GA20ox6, and GA20ox8 in apical buds of WT, PtoHY5a-OE (PtoHY5a overexpressing line 6), and PtoHY5a-KO (PtoHY5a knockout line 7) plants after 3 mo of SD and cold treatments (8 h:16 h at 4 °C, SD8h; 3MC) and then after 2 wk under long-day and warm temperatures (16 h:8 h at 25 °C, LD16h; 2WW) treatment. C to E) Schematic representation of GA metabolism. C) The endogenous levels of GA12, GA15, GA24, GA9, GA4, GA53, GA44, GA19, GA20, and GA1 in apical buds of WT, PtoHY5a-OE, and PtoHY5a-KO plants. D) The contents of GA7 and GA51 generated with GA9 as a precursor, and the content of GA34 generated with GA4 as a precursor. E) The contents of GA5 and GA29 generated with GA20 as a precursor, and the content of GA8 generated with GA1 as a precursor. Apical bud tissues were collected for RNA extraction followed by RT-qPCR assays. PtoUBQ was used as a reference gene. Error bars indicate mean ± Sd from three biological replicates and asterisks indicate statistical differences (*P < 0.05; **P < 0.01; ***P < 0.001; ns, not significant; Student's t-test).
Figure 8.
Figure 8.
A model for how PHYB2-HY5a-FT2 and HY5a-GA control seasonal growth in poplars. Long photoperiods promote the expression of HY5a by activating PHYB. The downstream target of HY5a is FT2, a key positive regulator of shoot apex development. Meanwhile, HY5a further upregulates the expression of FT2 by repressing LHY2, a clock oscillator that negatively regulates FT2 and CO. The accumulation of FT2 modulates the integrator AIL1 to promote active growth in the apex. At the same time, HY5a promotes GA deactivation in leaves and apical buds by both FT2-dependent and FT2-independent ways, ultimately controlling plant height. In contrast, short photoperiodic signals negatively regulate HY5a by inhibiting PHYB2. Declining HY5a expression leads to the downregulation of FT2 in shoot apex, which ultimately may cause growth cessation and bud set. Additionally, the HY5a inhibits bud break with chilling through reducing GAs levels in shoot apex. Dotted lines reflect linkages that need to be described further, whereas solid lines represent direct genetic interactions or proven impacts on development processes. Arrows indicate activation, whereas flat-ended arrows indicate repression.

References

    1. André D, Marcon A, Lee KC, Goretti D, Zhang B, Delhomme N, Schmid M, Nilsson O. FLOWERING LOCUS T paralogs control the annual growth cycle in Populus trees. Curr Biol. 2022:32(13):2988–2996.e4. 10.1016/j.cub.2022.05.023 - DOI - PubMed
    1. Azeez A, Miskolczi P, Tylewicz S, Bhalerao RP. A tree ortholog of APETALA1 mediates photoperiodic control of seasonal growth. Curr Biol. 2014:24(7):717–724. 10.1016/j.cub.2014.02.037 - DOI - PubMed
    1. Böhlenius H, Huang T, Charbonnel-Campaa L, Brunner AM, Jansson S, Strauss SH, Nilsson O. CO/FT regulatory module controls timing of flowering and seasonal growth cessation in trees. Science. 2006:312(5776):1040–1043. 10.1126/science.1126038 - DOI - PubMed
    1. Burman N, Bhatnagar A, Khurana JP. OsbZIP48, a HY5 transcription factor ortholog, exerts pleiotropic effects in light-regulated development. Plant Physiol. 2018:176(2):1262–1285. 10.1104/pp.17.00478 - DOI - PMC - PubMed
    1. Chen Z, Peng Z, Liu S, Leng H, Luo J, Wang F, Yi Y, Resco de Dios V, Lucas GR, Yao Y, et al. . Overexpression of PeNAC122 gene promotes wood formation and tolerance to osmotic stress in poplars. Physiol Plant. 2022:174(4):e13751. 10.1111/ppl.13751 - DOI - PubMed

Publication types

LinkOut - more resources