. 2024 Jan 25;20(1):e1011880.
doi: 10.1371/journal.ppat.1011880. eCollection 2024 Jan.

West Nile virus spread in Europe: Phylogeographic pattern analysis and key drivers

Affiliations

West Nile virus spread in Europe: Phylogeographic pattern analysis and key drivers

Lu Lu et al. PLoS Pathog. .

Abstract

Background: West Nile virus (WNV) outbreaks in birds, humans, and livestock have occurred in multiple areas in Europe and have had a significant impact on animal and human health. The patterns of emergence and spread of WNV in Europe are very different from those in the US and understanding these are important for guiding preparedness activities.

Methods: We mapped the evolution and spread history of WNV in Europe by incorporating viral genome sequences and epidemiological data into phylodynamic models. Spatially explicit phylogeographic models were developed to explore the possible contribution of different drivers to viral dispersal direction and velocity. A "skygrid-GLM" approach was used to identify how changes in environments would predict viral genetic diversity variations over time.

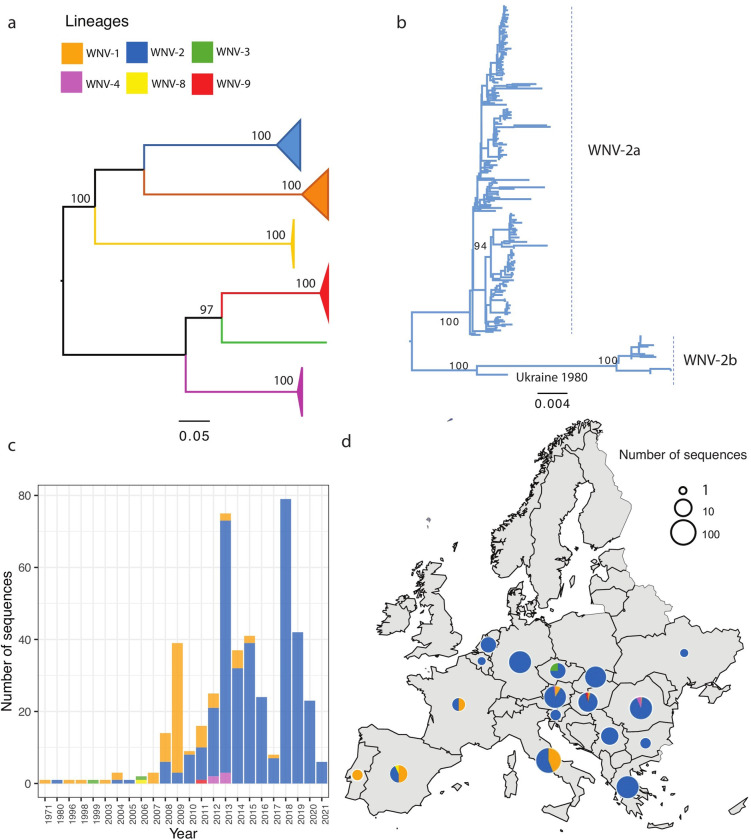
Findings: Among the six lineages found in Europe, WNV-2a (a sub-lineage of WNV-2) has been predominant (accounting for 73% of all sequences obtained in Europe that have been shared in the public domain) and has spread to at least 14 countries. In the past two decades, WNV-2a has evolved into two major co-circulating clusters, both originating from Central Europe, but with distinct dynamic history and transmission patterns. WNV-2a spreads at a high dispersal velocity (88km/yr-215 km/yr) which is correlated to bird movements. Notably, amongst multiple drivers that could affect the spread of WNV, factors related to land use were found to strongly influence the spread of WNV. Specifically, the intensity of agricultural activities (defined by factors related to crops and livestock production, such as coverage of cropland, pasture, cultivated and managed vegetation, livestock density) were positively associated with both spread direction and velocity. In addition, WNV spread direction was associated with high coverage of wetlands and migratory bird flyways.

Conclusion: Our results suggest that-in addition to ecological conditions favouring bird- and mosquito- presence-agricultural land use may be a significant driver of WNV emergence and spread. Our study also identified significant gaps in data and the need to strengthen virological surveillance in countries of Central Europe from where WNV outbreaks are likely seeded. Enhanced monitoring for early detection of further dispersal could be targeted to areas with high agricultural activities and habitats of migratory birds.


Conflict of interest statement

The authors have declared that no competing interests exist.

Figures

Fig 1
Fig 1. Phylogenetic analysis of WNV full and partial nucleotide sequences detected from Europe.
The evolutionary distances were computed using the optimal GTR+I model, the phylogenetic tree was constructed with the Maximum likelihood (ML) method. Bootstrap values are given for 1000 replicates. (a) ML tree of all lineages found in Europe. The branches of lineages are all collapsed and shown as rectangles; (b) The subtree of WNV-2 sequences; (c) The WNV lineages distribution over time using the same color showing on the tree; (d) The geographical distribution of WNV lineages. Map with a small pie chart showing the total number of sequences detected (on a logarithmic scale) per country, with each slice proportional to the number of distinct WNV lineages within that country. The European shapefile used in the study was obtained from Data and Maps for ArcGIS (formerly Esri Data & Maps, https://www.arcgis.com/home/group.html?id=24838c2d95e14dd18c25e9bad55a7f82#overview) under a CC-BY 4.0 license.
Fig 2
Fig 2. Time-scaled phylogeny of WNV-2a genomes in Europe.
(a) Time-scaled MCC (maximum clade credibility) tree of WNV full genome sequences isolated in Europe (n = 192), the two clusters A and B are labelled on the right. A distinct phylogeographic analysis has been based on the NS3 gene by continuous phylogeographic inference based on 1,000 posterior trees. Spatiotemporal diffusion of all WNV- 2a in Europe (b), of Cluster A (c) and Cluster B (d). These MCC trees are superimposed on 80% of the highest posterior density (HPD) interval reflecting phylogeographic uncertainty. Nodes of the trees, as well as HPD regions, are colored by timescale from red (the time to the most recent common ancestor, TMRCA) to green (most recent sampling time), and the oldest nodes (and corresponding HPD regions) are here plotted on top of youngest nodes. The European shapefile was created using the R package “raster” (https://cran.r-project.org/web/packages/raster/).
Fig 3
Fig 3. Comparisons of two co-circulating clusters of WNV-2a in Europe.
(a) The mean time of the most recent ancestor (TMRCA) and 95%HPD interval for each cluster. (b) The mean clock rate (substitutions per site per year, subst./site/yr) and 95% HPD interval for each cluster was estimated using an uncorrelated relaxed molecular clock model. (c) The Mean number of Markov jump between countries and 95%HPD interval for each cluster were estimated using a continuous-time Markov chain (CTMC) model. (d) Estimation of effective population size via time and a 95% HPD interval using the Skygrid coalescent model. The logarithmic effective number of infections (Ne) vs. viral generation time (t), representing effective transmissions is plotted over time. (e) The mean of weighted dispersal velocity averaged over the branches of the entire tree (km/yr) and (f) The weighted dispersal velocity over time (km/yr) with a 95% HPD interval estimated using the continuous phylogenetic diffusion model.
Fig 4
Fig 4. Quantified transmission network of WNV-2a between European countries and within Greece inferred using discrete trait models.
The shape of colors on the map indicates the number of samples; the edge weight indicates the median number of transmissions between pairs of countries/regions; the arrow on the edge indicates transmission direction; color of the edge from light to dark indicates Bayes Factor (BF) support from low to high only transmissions with BF>3 are shown). The European shapefile was created using the R package “rnaturalearth” (https://cran.r-project.org/web/packages/rnaturalearth/).
Fig 5
Fig 5. Dispersal history of WNV-2a in Europe between 2004 to 2021.
Colors of the dots represent interpolated maximum clade credibility phylogeny positions for clusters A (yellow) and B (purple) from NS3. Please see S1 Movie for the full movie. The European shapefile was created using the R package “maps” (https://cran.r-project.org/web/packages/maps/).
Fig 6
Fig 6. Explanatory factors significantly attract WNV dispersal in Europe.
There are eleven factors (out of the total 37 factors being tested) that may attract WNV dispersal with strong statistical support (BF>20, as shown in S1 Table). The first four panels represent the percentage covered by each of the land cover types (Cropland, Urban land, land area changes from cropland to urban land, and Cultivated and Managed Vegetation) in 2015 in each grid cell. The visualizations and full descriptions of all factors are in the (S1 Fig and S2 Table). The unit of each predictor is shown after the predictor name above each panel. The European shapefile was created using the R package “rworldmap” (https://cran.r-project.org/web/packages/rworldmap/).
Fig 7
Fig 7. Explanatory factors have a significant impact on WNV dispersal velocity in Europe.
There are four factors (out of the total 37 factors being tested) that may speed up WNV dispersal with strong statistical support (BF>20, as shown in S2 Table). The first two panels represent the percentage covered by each of the land cover types (Cropland, Pasture) in 2015 in each grid cell. The visualizations and full descriptions of all factors are in the (S1 Fig and S2 Table). The unit of each predictor is shown after the predictor name above each panel. The European shapefile was created using the R package “rworldmap” (https://cran.r-project.org/web/packages/rworldmap/).

References

    1. Colpitts TM, Conway MJ, Montgomery RR, Fikrig E. West Nile Virus: biology, transmission, and human infection. Clin Microbiol Rev. 2012;25(4):635–48. Epub 2012/10/05. doi: 10.1128/CMR.00045-12 ; PubMed Central PMCID: PMC3485754. - DOI - PMC - PubMed
    1. Napp S, Petric D, Busquets N. West Nile virus and other mosquito-borne viruses present in Eastern Europe. Pathog Glob Health. 2018;112(5):233–48. Epub 2018/07/07. doi: 10.1080/20477724.2018.1483567 ; PubMed Central PMCID: PMC6225508. - DOI - PMC - PubMed
    1. Kramer LD. West Nile Virus. In: Mahy BWJ, Van Regenmortel MHV, editors. Encyclopedia of Virology (Third Edition). Oxford: Academic Press; 2008. p. 440–50.
    1. Engler O, Savini G, Papa A, Figuerola J, Groschup MH, Kampen H, et al.. European surveillance for West Nile virus in mosquito populations. Int J Environ Res Public Health. 2013;10(10):4869–95. Epub 2013/10/26. doi: 10.3390/ijerph10104869 ; PubMed Central PMCID: PMC3823308. - DOI - PMC - PubMed
    1. Rizzoli A, Jimenez-Clavero MA, Barzon L, Cordioli P, Figuerola J, Koraka P, et al.. The challenge of West Nile virus in Europe: knowledge gaps and research priorities. Euro Surveill. 2015;20(20). Epub 2015/06/02. doi: 10.2807/1560-7917.es2015.20.20.21135 . - DOI - PubMed