. 2024 Feb 7;35(2):266-274.
doi: 10.1021/jasms.3c00353. Epub 2024 Jan 25.

Weighting Low-Intensity MS/MS Ions and m/ z Frequency for Spectral Library Annotation

Affiliations

Weighting Low-Intensity MS/MS Ions and m/ z Frequency for Spectral Library Annotation

Chloe Engler Hart et al. J Am Soc Mass Spectrom. .

Abstract

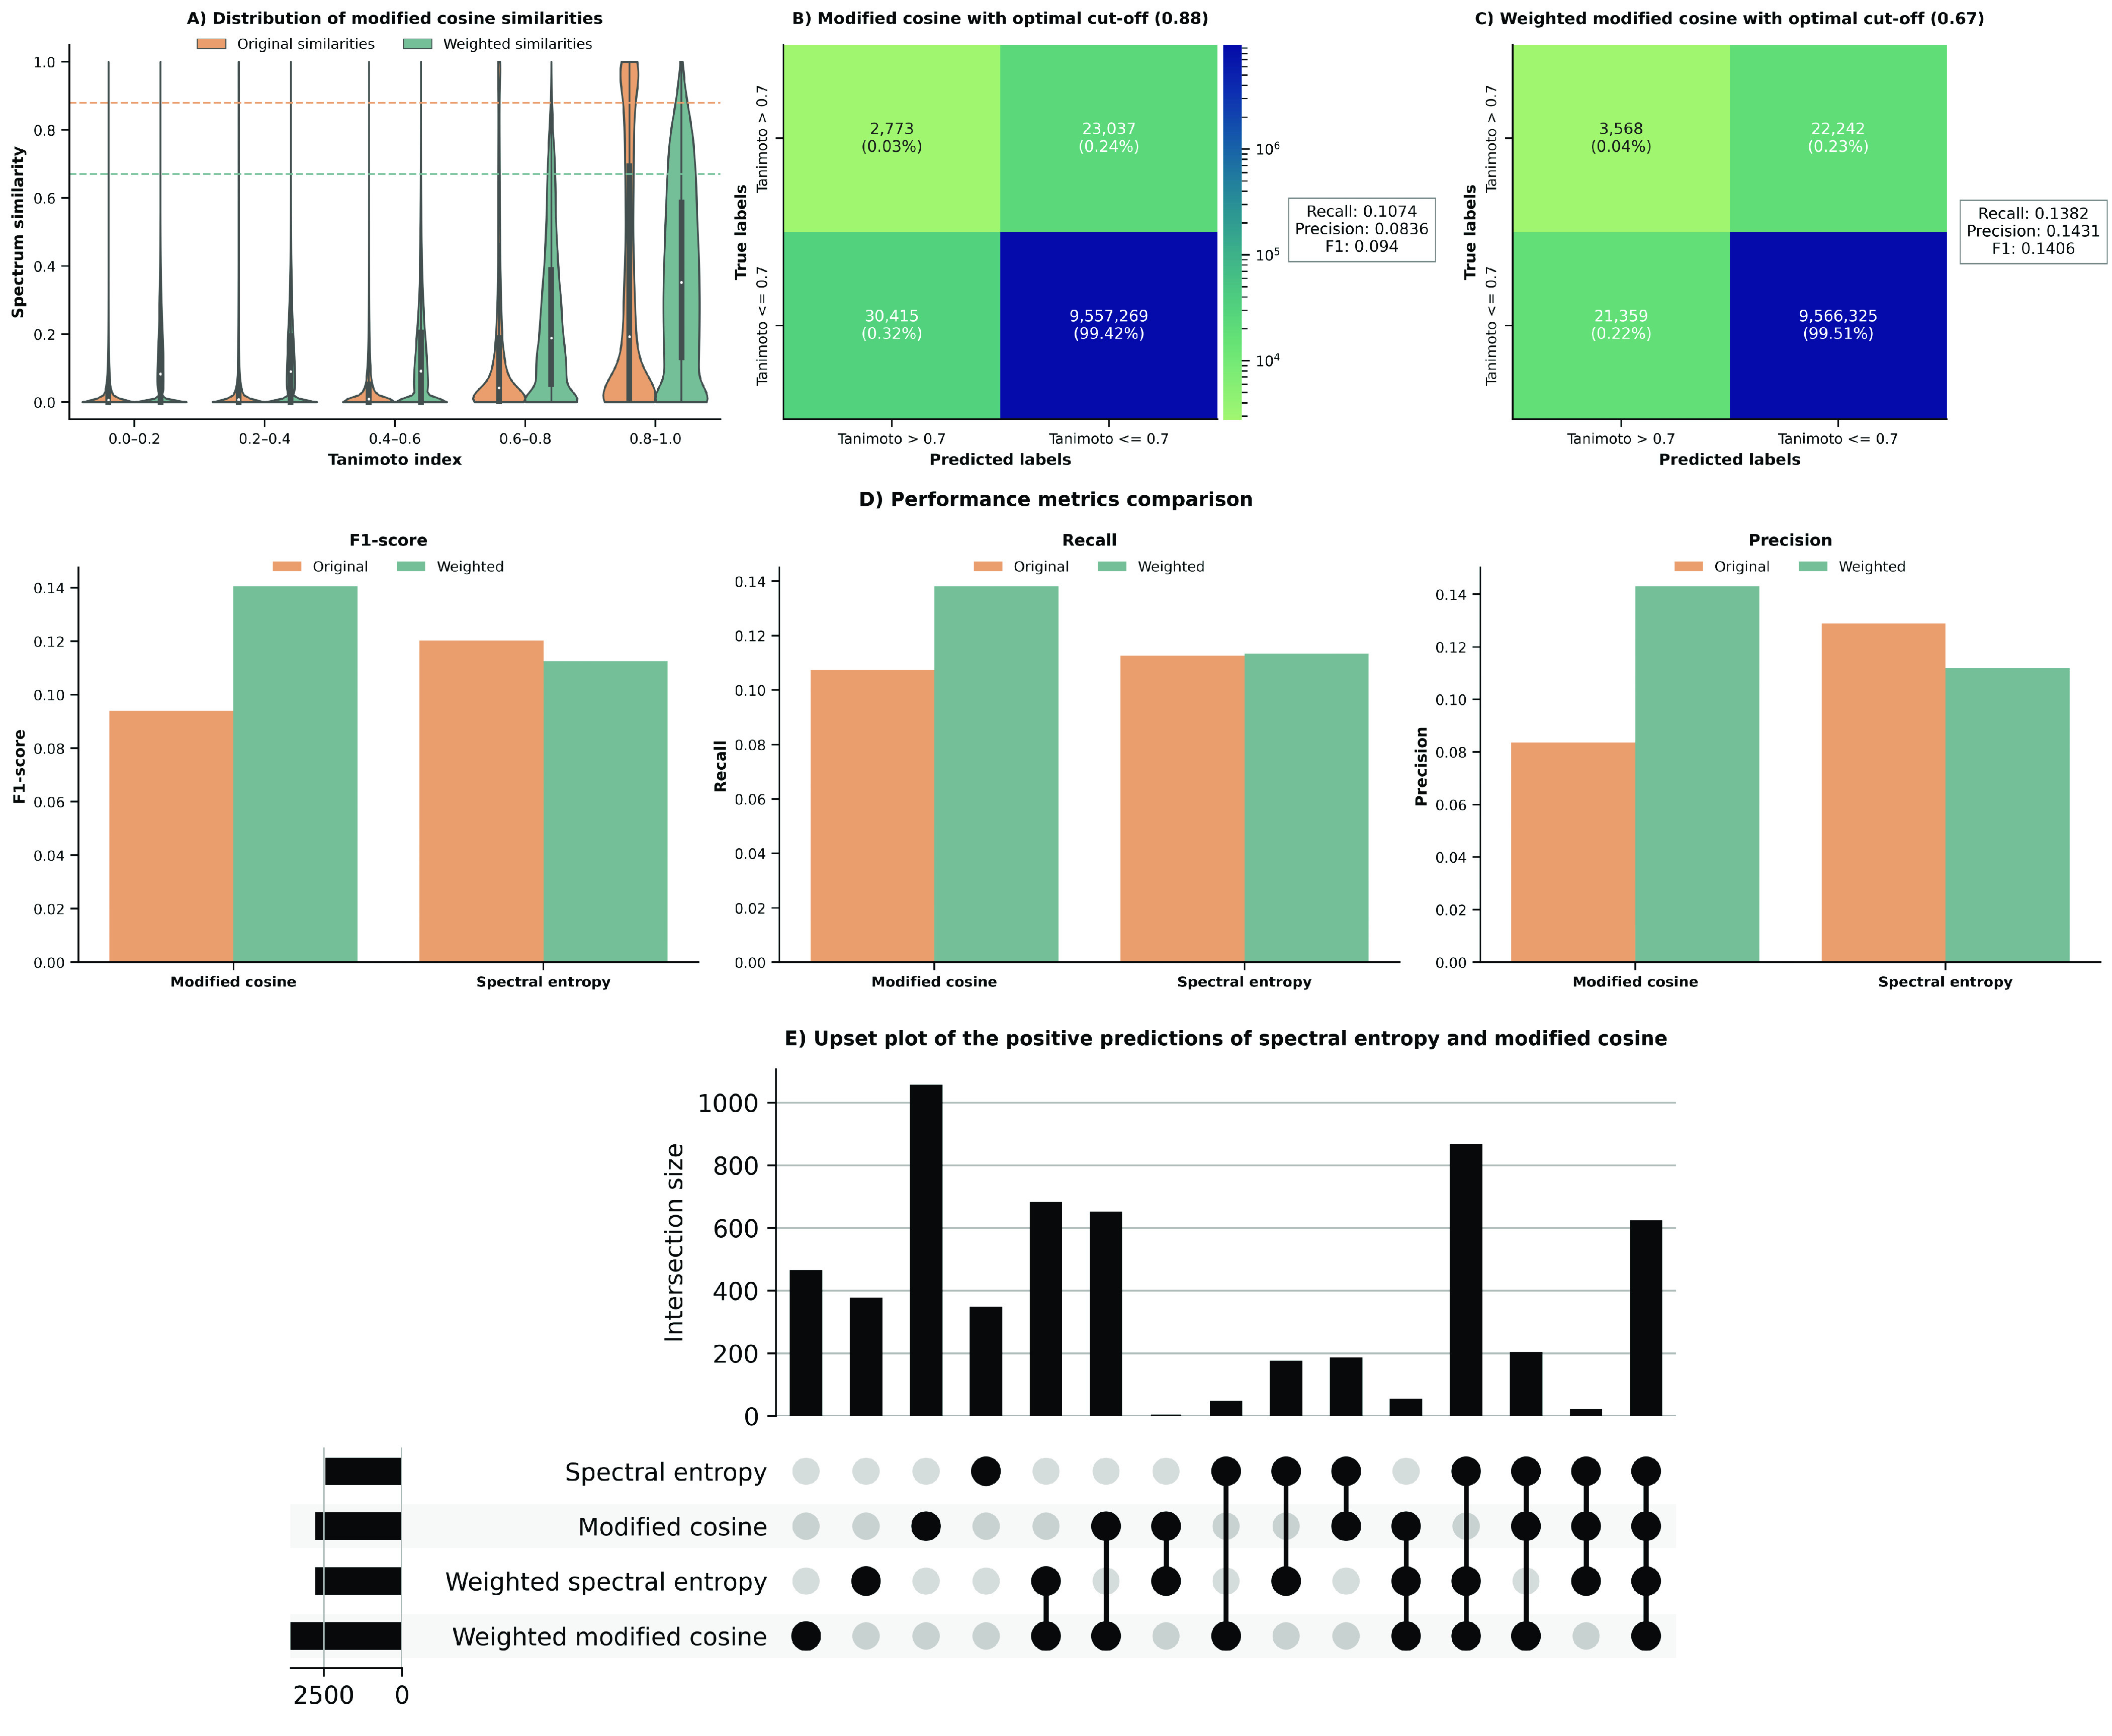
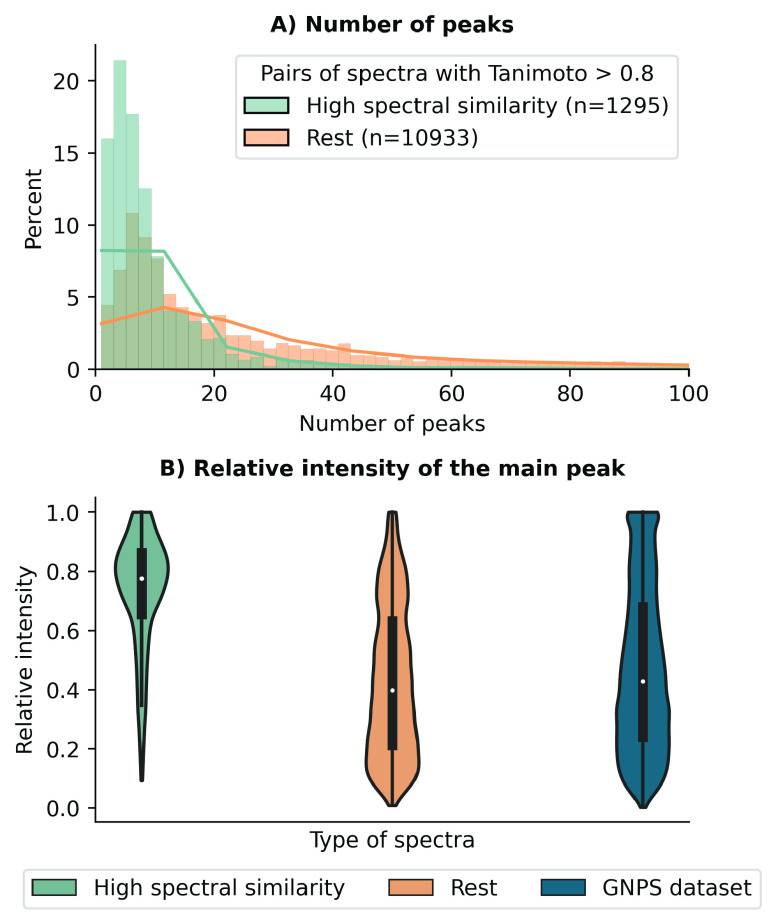
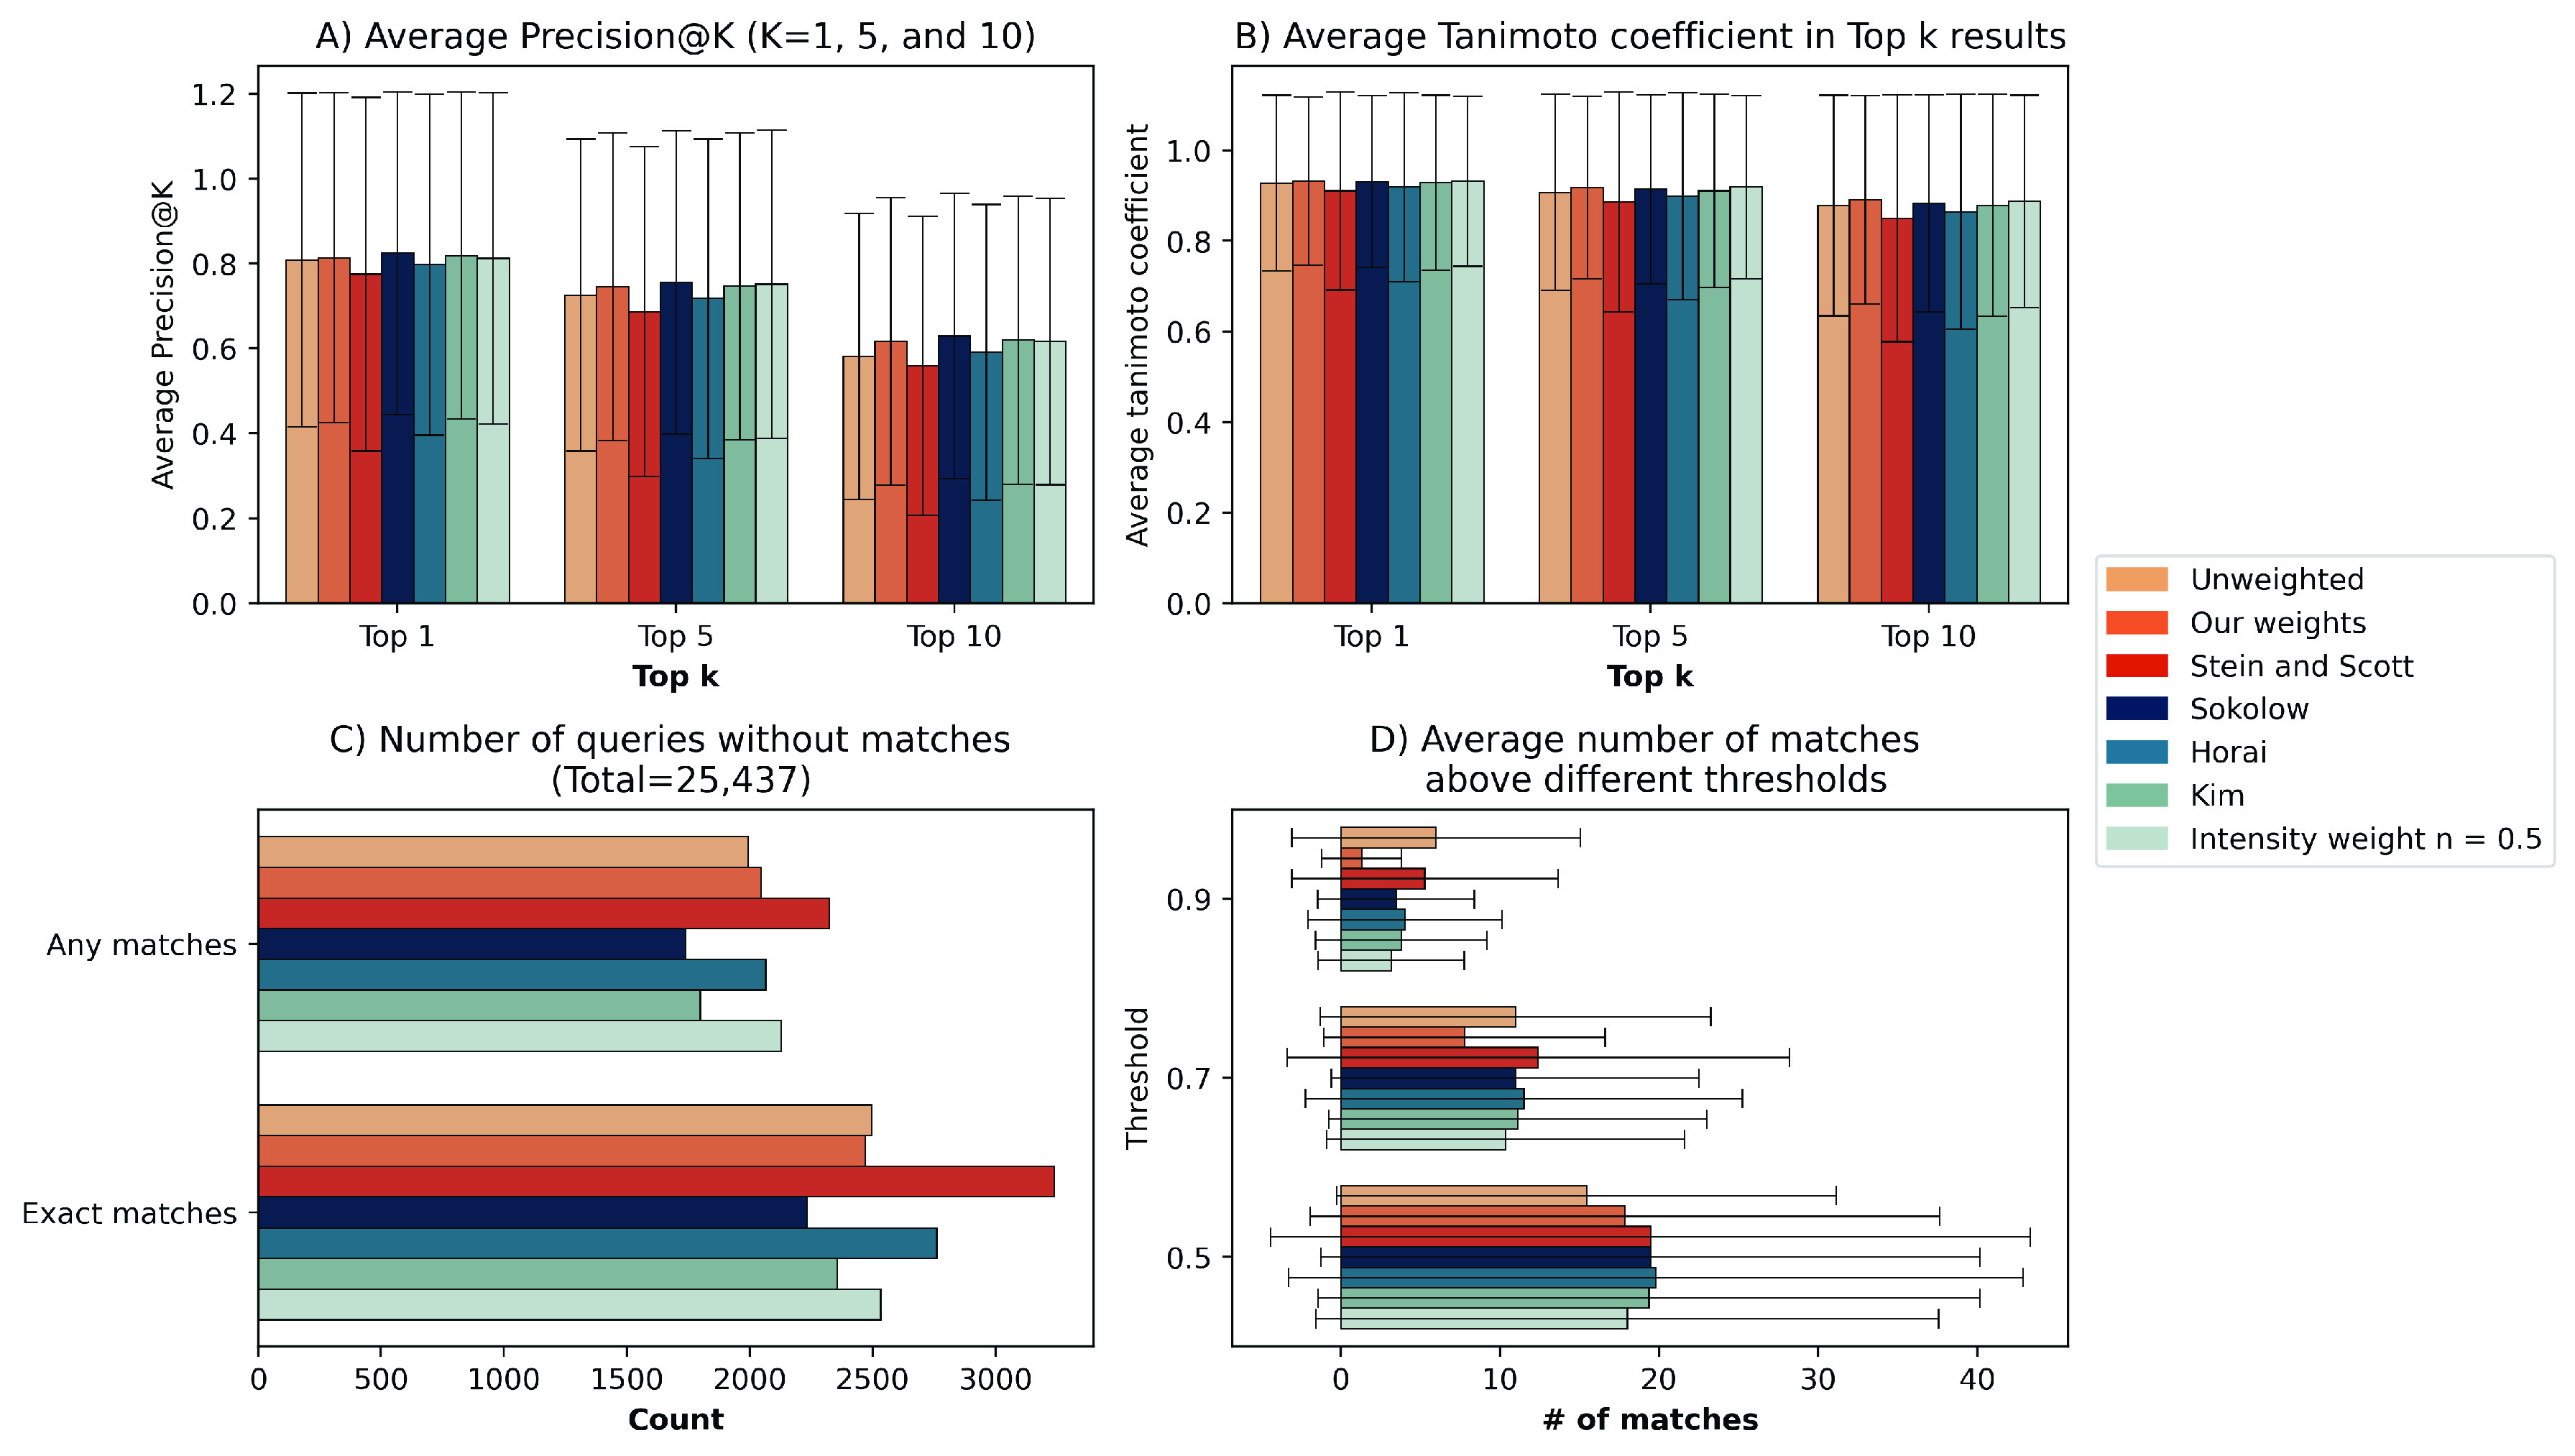
Calculating spectral similarity is a fundamental step in MS/MS data analysis in untargeted metabolomics experiments, as it facilitates the identification of related spectra and the annotation of compounds. To improve matching accuracy when querying an experimental mass spectrum against a spectral library, previous approaches have proposed increasing peak intensities for high m/z ranges. These high m/z values tend to be smaller in magnitude, yet they offer more crucial information for identifying the chemical structure. Here, we evaluate the impact of using these weights for identifying structurally related compounds and mass spectral library searches. Additionally, we propose a weighting approach that (i) takes into account the frequency of the m/z values within a spectral library in order to assign higher importance to the most common peaks and (ii) increases the intensity of lower peaks, similar to previous approaches. To demonstrate our approach, we applied weighting preprocessing to modified cosine, entropy, and fidelity distance metrics and benchmarked it against previously reported weights. Our results demonstrate how weighting-based preprocessing can assist in annotating the structure of unknown spectra as well as identifying structurally similar compounds. Finally, we examined scenarios in which the utilization of weights resulted in diminished performance, pinpointing spectral features where the application of weights might be detrimental.


Conflict of interest statement

The authors declare the following competing financial interest(s): P.C.D. is an advisor and holds equity in Cybele and a Scientific co-founder, holds equity in and is an advisor to Ometa, Enveda, and Arome with prior approval by UC-San Diego. All other authors were employees of Enveda Biosciences Inc. during the course of this work and have a real or potential ownership interest in Enveda Biosciences Inc.

Figures

Figure 1
Figure 1
Design of the mass spectral library search task. (A) The small molecule data set from GNPS was used as the query, following the same filtering steps previously utilized for the preceding spectral alignment task. The query data set was subsequently filtered to contain structures present in NIST, which are considered positive hits in the evaluation. (B) Mass spectral library search using a variety of similar metrics against NIST. (C) Spectral matching is conducted using different ppm windows. (D) Evaluation of the top K matches.
Figure 2
Figure 2
(A) Distribution of the spectral similarity for unweighted and weighted modified cosine similarity. The plot represents the similarity scores across 10 million pairs of spectra binned in relation to the structural similarities of the pair of molecules, measured using the Tanimoto coefficient. Higher Tanimoto coefficients (0.6–1) correspond to pairs of compounds with high structural similarity, and vice versa. The two horizontal lines represent the optimal cut-offs for predicting if a pair of spectra is structurally similar (label 1/Tanimoto coefficient > 0.7) or not (label 0/Tanimoto coefficient ≥ 0.7) based on the F1-score for each variant (i.e., 0.88 for unweighted and 0.67 for weighted). The rest of the similarity metrics are found in Supplementary Figure 3B,C) Contingency tables for modified cosine unweighted (B) and weighted (C) using the previously mentioned optimal cut-offs based on the F1-score. (D) Comparison of the performance metrics for modified cosine and spectral entropy. The optimal cut-offs for spectral entropy unweighted and weighted were 0.55 and 0.56, respectively. The performances for the remaining metrics are shown in Supplementary Table 4. (E) Upset plot showing the overlap of the true positives yielded by spectral entropy and modified cosine..
Figure 3
Figure 3
(A) Distribution of the number of peaks per spectrum within the pairs with a high Tanimoto coefficient (0.8–1) grouped by pairs with a cosine similarity higher than 0.95 (green) and the rest (orange). The plot shows that pairs of spectra corresponding to structurally similar compounds (Tanimoto coefficient 0.8–1) that exhibit a high spectral similarity (>0.95) generally have a lower number of peaks compared with the rest of structurally similar compounds (Tanimoto coefficient 0.8–1). (B) Distribution of the relative intensity of the main peak. The violin plots show the distribution of the relative intensities for three groups: (left) pairs of spectra with >0.95 spectral similarity using modified cosine similarity within the bin of Tanimoto coefficient 0.8–1, (center) rest of pairs of spectra with less than 0.95 spectral similarity using modified cosine similarity within the bin of Tanimoto coefficient 0.8–1, and (right) distribution of all the spectra in the GNPS data set.
Figure 4
Figure 4
Overview of the results on the mass spectral library search task. (A) Average precision@K values on the top 1, 5, and 10 matches using different proposed weights in the literature and our proposed weights. Library search is run using modified cosine similarity with a parts per million window of 10. Their performances are compared against unweighted scores (baseline). (B) Average Tanimoto coefficients of the structures within the top 1, 5, and 10 matched spectra. (C) Number of queries that did not return any match with a spectral similarity higher than 0.5 out of the total 25,437 queries. The bottom set of bars represents the number of queries without any exact matches. The upper set represents the number of queries without any matches. (D) Average number of matched spectra above different thresholds for spectral similarity (i.e., 0.5, 0.7, 0.9).

References

    1. Alseekh S.; Aharoni A.; Brotman Y.; Contrepois K.; D’Auria J.; Ewald J.; C Ewald J.; Fraser P. D.; Giavalisco P.; Hall R. D.; Heinemann M.; Link H.; Luo J.; Neumann S.; Nielsen J.; Perez de Souza L.; Saito K.; Sauer U.; Schroeder F. C.; Schuster S.; Siuzdak G.; Skirycz A.; Sumner L. W.; Snyder M. P.; Tang H.; Tohge T.; Wang Y.; Wen W.; Wu S.; Xu G.; Zamboni N.; Fernie A. R. Mass spectrometry-based metabolomics: a guide for annotation, quantification and best reporting practices. Nat. Methods 2021, 18 (7), 747–756. 10.1038/s41592-021-01197-1. - DOI - PMC - PubMed
    1. Reymond J. L. The chemical space project. Acc. Chem. Res. 2015, 48 (3), 722–730. 10.1021/ar500432k. - DOI - PubMed
    1. Huber F.; van der Burg S.; van der Hooft J. J. J.; Ridder L. MS2DeepScore: a novel deep learning similarity measure to compare tandem mass spectra. Journal of cheminformatics 2021, 13 (1), 84.10.1186/s13321-021-00558-4. - DOI - PMC - PubMed
    1. Li Y.; Kind T.; Folz J.; Vaniya A.; Mehta S. S.; Fiehn O. Spectral entropy outperforms MS/MS dot product similarity for small-molecule compound identification. Nat. Methods 2021, 18 (12), 1524–1531. 10.1038/s41592-021-01331-z. - DOI - PMC - PubMed
    1. Bittremieux W.; Schmid R.; Huber F.; van der Hooft J. J. J.; Wang M.; Dorrestein P. C. Comparison of cosine, modified cosine, and neutral loss based spectrum alignment for discovery of structurally related molecules. J. Am. Soc. Mass Spectrom. 2022, 33 (9), 1733–1744. 10.1021/jasms.2c00153. - DOI - PubMed

LinkOut - more resources