. 2024 Feb 20;5(2):101383.
doi: 10.1016/j.xcrm.2023.101383. Epub 2024 Jan 24.

Genetic variants affecting NQO1 protein levels impact the efficacy of idebenone treatment in Leber hereditary optic neuropathy

Affiliations

Genetic variants affecting NQO1 protein levels impact the efficacy of idebenone treatment in Leber hereditary optic neuropathy

Serena Jasmine Aleo et al. Cell Rep Med. .

Abstract

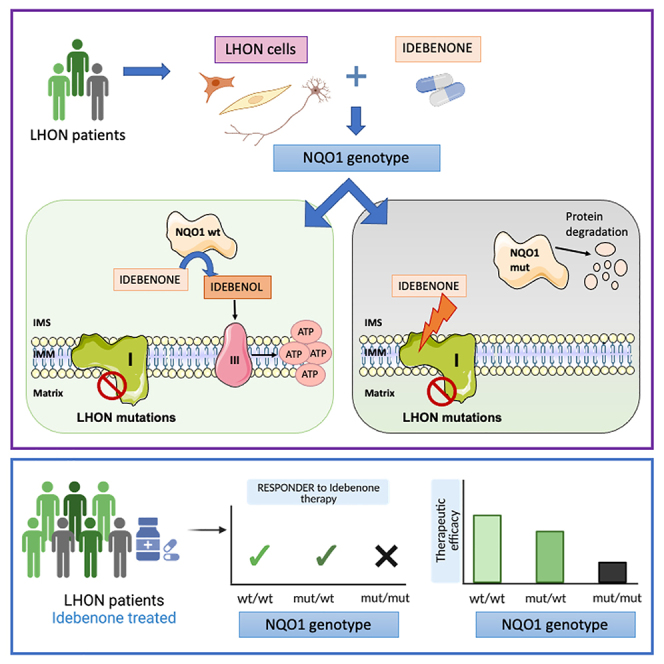
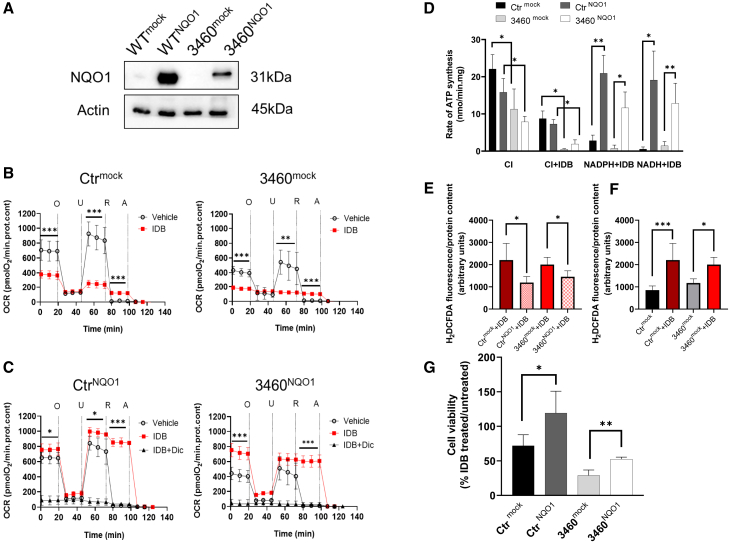
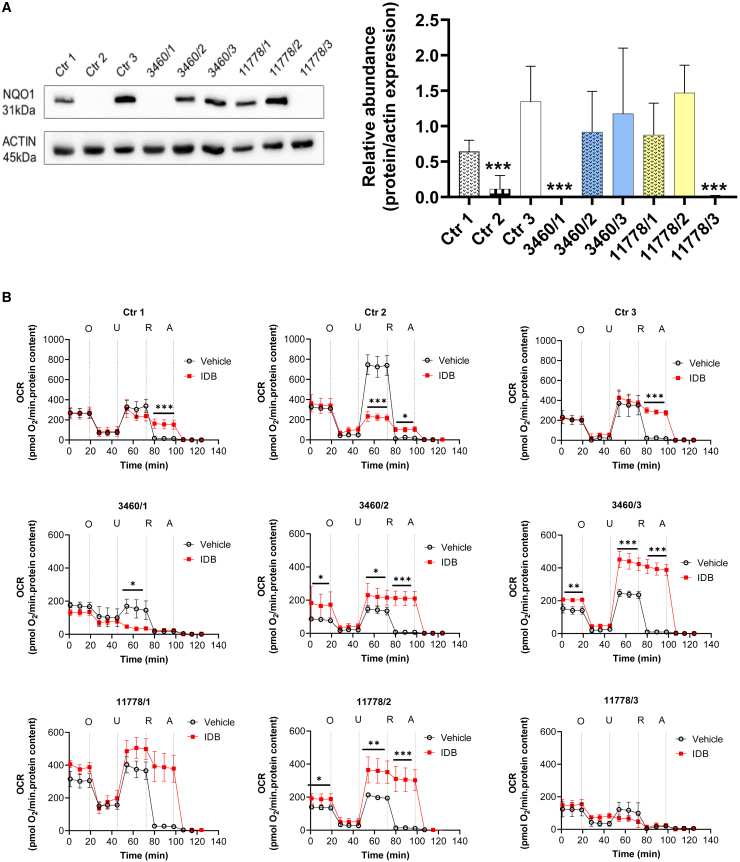
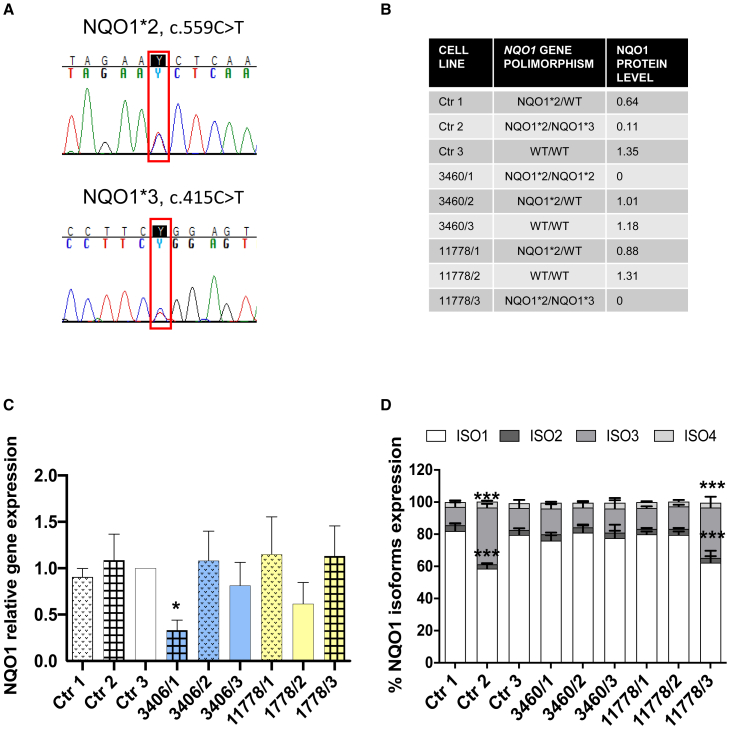
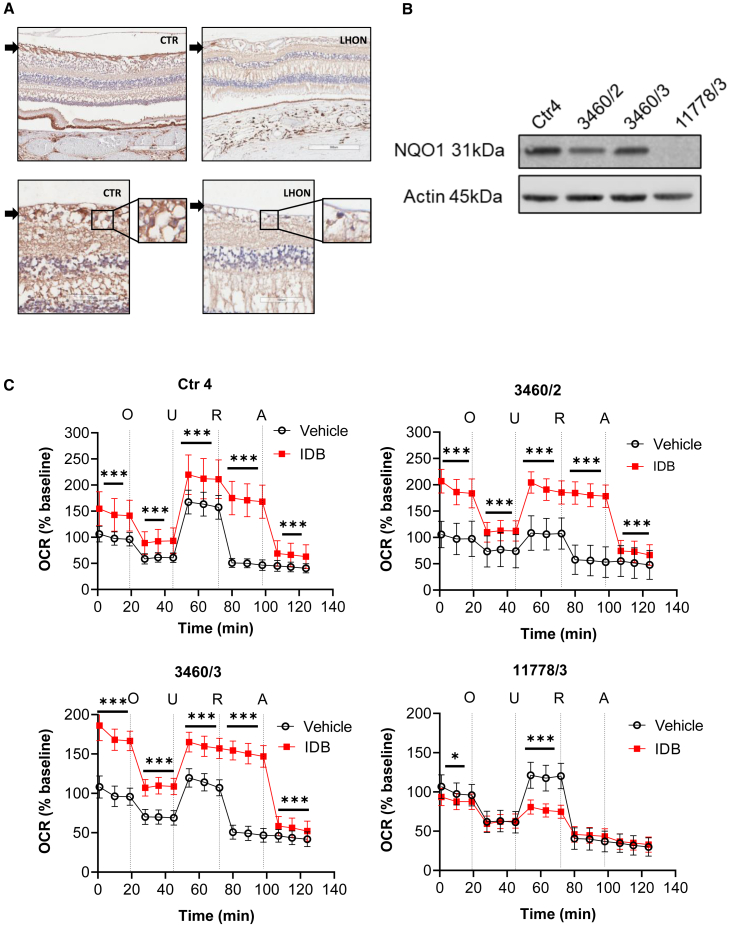
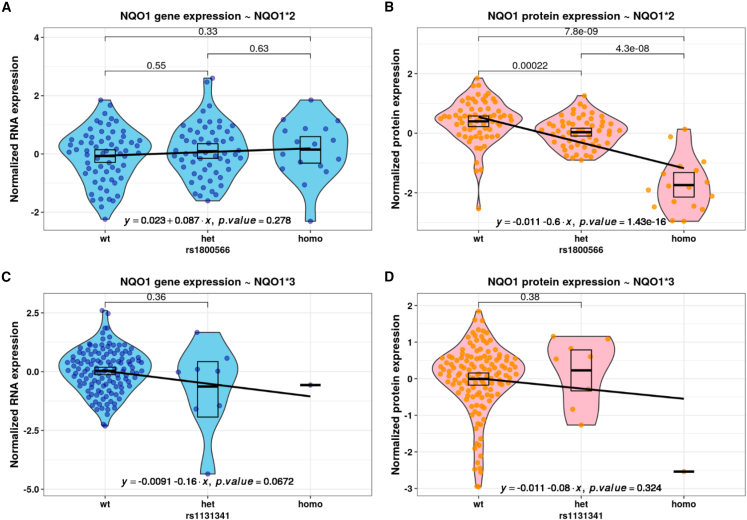
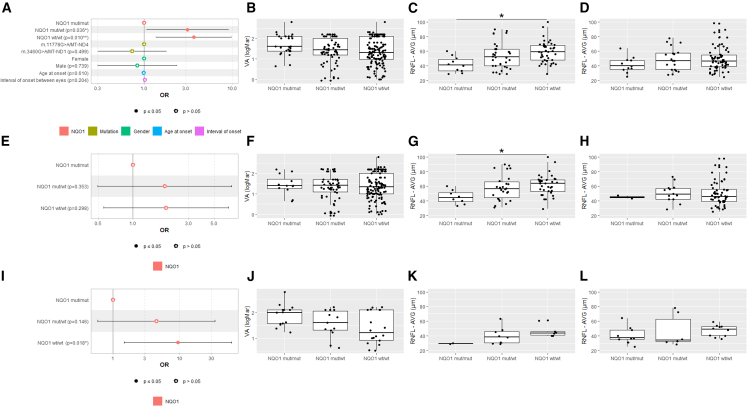
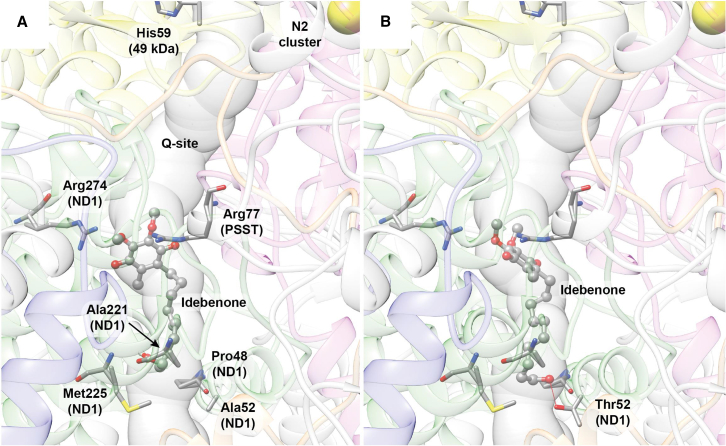
Idebenone, the only approved treatment for Leber hereditary optic neuropathy (LHON), promotes recovery of visual function in up to 50% of patients, but we can neither predict nor understand the non-responders. Idebenone is reduced by the cytosolic NAD(P)H oxidoreductase I (NQO1) and directly shuttles electrons to respiratory complex III, bypassing complex I affected in LHON. We show here that two polymorphic variants drastically reduce NQO1 protein levels when homozygous or compound heterozygous. This hampers idebenone reduction. In its oxidized form, idebenone inhibits complex I, decreasing respiratory function in cells. By retrospectively analyzing a large cohort of idebenone-treated LHON patients, classified by their response to therapy, we show that patients with homozygous or compound heterozygous NQO1 variants have the poorest therapy response, particularly if carrying the m.3460G>A/MT-ND1 LHON mutation. These results suggest consideration of patient NQO1 genotype and mitochondrial DNA mutation in the context of idebenone therapy.

Keywords: LHON; Leber hereditary optic neuropathy; NQO1; complex I; cybrids; fibroblasts; idebenone; mtDNA; retinal ganglion cells.


Conflict of interest statement

Declaration of interests M.R., P.B., M. Carbonelli, G.A., C.L.M., C.B.C., T.K., and V.C. are involved in clinical trials with idebenone (Santhera Pharmaceuticals and Chiesi Farmaceutici) in LHON patients. M.R., A.A.S., P.B., M. Carbonelli, G.A., C.L.M., C.B.C., T.K., and V.C. are involved in gene therapy trials with Lumevoq (GenSight Biologics) in LHON patients. A.A.S., C.L.M., T.K., and V.C. have received research support, speaker honoraria, consulting fees, and travel reimbursement from Santhera Pharmaceuticals, Chiesi GmbH, and GenSight Biologics. None of these activities are related to conduct of this study or writing of the manuscript.

Figures

None
Graphical abstract
Figure 1
Figure 1
IDB effectiveness in cybrids depends on NQO1 expression (A) Western blot analysis of NQO1 expression level in cellular lysates from control (Ctr) and m.3460G>A/MT-ND1 (3460) cybrids carrying an empty plasmid (mock) or human NQO1 (NQO1). Actin was used as a loading Ctr. A representative blot of two similar ones is shown. (B) OCR measurements of Ctr (Ctrmock) and m.3460G>A/MT-ND1 LHON cybrids (3460mock). OCR values were expressed as pmolO2 consumed/min normalized for cellular protein content under resting conditions and after oligomycin (O), FCCP (U), rotenone (R), and antimycin A (A) addition as detailed under STAR Methods. Empty circles correspond to cells treated with the vehicle DMSO (10 and seven independent experiments for Ctrmock and 3460mock, respectively) and red squares to cells treated with 10 μM idebenone (IDB; six and five independent experiments for Ctrmock and 3460mock, respectively). Data are reported as mean ± SD, and statistical analysis was performed using a t test as detailed under STAR Methods. ∗∗p < 0.01, ∗∗∗p < 0.001. (C) OCR measurements of Ctr (CtrNQO1) and m.3460G>A/MT-ND1 LHON cybrids (3460NQO1) overexpressing NQO1. Open circles correspond to cells treated with the vehicle DMSO (eight and five experiments for CtrNQO1 and 3460NQO1, respectively), red squares to cells treated with 10 μM IDB (six and five experiments for CtrNQO1 and 3460NQO1, respectively), and black triangles to cells treated with 10 μM IDB and 10 μM dicoumarol (IDB+DIC). Statistical analysis was performed for cells treated with vehicle and IDB as described in B). (D) Rate of ATP synthesis measured in digitonin-permeabilized cells driven by malate and pyruvate (CI substrates) or exogenous NAD(P)H. Where indicated, IDB was added at the final concentration of 10 μM as detailed under STAR Methods. Data are means ± SD of at least three to five independent experiments. Statistical analysis was performed using unpaired t test. ∗p < 0.05, ∗∗p < 0.01. (E) Rate of H2O2 production in mock or NOQ1-overexpressing cells grown in the presence of 10 μM IDB as described under STAR Methods. Data are reported as mean ± SEM of four to six independent experiments. Statistical analysis was performed using a paired t test. ∗p < 0.05, ∗∗p < 0.01, ∗∗∗p < 0.001. (F) Rate of H2O2 production in mock cell lines in the presence or absence of 10 μM IDB. The measurement and data analysis were performed as described in (E). (G) Cell viability measurements were performed in the presence or absence of 10 μM IDB as detailed under STAR Methods. Values are expressed as percentage of the ratio between IDB treated and non-treated cells. Data are reported as mean ± SD of four independent experiments. Statistical analysis was performed using unpaired t test. ∗p < 0.05, ∗∗p < 0.01.
Figure 2
Figure 2
IDB effectiveness correlates with NQO1 protein levels in Ctr and LHON fibroblasts (A) Western blot analysis and quantification of NQO1 expression in cellular lysates from Ctr (WT1, WT2, and WT3) and LHON (3460/1, 3460/2, 3460/3, 11778/1, 11778/2, and 11778/3) fibroblasts. Actin was used as a loading Ctr. A representative blot of three similar ones is shown. Data are reported as means ± SD of protein abundance of at least three to five independent experiments. Statistical analysis was performed using one-way ANOVA with a Dunnett’s post hoc test comparing the mean of each column with the mean of WT3 as a Ctr column. ∗∗∗p < 0.001. (B) OCR measurements in Ctr and LHON fibroblasts in the presence or absence of IDB (as in Figure 1B). Open circles correspond to OCR values measured in cells treated with the vehicle DMSO and red squares to OCR values measured in cells treated with 10 μM IDB. Data are reported as mean ± SD of at least three to five independent experiments (Ctr1: n = 5 vehicle, n = 4 IDB; Ctr2: n = 5 vehicle, n = 4 IDB; Ctr3: n = 3 vehicle, n = 3 IDB; 3460/1: n = 3 vehicle, n = 3 IDB; 3460/2, n = 3 vehicle, n = 3 IDB; 3460/3: n = 4 vehicle, n = 3 IDB; 11778/1: n = 3 vehicle, n = 2 IDB; 1177/2: n = 3 vehicle, n = 3 IDB; 11778/3: n = 5 vehicle, n = 4 IDB. Statistical analysis is the same as reported in Figure 1B and STAR Methods. ∗p < 0.05, ∗∗p < 0.01, ∗∗∗p < 0.001.
Figure 3
Figure 3
Common polymorphic variants in NQO1 influence its levels in Ctr and LHON fibroblasts (A) Representative electropherograms showing the presence of both WT and variants in fibroblast DNA: the NQO1∗2 allele (top) and the NQO1∗3 allele (bottom). (B) Table summarizing the NQO1 polymorphism identified and NQO1 protein levels for each of the nine fibroblast cell lines analyzed, normalized on WT3. (C) NQO1 gene expression evaluated by qPCR. GAPDH was used as a reference gene. Fold changes are normalized to WT3 and are expressed as means ± SD of three independent experiments. ∗p < 0.05 using Dunnett’s post hoc test. (D) Gene expression of the four isoforms of NQO1 evaluated by qPCR. GAPDH was used as a reference gene. Data are expressed as means ± SD of three independent experiments. ∗∗∗p < 0.001 using Dunnett’s post hoc test.
Figure 4
Figure 4
NQO1 expression in blood, RGCs, and iPSC-derived NPCs, driving IDB efficacy on respiration of NPCs (A) Immunoperoxidase stain with anti-NQO1 (A180) on horizontal retinal sections from a normal individual (Ctr: male, 74 years old) and an LHON patient carrying the m.11778G>A/MT-ND4 mutation (LHON: male, 52 years old). In the normal individual, a positive stain is observed in the unmyelinated portion of the axons in the retinal nerve fiber layer (arrow) and in the somata of RGCs. In the patient, a faint positivity is present both in the atrophic retinal nerve fiber layer and in residual RGCs (insets: higher magnification). (B) Western blot analysis of NQO1 levels in cellular lysates from a Ctr (Ctr4), 3460/2, 3460/3, and 11778/3 LHON NPCs. Actin was used as a loading Ctr. Due to the very low number of NPCs, the western blot was performed only once. (C) OCR measurements in Ctr (Ctr4) and LHON (3460/2, 3460/3, and 11778/3) NPCs in the presence or absence of IDB. OCR data were normalized on cell counts and expressed as a percentage of the baseline measurement of untreated lines. Open circles correspond to OCR values measured in cells treated with the vehicle DMSO and red squares to OCR values measured in cells treated with 10 μM IDB. Data are reported as mean ± SD of two independent experiments (12 technical replicates per line for each experiment). Statistical analysis is the same as reported in Figure 1B and STAR Methods. ∗p < 0.05, ∗∗∗p < 0.001.
Figure 5
Figure 5
Homozygous NQO1 polymorphisms result in reduced NQO1 protein levels (A and B) Violin plots of normalized RNA expression (A) and protein expression (B), stratified by genotypes of NQO1∗2. (C and D) Violin plots of normalized RNA expression (C) and protein expression (D), stratified by genotypes of NQO1∗3. Each dot represents an individual observation. The black box indicates mean and 95% confidence intervals. Blue color corresponds to RNA-seq analysis and red-spectrum colors to proteomics. The black line was fitted using linear regression, with the equation and significance specified in the bottom.
Figure 6
Figure 6
NQO1 variants leading to very low protein levels match the IDB responder/non-responder analysis (A, E, and I) Forest plots of odds ratios (ORs) for the binary visual outcome (responder/non-responder to IDB therapy). (A) ORs calculated by multivariable GEE modeling on the 118 LHON patients treated with IDB therapy. (E) ORs calculated by univariable GEE modeling on the LHON patients treated with IDB therapy carrying the m.11778G>A/MT-ND4 mutation. (I) ORs calculated by univariable GEE modeling on the LHON patients treated with IDB therapy carrying the m.3460G>A/MT-ND1 mutation. (B, F, and J) Boxplots of VA at last visit, with solid lines representing median values for NQO1 mut/mut, NQO1 mut/WT, and NQO1 WT/WT genotypes of all 118 LHON patients (B), LHON patients carrying the m.11778G>A/MT-ND4 (F), and LHON patients carrying m.3460G>A/MT-ND1 (J). (C, G, and K) All Italian LHON patients (C), Italian LHON patients with m.11778G>A/MT-ND4 (G), and Italian LHON patients with m.3460G>A/MT-ND1 (K). Shown are boxplots of average RNFL thickness at last visit, with solid lines representing median values for NQO1 mut/mut, NQO1 mut/WT, and NQO1 WT/WT genotypes. All of these patients were evaluated with swept-source OCT (DRI Triton OCT, Topcon, Tokyo, Japan). ∗p < 0.05. (D, H, and L) All German LHON patients (D), German LHON patients with m.11778G>A/MT-ND4 (H), and German LHON patients with m.3460G>A/MT-ND1 (L). Shown are boxplots of average RNFL thickness at last visit, with solid lines representing median values for NQO1 mut/mut, NQO1 mut/WT, and NQO1 WT/WT genotypes. All of these patients were evaluated with spectral-domain OCT (Heidelberg Spectralis OCT, Heidelberg Engineering, Heidelberg, Germany).
Figure 7
Figure 7
Molecular docking of IDB in the Q-binding site of CI carrying the m.3460G>A/MT-ND1 mutation Details of the best docking poses for IDB in the WT (A) and mutated (B) CI. The Q-site channel is reported in transparent light blue to show the position of the ligand in the cavity with the entrance of the channel at the bottom. IDB is shown in ball-and-stick representation, colored according to the atom type, while CI residues forming specific interaction with the ligands are shown as sticks colored accordingly to atom type. Residues are labeled in (A) only, except for A52T. H bonds are shown using red lines. Protein backbones are reported in transparent cartoons colored in gray, except for the 49 kDa/NDUFS2, PSST/NDUFS7, ND1, ND3 and ND6 subunits, which are shown in yellow, purple, green, orange, and blue, respectively. The N2 [4Fe4S] cluster is shown as spheres colored according to the atom type.

References

    1. Zs -Nagy I. Chemistry, toxicology, pharmacology and pharmacokinetics of idebenone: a review. Arch. Gerontol. Geriatr. 1990;11:177–186. - PubMed
    1. Gillis J.C., Benefield P., McTavish D. Idebenone: A Review of its Pharmacodynamic and Pharmacokinetic Properties, and Therapeutic Use in Age-Related Cognitive Disorders. Drugs Aging. 1994;5:133–152. - PubMed
    1. Haefeli R.H., Erb M., Gemperli A.C., Robay D., Courdier Fruh I., Anklin C., Dallmann R., Gueven N. NQO1-dependent redox cycling of idebenone: effects on cellular redox potential and energy levels. PLoS One. 2011;6 - PMC - PubMed
    1. Erb M., Hoffmann-Enger B., Deppe H., Soeberdt M., Haefeli R.H., Rummey C., Feurer A., Gueven N. Features of Idebenone and Related Short-Chain Quinones that Rescue ATP Levels under Conditions of Impaired Mitochondrial Complex I. PLoS One. 2012;7 - PMC - PubMed
    1. Varricchio C., Beirne K., Heard C., Newland B., Rozanowska M., Brancale A., Votruba M. The ying and yang of idebenone: Not too little, not too much – cell death in NQO1 deficient cells and the mouse retina. Free Radic. Biol. Med. 2020;152:551–560. - PubMed

Publication types

MeSH terms