. 2024 May;166(5):772-786.e14.
doi: 10.1053/j.gastro.2024.01.027. Epub 2024 Jan 24.

Oncogenic Fatty Acid Metabolism Rewires Energy Supply Chain in Gastric Carcinogenesis

Affiliations

Oncogenic Fatty Acid Metabolism Rewires Energy Supply Chain in Gastric Carcinogenesis

Yoonkyung Won et al. Gastroenterology. 2024 May.

Abstract

Background & aims: Gastric carcinogenesis develops within a sequential carcinogenic cascade from precancerous metaplasia to dysplasia and adenocarcinoma, and oncogenic gene activation can drive the process. Metabolic reprogramming is considered a key mechanism for cancer cell growth and proliferation. However, how metabolic changes contribute to the progression of metaplasia to dysplasia remains unclear. We have examined metabolic dynamics during gastric carcinogenesis using a novel mouse model that induces Kras activation in zymogen-secreting chief cells.

Methods: We generated a Gif-rtTA;TetO-Cre;KrasG12D (GCK) mouse model that continuously induces active Kras expression in chief cells after doxycycline treatment. Histologic examination and imaging mass spectrometry were performed in the GCK mouse stomachs at 2 to 14 weeks after doxycycline treatment. Mouse and human gastric organoids were used for metabolic enzyme inhibitor treatment. The GCK mice were treated with a stearoyl- coenzyme A desaturase (SCD) inhibitor to inhibit the fatty acid desaturation. Tissue microarrays were used to assess the SCD expression in human gastrointestinal cancers.

Results: The GCK mice developed metaplasia and high-grade dysplasia within 4 months. Metabolic reprogramming from glycolysis to fatty acid metabolism occurred during metaplasia progression to dysplasia. Altered fatty acid desaturation through SCD produces a novel eicosenoic acid, which fuels dysplastic cell hyperproliferation and survival. The SCD inhibitor killed both mouse and human dysplastic organoids and selectively targeted dysplastic cells in vivo. SCD was up-regulated during carcinogenesis in human gastrointestinal cancers.

Conclusions: Active Kras expression only in gastric chief cells drives the full spectrum of gastric carcinogenesis. Also, oncogenic metabolic rewiring is an essential adaptation for high-energy demand in dysplastic cells.

Keywords: Carcinogenesis; Fatty Acid Metabolism; Imaging Mass Spectrometry; Kras; Stearoyl-CoA Desaturase.


Conflict of interest statement

Conflicts of interest

The authors disclose no conflicts.

Figures

Figure 1.
Figure 1.
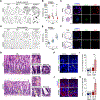
Key stages of gastric carcinogenesis induced by Kras activation in gastric chief cells. (A) H&E-stained images from the GCK mouse stomachs at multiple times after doxycycline treatment: pyloric metaplasia (PM; 2–3 weeks), In-IM (5–6 weeks), and LGD/HGD (10–14 weeks). (B) Cytologic features of dysplasia, observed in HGD, are indicated by arrowheads. (C) Proportion of gland types in GCK stomachs. We examined 100 glands in the proximal region of the corpus at 2 to 3 weeks (n = 5), 5 to 6 weeks (n = 8), and 10 to 14 weeks (n = 10). (D) Measurement of glands width in GCK stomachs. A total of 100 glands were examined in each group, 3 mice per group. Each dot indicates the width of glands. Unt, untreated. (E) Immunofluorescent (IF) staining for CD44v9 (red) and aquaporin 5 (AQP5, green) for SPEM cell lineage. (F) Quantitation of positive cells for CD44v9 or AQP5, or both. A total of 100 glands were examined in each group, 3 mice per group. (G) IF staining for TFF3 (red) for IM cells. (H) Quantitation of TFF3-expressing glands. (I) IF staining for TROP2 (green). (J) Quantitation of TROP2-expressing glands. (K) IF staining for CEACAM5 (red; arrowheads) and Ki-67 (green). (L) Quantitation of CEACAM5-expressing glands. Each dot in H, J, and L indicates the percentage of positive glands per 20× field of images. (M) IF staining for phospho-histone H3 (pHH3; red) and Ki-67 (green). Arrowheads indicate copositive cells for pHH3 and Ki-67. (N) Quantitation of Ki-67–positive cells per gland. Each dot indicates the Ki-67–positive cells per gland. (O) IF staining for claudin 3 (CLDN3) (green). (P) Quantitation of loss of CLDN3 expression (arrowheads). Each dot indicates the percentage of CLDN3-negative glands per 20× field image. All IF data are representative of n = 3 mice per group, and 100 glands per group were examined for quantitation. Hoechst was used for nuclear staining. The white dotted boxes denote enlarged regions. Scale bars: 25 μm (B) and 100 μm (A, E, G, I, K, M, and O). D, H, J, L, N, and P show the mean ± standard deviation. C and F show the mean ± standard error of the mean. Two-tailed unpaired t test (H, J, and P), 2-tailed Mann-Whitney test (L and N), or Kruskal-Wallis test with 2-sided Dunn’s multiple comparison test (D). **P < 0.01, ***P < 0.001, ****P < 0.0001.
Figure 2.
Figure 2.
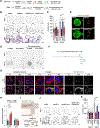
Spatial and quantitative metabolic profiling reveals distinct patterns of metabolites during carcinogenesis. (A) Schematic for methodology of MALDI-IMS using GCK stomachs. The mass spectrum images were obtained per each ion by plotting m/z intensity collected from each spot. (B) Heat map displays relative values of average pixel intensity of the individual metabolite at untreated (Unt), pyloric metaplasia (PM), In-IM, and HGD stages. The color box indicates a relative pixel intensity value of total ion counts compared with untreated stomach. ARA, arachidonic acid; DHA, docosahexaenoic acid; PA, phosphatidic acid; PI, phosphatidylinositol. (C) An overlay of hexose bisphosphate intensities. (D) Ion images of hexose phosphate and hexose bisphosphates in the GCK stomachs (left; H&E staining corresponding to the tissue section used for the IMS). An overlay of (E) palmitate or (F) MUFA (FFA 20:1) intensities. (G) Schematic for FA desaturation and elongation. (H) Ion images of long-chain FAs in the GCK stomachs. The abundance of individual metabolites is normalized to 100%. Scale bar: 500 μm.
Figure 3.
Figure 3.
Specific expression of SCD1 in GCK stomachs. (A) Schematic for key steps in central metabolic pathways with associated enzymes. ACLY, adenosine 5’-triphosphate citrate lyase; FADS, FA desaturase; FASN, fatty acid synthase; GLS1, glutaminase; LDH, lactate dehydrogenase; MPC, mitochondrial pyruvate carrier; PDH, pyruvate dehydrogenase; TCA, tricarboxylic acid cycle. (B) Heat map displays relative messenger RNA levels of genes encoding metabolic enzymes or transporters in gastric organoid lines derived from GCK stomachs from 5 independent experiments. The color box indicates a relative expression level of genes normalized to the Rplp0 at the pyloric metaplasia stage. All individual values are shown in Supplementary Figure 3D. (C and D) Immunofluorescent (IF) staining for SCD1 (green) and Ki-67 (red) or CD44v9 (red) in GCK stomachs. White dotted boxes denote enlarged regions. White dotted lines identify gland shapes. All IF data are representative images of n = 3 mice per group, and Hoechst was used for nuclear staining. (E) IF staining for SCD1 (green) in normal or dysplastic organoids. (F) Phase-contrast images of dysplastic organoids treated with dimethyl sulfoxide (DMSO; vehicle), GSK2837808A (LDH inhibitor; 10 μmol/L), 6-aminonicotinamide (6-AN, glucose-6-phosphate dehydrogenase [G6PD] inhibitor; 50 μmol/L), telaglenastat (GLS1 inhibitor; 1 μmol/L) for 3 days. (G) Quantitation of organoid diameters in dysplastic organoids treated with inhibitors of glycolysis metabolic enzymes for 3 days. (H) Phase-contrast images of dysplastic organoids treated with dimethyl sulfoxide (DMSO) (vehicle), BMS-303141 (ACLY inhibitor; 1 μmol/L), C75 (FASN inhibitor; 1 μmol/L), A939572 (SCD inhibitor; 100 μmol/L), or SC-26196 (FA desaturase [FADS2] inhibitor; 1 μmmol/L) for 3 days. (I) Quantitation of organoid diameters in dysplastic organoids treated with inhibitors of lipid metabolic enzymes for 3 days (n = 50). (G and I) organoids from 3 independent experiments. (J) IF staining for Ki-67 (red) and SCD1 (green) in dysplastic organoids treated with DMSO or A939572 for 1 day. Scale bars: 100 μm (C, D, E, and J) and 1000 μm (F and H). All panels show mean ± standard deviation. Two-tailed Mann-Whitney test. *P < 0.05, **P < 0.01, ****P < 0.0001.
Figure 4.
Figure 4.
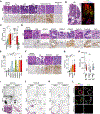
SCD1 regulates dysplastic cell proliferation and survival both in vivo and in vitro. (A and D) Phase-contrast images of organoids treated with dimethyl sulfoxide (DMSO; vehicle) or A939572 (100 nmol/L) at 0, 1, or 3 days after treatment. (B and E) Quantitation of organoid diameters (n = 50 organoids from 3 independent experiments). (C and F) H&E staining or immunofluorescent (IF) staining for cleaved caspase-3 (CC-3, green) or cell proliferation (Ki-67, red) in organoids treated with either DMSO or A939572 (n ≥ 3 biological replicates). (G) H&E staining in GCK mouse stomachs treated with vehicle (n = 3) or A939572 (n = 4). Arrowheads indicate dead cells. (H) IF staining for CC-3 (green) in GCK mouse stomachs treated with DMSO (vehicle) or A939572. Arrowheads indicate CC-3–positive cells. (I) Quantitation of CC-3–positive cells per 20× field of images. (J) IF staining for terminal deoxynucleotidyl transferase–mediated deoxyuridine triphosphate nick-end labeling (TUNEL, green) in the vehicle- or A939572-treated GCK stomachs. Arrowheads indicate TUNEL-positive cells. (K) Quantitation of TUNEL-positive cells per 20× field of images. Each dot in I and K indicates the CC-3–positive or TUNEL-positive cells in each 20× field image. Scale bars: 50 μm (G, enlarged), 100 μm (C, F, H, and J, 200 μm (G, left), and 1000 μm (A and D). Hoechst was used for nuclear staining. Dotted boxes denote enlarged regions. All panels show mean ± standard deviation. Two-tailed unpaired t test (E and K) or 2-tailed Mann-Whitney test (B and I). ****P < 0.0001.
Figure 5.
Figure 5.
EA is used a key energy substrate of FA oxidation. (A) Schematic for FA elongation and desaturation for EA (20:1, n-9) or DA (22:4, n-6). (B) Phase-contrast, H&E-stained images and (C) quantitation of organoid diameters of dysplastic organoids cotreated with A939572, in combination with EA or DA for 3 days (n = 50 organoids from 3 independent experiments). DMSO, dimethyl sulfoxide. (D) Live/dead (calcein acetoxymethyl/ethidium homodimer-1 [EthD-1]) cell staining of dysplastic organoids cotreated with A939572, in combination with EA or DA for 3 days. (E) Phase-contrast images of dysplastic organoids treated with Scd1-small interfering (si)RNA or control-siRNA (C-siRNA) alone or in combination with EA at day 0 or 6 days after the treatment. (F) Chemical structure of synthesized NBD-conjugated EA (20:1, n-9). (G) Confocal images of dysplastic cell monolayers cultured with NBD or NBD-EA at 6, 24, and 48 hours after incubation. Cells were then stained with 100 nmol/L of MitoTracker Red CMXRos (Mito). Hoechst was used for nuclear staining (Nuc). (H) Relative messenger RNA (mRNA) expression levels of Cpt1a and Cpt2 genes in gastric organoid lines (n = 3 independent experiments). (I) Schematic for target molecules of perhexiline in the FA oxidation. (J) Phase-contrast images and (K) quantitation of diameters of dysplastic organoids after the cotreatment (n = 20–35 organoids from 3 independent experiments). Dotted boxes denote enlarged regions. Scale bars: 20 μm (G), 100 μm (C; H&E images, E and F), and 1000 μm (C; phase-contrast images and J). All panels show mean ± standard deviation. Two-tailed Mann-Whitney test. **P < 0.01, ****P < 0.0001.
Figure 6.
Figure 6.
SCD up-regulation in human gastrointestinal carcinogenesis. (A) Immunohistochemistry (IHC) staining for human SCD in adjacent normal (n = 4), IM (n = 11), LGD (n = 7), HGD (n = 5), and intestinal- or diffuse-type gastric cancer (GC) tissues (n = 89). (B) Representative images of H&E and coimmunostaining for SCD (green), TROP2 (red), and CD44v9 (blue) in human stomach tissues. (C) The IHC H-score of SCD in human stomach tissues. (D) IHC staining for SCD in adjacent normal (n = 16), acinar-toductal metaplasia (ADM, n = 14), mucinous cystic neoplasia (MCN, n = 5), intraductal papillary mucinous neoplasia (IPMN, n = 14), pancreatic intraepithelial neoplasia (PanIN, n = 18), and pancreatic ductal adenocarcinoma (PDAC, n = 10). (E) The IHC H-score of SCD in human pancreatic00 tissues. (F) IHC staining for SCD in adjacent normal (n = 9), Barrett’s esophagus (BE, n = 13), dysplasia (n = 6), and esophageal adenocarcinoma (ADC, n = 11). (G) The IHC H-score of SCD in human esophageal tissues. (H) Quantitation of diameters of human precancerous organoids (hPCOs) at 6 days after treatment with dimethyl sulfoxide (DMSO) or A939572 (n = 57–84 organoids from 3 independent experiments). (I–K) Phase-contrast and H&E-stained images of hPCOs treated with DMSO or A939572 (1 μmol/L). (I) High, (J) moderate, or (K) low response to A939572 treatment. (L) Immunofluorescent staining for SCD (green) and TROP2 (red), and Ki-67 (blue) in hPCOs (n ≥ 3 independent experiments for A939572 treatment in hPCOs). Scale bars: 50 μm (A and F), 100 μm (B, D, L, and I–K; H&E images), and 1000 μm (I–K; phase-contrast images). All panels show mean ± standard deviation. Two-tailed unpaired t test (C; left), 2-tailed Mann-Whitney test (C; right, E, and H), or Kruskal-Wallis test with 2-sided Dunn’s multiple comparison test (G). *P < 0.05, **P < 0.01, ***P < 0.001, ****P < 0.0001.

References

    1. Arnold M, Abnet CC, Neale RE, et al. Global burden of 5 major types of gastrointestinal cancer. Gastroenterology 2020;159:335–349.e15. - PMC - PubMed
    1. Hanahan D. Hallmarks of cancer: new dimensions. Cancer Discov 2022;12:31–46. - PubMed
    1. Vineis P, Schatzkin A, Potter JD. Models of carcinogenesis: an overview. Carcinogenesis 2010; 31:1703–1709. - PMC - PubMed
    1. Gillies RJ, Verduzco D, Gatenby RA. Evolutionary dynamics of carcinogenesis and why targeted therapy does not work. Nat Rev Cancer 2012;12:487–493. - PMC - PubMed
    1. Nam KT, Lee HJ, Sousa JF, et al. Mature chief cells are cryptic progenitors for metaplasia in the stomach. Gastroenterology 2010;139:2028–2037.e9. - PMC - PubMed

Publication types

MeSH terms