. 2024 Apr;15(2):615-630.
doi: 10.1002/jcsm.13432. Epub 2024 Jan 25.

RORα-GABP-TFAM axis alleviates myosteatosis with fatty atrophy through reinforcement of mitochondrial capacity

Affiliations

RORα-GABP-TFAM axis alleviates myosteatosis with fatty atrophy through reinforcement of mitochondrial capacity

Hyeon-Ji Kim et al. J Cachexia Sarcopenia Muscle. 2024 Apr.

Abstract

Background: Fat infiltration in muscle, called 'myosteatosis', precedes muscle atrophy, which subsequently results in sarcopenia. Myosteatosis is frequently observed in patients with nonalcoholic fatty liver disease (NAFLD). We have previously reported that retinoic acid receptor-related orphan receptor-α (RORα) regulates mitochondrial dynamics and mitophagy in hepatocytes, resulting in an alleviation of NAFLD. In this study, we aimed to investigate the role of RORα in skeletal muscle and to understand molecular mechanisms by which RORα controls mitochondrial capacity, using an NAFLD-associated myosteatosis mouse model.

Methods: To establish a myosteatosis model, 7-week-old C57BL/6N mice were fed with high-fat diet (HFD). After 15 weeks of diet feeding, an adeno-associated virus vector encoding RORα (AAV-RORα) was injected to gastrocnemius (GA) muscles, or after 7 weeks of HFD feeding, JC1-40, an RORα agonistic ligand, was administered daily at a dose of 5 mg/kg/day by oral gavage for 5 weeks. Histological, biochemical and molecular analyses in various in vivo and in vitro experiments were performed.

Results: First, the number of oxidative MyHC2a fibres with intensive lipid infiltration increased by 3.8-fold in the red region of the GA of mice with myosteatosis (P < 0.001). RORα was expressed around MyHC2a fibres, and its level increased by 2.7-fold after HFD feeding (P < 0.01). Second, treatment of RORα ligands in C2C12 myoblasts, such as cholesterol sulfate and JC1-40, enhanced the number of oxidative fibres stained for MyHC1 and MyHC2a by two-fold to four-fold (P < 0.01), while it reduced the lipid levels in MyHC2a fibres by 20-50% (P < 0.001) in the presence of palmitic acids. Third, mitochondrial membrane potential (P < 0.01) and total area of mitochondria (P < 0.01) were enhanced by treatment of these ligands. Chromatin immunoprecipitation analysis showed that RORα bound the promoter of GA-binding protein α subunit gene that led to activation of mitochondrial transcription factor A (TFAM) in C2C12 myoblasts (P < 0.05). Finally, intramuscular transduction of AAV-RORα alleviated the HFD-induced myosteatosis with fatty atrophy; lipid contents in MyHC2a fibres decreased by 48% (P < 0.001), whereas the number of MyHC2b fibre increased by 22% (P < 0.001). Also, administration of JC1-40 improved the signs of myosteatosis in that it decreased the level of adipose differentiation-related protein (P < 0.01) but increased mitochondrial proteins such as cytochrome c oxidase 4 and TFAM in GA muscle (P < 0.01).

Conclusions: RORα plays a versatile role in regulating the quantity of mitochondria and the oxidative capacity, ultimately leading to an improvement in myosteatosis symptoms.

Keywords: NAFLD; RORα; fatty atrophy; mitochondrial biogenesis; myosteatosis.


Conflict of interest statement

The authors declare that they have no conflicts of interest.

Figures
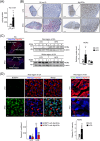
Figure 1
Figure 1
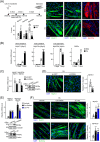
Retinoic acid receptor‐related orphan receptor‐α (RORα) expression level is enhanced in oxidative‐type muscle fibres in a high‐fat diet (HFD)‐induced myosteatosis mouse model. (A) Seven‐week‐old mice were fed with either low‐fat diet (LFD) or HFD for 20 weeks. Triglyceride (TG) contents in gastrocnemius (GA) muscles. TG content was quantified in GA tissues. ** P < 0.01 versus LFD (n = 5). (B) Oil Red O staining and immunohistochemical staining for MyHC2a of GA tissue sections. Representative images are shown. Scale bar: 1 mm. (C) Mouse GA tissues were subjected to immunostaining for MyHC2a (blue) and MyHC2b (red). Protein lysates of red region and white region of GA tissues were prepared from LFD‐ or HFD‐fed mice. Expression level of RORα was analysed by western blotting. The number represents the relative protein level of RORα when the level of LFD‐fed mouse was considered as 1. Scale bar: 1 mm. *P < 0.05 and ** P < 0.01 versus LFD (n = 5). (D) The red region of GA tissue sections of the LFD‐ or HFD‐fed mice was stained using BODIPY for visualization of lipid droplets and was subjected to immunostaining for MyHC2a (blue) and MyHC2b (red). Representative images examined by confocal microscopy are shown (left). Expression of MyHC2a (blue), MyHC2b (red) and RORα (green) was visualized by using immunofluorescence. Representative images are presented (right). For quantification of colocalization, Pearson's correlation coefficient was calculated with the JACoP plugin within ImageJ software from the GA sections of each mouse (n = 5). Fluorescence intensity of RORα (green) was quantified in one section from five mice by using ImageJ. Scale bar: 25 μm. *** P < 0.001 versus BODIPY with MyHC2a in LFD‐fed mice and ### P < 0.001 versus BODIPY with MyHC2a in HFD‐fed mice. ** P < 0.01 versus LFD (RORα).
Figure 2
Figure 2
Retinoic acid receptor‐related orphan receptor‐α (RORα) accelerates differentiation of oxidative myotubes in the presence of palmitic acids (PAs). (A) Immunostaining was performed with C2C12 cells in the presence of 0.1‐mM PA conjugated with bovine serum albumin (BSA) at Day 7 of differentiation for staining of MyHC1 (green), MyHC2a (green) or MyHC2b (red), and DAPI (blue). Representative images examined by confocal microscopy are shown. Fluorescent area was quantified in 10 images by using ImageJ software. Scale bar: 25 μm. *** P < 0.001 versus BSA. (B) C2C12 cells were incubated in differentiation medium with 0.1‐mM PA conjugated with BSA for 2 or 7 days. Total RNA was isolated, and mRNA levels of the indicated genes were measured by quantitative real‐time PCR (qRT‐PCR). *** P < 0.001 versus BSA‐treated C2C12 cells at 2 days and ### P < 0.001 versus BSA‐treated C2C12 cells at 7 days (n = 4). (C) C2C12 cells were transduced by either lenti‐sh‐GFP or lenti‐sh‐RORα. After 24 h, C2C12 cells were exposed to differentiation medium containing 0.1‐mM PA conjugated with BSA. After 7 days, total RNA was isolated and mRNA levels of the indicated genes were measured by qRT‐PCR. Expression levels of RORα in lentivirus‐transduced C2C12 cells were analysed by western blotting. *P < 0.05 versus lenti‐sh‐GFP‐transduced C2C12 cells (n = 4). (D) Immunostaining was performed with either lenti‐sh‐GFP‐ or lenti‐sh‐RORα‐transduced C2C12 myotubes in the presence of 0.1‐mM PA conjugated with BSA at Day 7 of differentiation for staining of MyHC1 (green). C2C12 myotubes stained for MyHC1 were examined by confocal microscopy. Representative images are shown. Data were obtained from three independent experiments, and fluorescence intensity was quantified in 10 images of each group by using ImageJ. Scale bar: 25 μm. *** P < 0.001 versus lenti‐sh‐GFP‐transduced C2C12 cells. (E) C2C12 cells were exposed to differentiation medium containing 0.1‐mM PA conjugated with BSA and treated with cholesterol sulfate (CH‐sulfate) or JC1‐40. After 7 days, total RNA was isolated and mRNA levels of the indicated genes were measured by qRT‐PCR. Expression levels of RORα in C2C12 myotubes treated with CH‐sulfate or JC1‐40 were analysed by western blotting. *** P < 0.001 versus vehicle (n = 4). (F) Immunostaining was performed with CH‐sulfate or JC1‐40‐treated C2C12 myotubes for staining of MyHC1 (green) or MyHC2a (green) and DAPI (blue). Representative images examined by confocal microscopy are shown. Data were obtained from three independent experiments, and fluorescence intensity was quantified in 10 images of each group by using ImageJ. Scale bar: 25 μm. ** P < 0.01 and *** P < 0.001 versus vehicle.
Figure 3
Figure 3
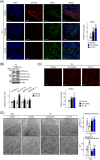
Retinoic acid receptor‐related orphan receptor‐α (RORα) enhances mitochondrial function and rescues mitochondria mass in palmitic acid (PA)‐challenged C2C12 cells. (A) C2C12 cells were exposed to differentiation medium containing 0.1‐mM PA conjugated with bovine serum albumin (BSA) and treated with cholesterol sulfate or JC1‐40. After 7 days, immunostaining was performed for staining of succinate dehydrogenase A subunit (SDHA) (green). C2C12 myotubes were stained with LipidTOX Red for staining of neural lipids and examined by confocal microscopy. Representative images are shown. Data were obtained from three independent experiments, and fluorescence intensity was quantified in 10 images of each group by using ImageJ. Scale bar: 25 μm. *** P < 0.001 versus vehicle. (B) C2C12 cells were incubated in differentiation medium with 0.1‐mM PA conjugated with BSA and treated with JC1‐40 20 μM for 2 days. Expression levels of OXPHOS proteins in electron transport chain (ETC) complexes were analysed by western blotting using a commercially available anti‐total OXPHOS primary antibody cocktail. ATP5A, ATP synthase, H+ transporting, mitochondrial F1 complex, alpha 1; MTCO1, mitochondrially encoded cytochrome c oxidase I; NDUFB8, NADH dehydrogenase (ubiquinone) 1 beta subcomplex subunit 8; UQCRC2, cytochrome bc1 complex subunit 2. Roman numbers represent the corresponding ETC complex. Band intensities of each protein were quantified using ImageJ and normalized to that of β‐actin band. *P < 0.05 versus vehicle (n = 4). (C) C2C12 cells were grown in differentiation medium with 0.1‐mM PA conjugated with BSA and treated with cholesterol sulfate (CH‐sulfate) or JC1‐40. After 48 h, cells were stained with tetramethylrhodamine, methyl ester (TMRM) and subjected to confocal microscopy. Data were obtained from three independent experiments, and fluorescence intensity was quantified at least five images of each group using ImageJ. Scale bar: 50 μm ** P < 0.01 versus vehicle. (D) C2C12 cells were grown in differentiation medium with 0.1‐mM PA conjugated with BSA and treated with cholesterol sulfate (CH‐sulfate) or JC1‐40 for 2 days. At the end of experiments, cells were fixed in 2.5% glutaraldehyde. Representative electron microscopy (EM) images are shown. Quantification of total mitochondrial area and average of mitochondrion area was performed by using ImageJ. Scale bar: 1 μm. *P < 0.05 and *** P < 0.001 versus vehicle with BSA and ## P < 0.01 and ### P < 0.001 versus vehicle with PA.
Figure 4
Figure 4
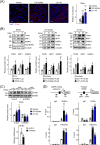
Retinoic acid receptor‐related orphan receptor‐α (RORα) induces the transcription of mitochondrial genes including GA‐binding protein α subunit (GABPα) and mitochondrial transcription factor A (TFAM). (A) Expression of TFAM in the differentiating C2C12 cells treated with cholesterol sulfate (CH‐sulfate) or JC1‐40 was visualized by immunofluorescence. Representative images are presented. Data were obtained from three independent experiments, and fluorescence intensity was quantified in 10 images of each group by using ImageJ. Scale bar: 25 μm. *** P < 0.001 versus vehicle. (B) C2C12 cells were transfected with empty vector (EV) or the expression vector encoding Flag‐RORα (RORα) or treated with CH‐sulfate or JC1‐40 in a dose‐dependent manner. Protein levels of Flag‐RORα were analysed by western blotting using anti‐Flag antibody as control. Densitometry was performed using ImageJ software, and protein levels of TFAM, NRF1 and GABPα were normalized to that of α‐tubulin or β‐actin. *P < 0.05 and ** P < 0.01 versus EV or vehicle (n = 3). (C) C2C12 cells were transfected by si‐GL3 or si‐RORα and then treated with CH‐sulfate or JC1‐40 in differentiation medium for 48 h. mRNA level of RORα was measured by quantitative real‐time PCR (qRT‐PCR) (n = 4), and the protein level of TFAM was analysed by western blotting. *P < 0.05 and ** P < 0.01 versus si‐GL3 with vehicle (n = 4). (D) C2C12 cells were treated with CH‐sulfate or JC1‐40 20 μM in differentiation medium for 48 h. DNA fragments encoding promoter of TFAM gene (GA‐binding protein [GABP] binding sequence: GACCGGAAGTCC) or the regulatory region of GABPα gene (putative RORE: AGGATCTAGGTCAA) were immunoprecipitated with the anti‐GABPα, anti‐H3K27Ac or anti‐RORα antibodies and then amplified by qPCR with specific primers. *P < 0.05 and *** P < 0.001 versus vehicle (n = 4).
Figure 5
Figure 5
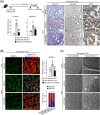
Retinoic acid receptor‐related orphan receptor‐α (RORα) overexpression alleviates myosteatosis in the high‐fat diet (HFD)‐fed mice by reducing lipid accumulation and enhancing mitochondrial biogenesis in oxidative muscle cells. (A) Seven‐week‐old wild‐type mice were fed with low‐fat diet (LFD) or HFD for 20 weeks. At 15 weeks of diet feeding, AAV9‐empty vector (EV) or AAV9‐RORα (2 × 1011 genome copies/20 μL) was injected to right gastrocnemius (GA) muscles. Lipid accumulation in red region of GA tissues was assessed by Oil Red O staining. Expression of MyHC2a and RORα in the red region of GA sections of the HFD‐fed and AAV‐RORα‐treated mouse model was visualized by immunohistochemistry. Representative images examined by confocal microscopy are shown. Quantification of Oil Red O staining and MyHC2a‐positive fibres was performed by using ImageJ. Scale bar: 100 μm. *** P < 0.001 versus LFD‐fed and AAV‐EV‐treated mouse. ### P < 0.001 versus HFD‐fed and AAV‐EV‐treated mouse (n = 5). (B) Mouse GA tissues were stained using BODIPY for visualization of lipid droplets and were subjected to immunostaining for MyHC2a (blue) and MyHC2b (red). Representative images examined by confocal microscopy are shown. Green fluorescence intensity and the percentage of blue and red fluorescent area were quantified in five mice using ImageJ. Scale bar: 50 μm. ** P < 0.01 and *** P < 0.001 versus LFD‐fed and AAV‐EV‐treated mouse and ### P < 0.001 versus HFD‐fed and AAV‐EV‐treated mouse (n = 5). (C) Representative electron microscopy (EM) images of intermyofibrillar and subsarcolemmal regions of the red region of GA tissues from the HFD‐fed and AAV‐RORα‐treated mouse. Scale bar: 1 μm.
Figure 6
Figure 6
Activation of retinoic acid receptor‐related orphan receptor‐α (RORα) restored the mitochondrial function in glycolytic fibres. (A) Mouse gastrocnemius (GA) tissues were subjected to immunostaining for MyHC2b (red). Succinate dehydrogenase (SDH) staining was performed in the GA sections of the high‐fat diet (HFD)‐fed and AAV‐RORα‐treated mouse model. Tissues were examined by using an automated multimodal tissue analysis system, and representative images are shown. Scale bar: 1 mm (MyHC2b and SDH activity) or 50 μm (RORα). (B) C2C12 cells were exposed to differentiation medium containing 0.1‐mM palmitic acid (PA) conjugated with bovine serum albumin (BSA) and treated with cholesterol sulfate (CH‐sulfate) or JC1‐40. After 7 days, total RNA was isolated and mRNA level of Myh4 was measured by quantitative real‐time PCR (qRT‐PCR). *** P < 0.001 versus vehicle (n = 4). (C) Immunostaining was performed with C2C12 cells in the presence of 0.1‐mM PA conjugated with BSA at Day 7 of differentiation for staining of MyHC2b (red) and DAPI (blue). Representative images examined by confocal microscopy are shown. Data were obtained from three independent experiments, and fluorescence intensity was quantified in 10 images of each group by using ImageJ. Scale bar: 25 μm. *** P < 0.001 versus vehicle.
Figure 7
Figure 7
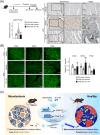
Administration of the retinoic acid receptor‐related orphan receptor‐α (RORα) activator, JC1‐40, attenuates muscular lipid accumulation and rescues mitochondria mass in high‐fat diet (HFD)‐fed mouse model. Wild‐type C57BL/6N mice were fed with either low‐fat diet (LFD) or HFD for 12 weeks. After 7 weeks of diet feeding, JC1‐40 was administered daily at doses of 5 mg/kg/day by oral gavage for 5 weeks. (A) Mouse gastrocnemius (GA) tissues were subjected to immunohistochemistry for staining of adipose differentiation‐related protein, also known as perilipin 2 (ADFP/PLIN2), and RORα. Tissues were examined by using an automated multimodal tissue analysis system, and representative images are presented. Quantification of ADFP/PLIN2‐positive area was performed by using ImageJ. Scale bar: 50 μm. ** P < 0.01 versus LFD‐fed and vehicle‐treated mice and ## P < 0.01 versus HFD‐fed and vehicle‐treated mice (n = 5). (B) Expression of cytochrome c oxidase 4 (COX4), succinate dehydrogenase A subunit (SDHA) and mitochondrial transcription factor A (TFAM) in GA sections of the HFD‐fed and JC1‐40‐treated mouse model was visualized by using immunofluorescence. Representative images are presented. Quantification of fluorescence intensity of COX4, succinate dehydrogenase (SDH) and TFAM was performed by using ImageJ. Scale bar: 100 μm. *** P < 0.001 versus LFD‐fed and vehicle‐treated mouse (n = 5). ## P < 0.01 and ### P < 0.001 versus HFD‐fed and vehicle‐treated mouse (n = 5). (C) Schematic model for the mechanism of RORα‐induced mitochondrial biogenesis in oxidative fibres, leading to attenuation of NAFLD‐associated myosteatosis.

References

    1. Li C‐w, Yu K, Shyh‐Chang N, Jiang Z, Liu T, Ma S, et al. Pathogenesis of sarcopenia and the relationship with fat mass: descriptive review. J Cachexia Sarcopenia Muscle 2022;13:781–794. - PMC - PubMed
    1. Baskin Kedryn K, Winders Benjamin R, Olson EN. Muscle as a “mediator” of systemic metabolism. Cell Metab 2015;21:237–248. - PMC - PubMed
    1. Schiaffino S, Reggiani C. Fiber types in mammalian skeletal muscles. Physiol Rev 2011;91:1447–1531. - PubMed
    1. He J, Watkins S, Kelley DE. Skeletal muscle lipid content and oxidative enzyme activity in relation to muscle fiber type in type 2 diabetes and obesity. Diabetes 2001;50:817–823. - PubMed
    1. Mastrocola R, Collino M, Nigro D, Chiazza F, D'Antona G, Aragno M, et al. Accumulation of advanced glycation end‐products and activation of the SCAP/SREBP lipogenetic pathway occur in diet‐induced obese mouse skeletal muscle. PLoS ONE 2015;10:e0119587. - PMC - PubMed