. 2024 Jan 25;15(1):726.
doi: 10.1038/s41467-024-44888-x.

Revealing the hidden carbon in forested wetland soils

Affiliations

Revealing the hidden carbon in forested wetland soils

Anthony J Stewart et al. Nat Commun. .

Abstract

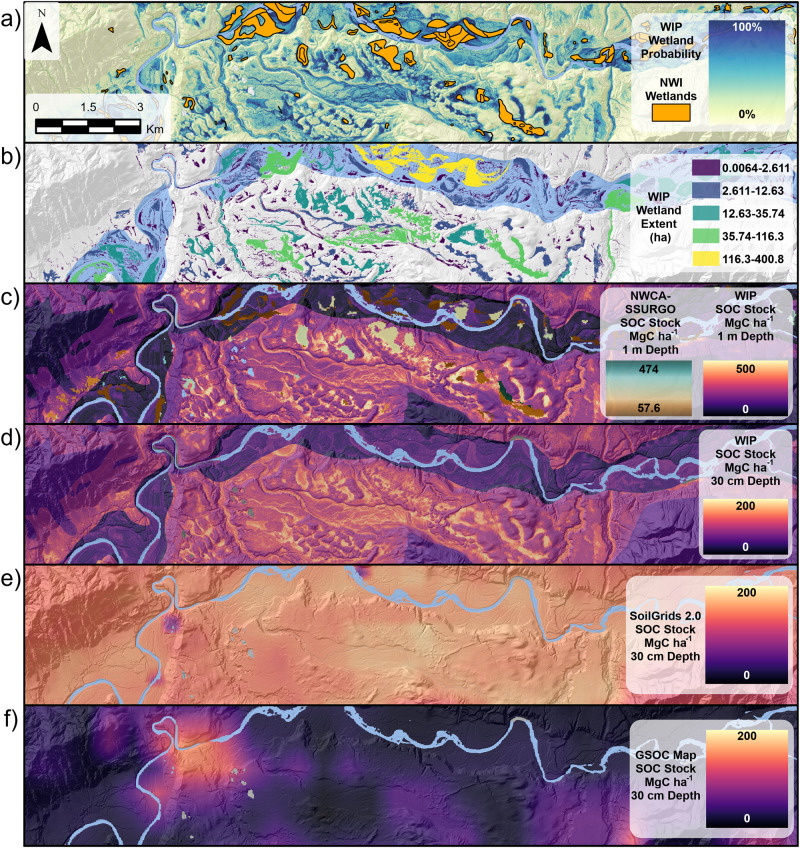
Inland wetlands are critical carbon reservoirs storing 30% of global soil organic carbon (SOC) within 6% of the land surface. However, forested regions contain SOC-rich wetlands that are not included in current maps, which we refer to as 'cryptic carbon'. Here, to demonstrate the magnitude and distribution of cryptic carbon, we measure and map SOC stocks as a function of a continuous, upland-to-wetland gradient across the Hoh River Watershed (HRW) in the Pacific Northwest of the U.S., comprising 68,145 ha. Total catchment SOC at 30 cm depth (5.0 TgC) is between estimates from global SOC maps (GSOC: 3.9 TgC; SoilGrids: 7.8 TgC). For wetland SOC, our 1 m stock estimates are substantially higher (Mean: 259 MgC ha-1; Total: 1.7 TgC) compared to current wetland-specific SOC maps derived from a combination of U.S. national datasets (Mean: 184 MgC ha-1; Total: 0.3 TgC). We show that total unmapped or cryptic carbon is 1.5 TgC and when added to current estimates, increases the estimated wetland SOC stock to 1.8 TgC or by 482%, which highlights the vast stores of SOC that are not mapped and contained in unprotected and vulnerable wetlands.


Conflict of interest statement

The authors declare no competing interests.

Figures

Fig. 1
Fig. 1. Model predicted soil organic carbon (SOC) stock compared to field sampled pedon SOC stock with a gradient of probability from the Wetland Intrinsic Potential (WIP) tool.
Modeled SOC stocks were back transformed from square root values in the original linear mixed effects model with the fixed effect of WIP probability and random effect of surficial geology. Shading represents WIP probability. Shapes represent different surficial geology categories. Prediction intervals are based on bootstrapped 95% confidence intervals.
Fig. 2
Fig. 2. Maps of surficial geology and Wetland Intrinsic Potential (WIP) probability parameters and soil organic carbon (SOC) model output in the Hoh River Watershed (HRW).
a Shows the surficial geology categories of the HRW by color classes in surficial geology legend, b shows the WIP probability gradient shown by yellow-blue shading indicated in WIP legend, c shows the predicted 1 m SOC stock across the HRW with purple-to-yellow shading that continues in inset maps showing fine scale SOC patterns overlain by estimated SOC shown by brown-teal shading from the harmonized National Wetland Condition Assessment and Soil Survey Geographic Database (NWCA-SSURGO) dataset in ref. and additional current wetland extent from the National Wetland Inventory (NWI). We added a semi-transparent hill shade layer to highlight terrain and removed the river surface water shown in light blue for the final prediction map.
Fig. 3
Fig. 3. Maps of wetland surface areas and soil organic carbon (SOC) stocks compared current national and global map products.
a Shows the Wetland Intrinsic Potential (WIP) tool wetland probability gradient shown by yellow-blue shading overlain by orange National Wetland Inventory (NWI) wetlands; b shows size classes of wetland extent colored by size ranges where wetlands are defined WIP ≥ 50%; c shows the 1 m WIP modeled SOC stock distribution with purple-to-yellow shading overlain by SOC estimates from National Wetland Condition Assessment and Soil Survey Geographic Database (NWCA-SSURGO) dataset shown by brown-teal shading; d shows the 30 cm WIP modeled SOC stock distribution with purple-to-yellow shading; e shows the 30 cm SoilGrids 2.06 modeled SOC stock distribution with purple-to-yellow shading; and f shows the 30 cm SOC stocks from the United Nations Forest and Agriculture Organization (UN FAO) Global Soil Organic Carbon (GSOC) Map with purple-to-yellow shading. All maps have an added a semi-transparent hill shade layer to highlight terrain and removed the river surface water shown in light blue.
Fig. 4
Fig. 4. The region of the United States with the location of the Hoh River Watershed (HRW) with National Wetland Inventory (NWI).
The HRW is located in the Pacific Northwest of the United States on the coast of Washington State. The eastern portion of the HRW is mountainous and drains westward to the ocean, which is highlighted by the shaded elevation and topography. Circle inset maps show the eastern and western portions of the lower watershed with wetlands from the NWI colored in orange. We color the river basin area with light blue for the HRW. Base map image credits are listed below the map figure. Regional base map imagery provided by OpenStreetMap under the Open Data Commons Open Database License (ODbL) v1.0 (https://opendatacommons.org/licenses/odbl/1-0/).

References

    1. Griscom BW, et al. Natural climate solutions. Proc. Natl Acad. Sci. 2017;114:11645–11650. doi: 10.1073/pnas.1710465114. - DOI - PMC - PubMed
    1. Jackson RB, et al. The ecology of soil carbon: pools, vulnerabilities, and biotic and abiotic controls. Annu. Rev. Ecol. Evol. Syst. 2017;48:419–445. doi: 10.1146/annurev-ecolsys-112414-054234. - DOI
    1. Poulter, B. et al. A review of global wetland carbon stocks and management challenges. In Wetland Carbon and Environmental Management 1–20 (American Geophysical Union (AGU), 2021). 10.1002/9781119639305.ch1.
    1. Zhang Z, et al. Development of the global dataset of wetland area and dynamics for methane modeling (WAD2M) Earth Syst. Sci. Data. 2021;13:2001–2023. doi: 10.5194/essd-13-2001-2021. - DOI
    1. Hugelius, G. Spatial upscaling using thematic maps: an analysis of uncertainties in permafrost soil carbon estimates. Glob. Biogeochem. Cycles26, 1–15 (2012).