. 2024 Jan 25;15(1):743.
doi: 10.1038/s41467-024-44886-z.

WNT-dependent interaction between inflammatory fibroblasts and FOLR2+ macrophages promotes fibrosis in chronic kidney disease

Affiliations

WNT-dependent interaction between inflammatory fibroblasts and FOLR2+ macrophages promotes fibrosis in chronic kidney disease

Camille Cohen et al. Nat Commun. .

Abstract

Chronic kidney disease (CKD) is a public health problem driven by myofibroblast accumulation, leading to interstitial fibrosis. Heterogeneity is a recently recognized characteristic in kidney fibroblasts in CKD, but the role of different populations is still unclear. Here, we characterize a proinflammatory fibroblast population (named CXCL-iFibro), which corresponds to an early state of myofibroblast differentiation in CKD. We demonstrate that CXCL-iFibro co-localize with macrophages in the kidney and participate in their attraction, accumulation, and switch into FOLR2+ macrophages from early CKD stages on. In vitro, macrophages promote the switch of CXCL-iFibro into ECM-secreting myofibroblasts through a WNT/β-catenin-dependent pathway, thereby suggesting a reciprocal crosstalk between these populations of fibroblasts and macrophages. Finally, the detection of CXCL-iFibro at early stages of CKD is predictive of poor patient prognosis, which shows that the CXCL-iFibro population is an early player in CKD progression and demonstrates the clinical relevance of our findings.


Conflict of interest statement

F.M.-G. received research support from Innate-Pharma, Institut Roche, Roche, and Bristol-Myers-Squibb (BMS). Other authors declare no potential conflict of interest.

Figures
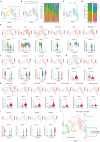
Fig. 1
Fig. 1. Identification of distinct mesenchymal clusters in CKD.
a UMAP of scRNAseq data from 2495 mesenchymal cells across 12 patients suffering or not from CKD, allowing the visualization of the first 6 clusters (clusters 0 to 5). Colors show the different clusters defined by graph-based clustering method. b Left, Same UMAP as in (a) showing cell repartition across patients (P1 to P12). Right, Barplot representing the proportion of cells of the first 6 clusters (clusters 0 to 5) in each patient (P1 to p12). c Same UMAP as in (a) showing cell repartition according to disease status (Control in red for patients without CKD; CKD in blue for patients with chronic kidney disease). d Bar plot showing the percentages of the different clusters according to disease status, i.e., Control or CKD (N = 6 and 6, respectively). P-value from two-sided Fisher Exact test. e UMAP (top) and Violin plot (bottom) showing expression of marker genes according to the different clusters for mesenchymal cells (PDGFRB, VIM), pericytes (RGS5, NOTCH3) and fibroblasts (DCN, PDGFRA). f UMAP (top) and Violin plot (bottom) showing expression of representative genes for the different clusters. g UMAP (top) and Violin plot (bottom) showing the average z-score of genes that compose specific signatures of CAF-S1 and CAF-S4 (Table S2). Statistical test = two-sided Fisher Test. h Same as in (g) with the different CAF-S1 clusters identified in. Statistical test = two-sided Fisher Test. i UMAP (top) and Violin plot (bottom) showing expression of representative genes for each cluster identified in CKD. j UMAP showing new annotations (defined by differential gene expression pathways) of the 6 clusters (0 to 5) identified in Control and CKD patients.
Fig. 2
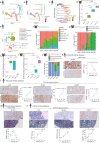
Fig. 2. Accumulation of CXCL-iFibro and ECM-myFibro clusters at distinct stages of chronic kidney disease.
a UMAP showing trajectory inference using Monocle 3. b Same UMAP as in (a) showing computed pseudotime by Monocle 3. c Expression of genes of interest according to Monocle 3 pseudotime. d ECM-score calculated on the kidney bulk RNAseq data from mice undergoing UUO at different time points (n = 15 mice). Statistical test = two-sided Mann-Whitney U-test with Benjamini-Hochberg adjustment. e UMAP of scRNAseq data from 49 226 cells from with annotation used for bulk RNAseq deconvolution. f Results of the deconvolution of bulk RNAseq data from UUO mouse model. g Same as (f) but in mesenchymal cells. h Proportion of inflammatory fibroblasts estimated by deconvolution after UUO relative to control mice (n = 15 mice). Statistical test = two-sided Mann-Whitney U-test with Benjamini-Hochberg adjustment. i same as (h) for ECM-secreting myofibroblasts (n = 15 mice). Statistical test = two-sided Mann-Whitney U-test with Benjamini-Hochberg adjustment. j estimated cell proportion of inflammatory fibroblasts, pericytes and ECM-secreting myoFibroblasts after label transfer on a single cell RNAseq dataset from mice after UUO from. IHC showing staining of SFRP1 (k), FAP, SFRP4 and RAMP1 (l) in PKD patients. Left: Representative serial IHC; Right: Corresponding quantification of H-scores in interstitial cells and the average percentage of fibrosis per quantified fields. N = 12 PKD patients. Scale bar = 50 µm (upper panel) and 100 µm (lower panel). Statistical test = two-sided Spearman correlation test. IHC showing staining of SFRP1 (m), FAP, SFRP4 and RAMP1 (n) in fibrotic kidney biopsies. Top: Representative images of IHC staining; Middle: Representative images of Masson’s trichrome staining of biopsies shown in IHC; Bottom: Corresponding quantifications of H-scores and percentage of fibrosis. N = 13. Scale bar = 50 µm (upper panel), 100 µm (lower panel). Statistical test = two-sided Spearman correlation test. For (d), (h) and (i): boxplot represents the median (centre), first (Q1) and 3rd (Q3) quartiles (bounds of the box), Q1 + 1.5 × Interquartile range (IQR) and Q3-1.5 × IQR (whiskers). For (kn) the error bar represents the 95% confidence level interval for predictions from a linear model, except for (m), where the model is “Loess”.
Fig. 3
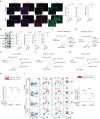
Fig. 3. Inflammatory fibroblasts are in close vicinity of FOLR2+ macrophages.
a Representative images (top) and corresponding quantifications (bottom) of IF co-staining of CD68 and SFRP1 (inflammatory fibroblast marker) in PKD patients (N = 6). Bottom left panel represents the average number of positive cells per patient. Bottom right panel represents the correlation between the number of positive cells per surface unit, each dot representing a field of 18 600µm2. Scale bar = 20 µm. N = 6 PKD patients. Statistical test = two-sided Spearman correlation test. b Same as in (a) in fibrotic kidney biopsies. N = 10 patients with fibrotic kidney. Statistical test = two-sided Spearman correlation test. c Same as (a) but between CD68 and FAP (ECM-secreting myofibroblasts). Scale bar = 20 µm. N = 6 PKD patients. Statistical test = two-sided Spearman correlation test. d UMAP of scRNAseq data from 3960 myeloid cells from. Macrophages (Mϕ), Dentritic cells (DC). e same UMAP as in (d) showing cell repartition in Control (red, n = 6) or CKD (blue, n = 6) patients. f Percentages myeloid cells clusters according to Control or CKD. Two-sided Fisher Exact test. g Proportion of myeloid cell cluster in each patient (n = 10). h Representative images (top) and corresponding quantifications (bottom) showing IF co-staining of FOLR2, TREM2 and SFRP1 in PKD patients (N = 6). Scale bar = 20 µm. (N = 6 PKD patients). Statistical test = two-sided Spearman correlation test. i Same as in (h) in fibrotic kidney biopsies (N = 11 patients with fibrotic kidney). Statistical test = two-sided Spearman correlation test. j Same as in (h) for FOLR2+, TREM2+ cells, and FAP+ cells in PKD patients (N = 6). Scale bar = 20 µm (k) Non-negative matrix factorization of the deconvolution output with 6 factors highlighting different microenvironment. Color and size of the dots represent the proportion of cells of each cell type. l Results of the deconvolution for different compartment using Cell2Location on Patient 1, described in Table S5. The number of predicted cells is plotted on the tissue. m Same as (k) but with 11 factors. For (ac) and (hj) the error bar represents the 95% confidence level interval for predictions from a linear model.
Fig. 4
Fig. 4. CXCL-iFibro attract CD14+ monocytes and induces a switch into FOLR2+ macrophages.
a Representative images (left panel) and quantifications (right panel) showing the expression of E-Cadherin/CDH1, SFRP1, SFRP4 and αSMA in primary fibroblasts cultured on collagen- (top) or plastic-dishes (bottom). Images at the bottom left corner are higher magnifications of other images from the same experiment. Quantification represents the average MFI of at least 100 cells per condition per independent experiment. Data are expressed as fold change to the paired collagen condition. n = 3 independent experiments. Scale bars = 20 µm. Statistical test = two-sided Mann-Whitney U-test. b Representative western blots (left) and corresponding quantifications (right) showing the expression of SFRP1, SFRP4, FAP and αSMA in primary fibroblasts cultured on collagen- or plastic-dishes. P-values from Mann-Whitney test (n = 3 independent experiments). Statistical test = two-sided Mann-Whitney U-test. cg Cellchat analysis of the ligand-receptor interaction between CXCL-iFibro and myeloid cells. Chordplots of the number of significant interactions (c) and the strength of interactions (d) between CXCL-iFibro and myeloid cells. Chordplots showing the CXCL12-CXCR4- (e), the ANGPTL1-LILR3- (f) and the THBS1-CD36- (g) ligand-receptor interaction between CXCL-iFibro and myeloid cells. h Quantification of the percentage of CD14+ monocytes transmigrating through a transwell, in presence or not of collagen- or plastic-cultured fibroblasts. P-values from Kruskall-Wallis tests (n = 3 independent experiments with three different cells lines and 2 PBMC from healthy donors). i Representative plots and corresponding quantification of flow cytometry analysis aiming at characterizing macrophage phenotype after 24 h of co-culture of CD14+ monocytes with either collagen- or plastic-cultured fibroblasts. From left to right columns are represented FSC-A/SSC-A, CD14/CD16, CD14-CD206 and FOLR2/TREM2 expression. Quantifications on the right show the percentage of FOLR2 + CD206+ macrophages among alive CD14+ monocytes. P-values from Kruskall-Wallis test (n = 4 independent experiments with three different cell lines and 4 PBMC from healthy donors). For (a, b) and (h, i): boxplot represents the median (centre), first (Q1) and 3rd (Q3) quartiles (bounds of the box), Q1 + 1.5 × Interquartile range (IQR) and Q3-1.5xIQR (whiskers). Abbreviations: MW molecular weight.
Fig. 5
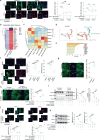
Fig. 5. Macrophages induce a switch from CXCL-iFibro to ECM-secreting myoFibro through a WNT/β-catenin dependent pathway.
a IF image and quantification showing DAPI (blue), αSMA (green), and SFRP4 (red) staining in fibroblasts plated on collagen- or plastic- dishes ± co-culture with CD14+ monocytes. Scale bar = 50 µm (main image) or 20 µm (higher magnification). Adjusted p-values (BH) from two-sided Mann-Whitney test (n = 3 independent experiments). b Heatmap showing the result of the transcription factor inference using Dorothea algorithm between CXCL-iFibro and ECM-secreting myofibro. c Heatmap showing the expression of gene modules identified by Monocle 3 according to fibroblast cluster. d UMAP showing the average z-score of module 4 gene expression (left) in the UMAP obtained by Monocle 3 (right, same as Fig. 2a). e TRRUST analysis of genes specifically upregulated in module 4, using Metascape.org. f same as (a) in collagen-cultured fibroblasts ± WNT agonists. Scale bar = 100 µm (main image) or 20 µm (higher magnification). Adjusted p-values (BH) from two-sided Mann-Whitney test (n = 3 independent experiments). g IF image and quantification showing DAPI (blue) and β-catenin protein (green) in fibroblasts in collagen- (top) or plastic- (bottom) dishes. Scale bar = 20 µm. P-value from two-sided Mann-Whitney test. (n = 4 independent experiments). h Same as in (g) for collagen-cultured fibroblasts ± co-culture with CD14+ monocytes, ±inhibitor of β-catenin/TCF interaction (iCRT3). Scale bar = 20 µm. Adjusted p-values (BH) from two-sided Mann-Whitney test. (n = 4 independent experiments). i Western blots and quantifications showing β-catenin, Histone H3, and EIF4A1 protein following cytoplasmic and nuclear fractionation in collagen-cultured fibroblasts ± co-culture with CD14+ monocytes, ±β-catenin/TCF interaction (iCRT3) and PORCN (C59) inhibitors. Adjusted p-values (BH) from two-sided Mann-Whitney test. (n = 4 independent experiments). j Same as in (h) for DAPI (blue), αSMA (green) and SFRP4 (red) Scale bar = 50 µm (main image) or 20 µm (higher magnification). Adjusted p-values (BH) from two-sided Mann-Whitney test. (n = 4 independent experiments). k Western blots and quantifications of αSMA and SFRP4 in fibroblasts ± co-culture with CD14+ monocytes, ±β-catenin/TCF interaction (iCRT3) and PORCN(C59) inhibitors. Adjusted p-values (BH) from two-sided Mann-Whitney test. (n = 4 independent experiments). For (a) and (fk), boxplots are defined similarly than in Fig. 3.
Fig. 6
Fig. 6. Expression of CXCL-iFibro gene signature predicts poor outcome of early CKD patients.
a same UMAP as in Fig. S3a and violin plots showing the average z-score expression of CXCL-iFibro gene signature. b same UMAP as in Fig. 1 and violin plots showing the average z-score expression of CXCL-iFibro gene signature. c Kaplan-Meier curve for the composite outcome (ESRD or loss of more than 40% of eGFR) according to the expression of CXCL-iFibro signature. N = 134 patients; events: 4 vs 27 in the low- and high- expression group respectively. P-value from Log-rank test. d Results of Cox multivariate analysis according to the following variables: eGFR at biopsy, age of the patient, UPCR, presence of hypertension and CXCL-iFibro expression score (N = 134 patients). Statistical model = multivariable Cox model. e Mean expression of CXCL-iFibro gene signature according to the progressor status of CKD patients (Slow progressor N = 99; Fast progressor N = 29). Statistical test = two-sided t-test. f Proportion of CKD patients with low (below median) or high (above median) CXCL-iFibro expression score according to patient progression status. P-value from two-sided Fisher Exact test. g Correlation between the CXCL-iFibro expression score and the eGFR slope. P-value from two-sided Spearman correlation test. h same as (c) according to FOLR2 expression. N = 134 patients; events: 3 vs. 28 in the low- and high- expression group respectively. P-value from Log-rank test. i Results of Cox multivariate analysis according to the following variables: eGFR at biopsy, age of the patient, UPCR, presence of hypertension, and FOLR2 expression (N = 134 patients). Statistical model = multivariable Cox model. j Same as in (e) but for FOLR2 expression. Statistical test = two-sided t-test. k Same as in (f) but for FOLR2 expression. Statistical test = two-sided exact Fisher test. l Correlation between FOLR2 and the CXCL-iFibro expression score. P-value from two-sided Spearman correlation test (N = 128 patients). For (d), (i), (g), and (l) the error bar represents the 95% confidence interval. For (e) and (j): boxplot represents the median (centre), first (Q1) and 3rd (Q3) quartiles (bounds of the box), Q1 + 1.5 × Interquartile range (IQR) and Q3 − 1.5 × IQR (whiskers). Abbreviations: eGFR estimated glomerular filtration rate, HTN hypertension, UPCR urinary protein-to-creatinine ratio, ESRD end-stage renal disease.

References

    1. Collaboration GBDCKD. Global, regional, and national burden of chronic kidney disease, 1990-2017: a systematic analysis for the Global Burden of Disease Study 2017. Lancet. 2020;395:709–733. doi: 10.1016/S0140-6736(20)30045-3. - DOI - PMC - PubMed
    1. Duffield JS. Cellular and molecular mechanisms in kidney fibrosis. J. Clin. Invest. 2014;124:2299–2306. doi: 10.1172/JCI72267. - DOI - PMC - PubMed
    1. Humphreys BD, et al. Fate tracing reveals the pericyte and not epithelial origin of myofibroblasts in kidney fibrosis. Am. J. Pathol. 2010;176:85–97. doi: 10.2353/ajpath.2010.090517. - DOI - PMC - PubMed
    1. Kramann R, DiRocco DP, Humphreys BD. Understanding the origin, activation and regulation of matrix-producing myofibroblasts for treatment of fibrotic disease. J. Pathol. 2013;231:273–289. doi: 10.1002/path.4253. - DOI - PubMed
    1. Kramann R, Humphreys BD. Kidney pericytes: roles in regeneration and fibrosis. Semin. Nephrol. 2014;34:374–383. doi: 10.1016/j.semnephrol.2014.06.004. - DOI - PMC - PubMed